How fast did AI-assistant screens spread across mobile apps?
- By Ali Abouelatta
- n = 730
- Published
- Updated
- 2 min read
- ux-patterns · mobile · onboarding · saas · design
Short answer
AI-assistant screens roughly quadrupled in prevalence, from 2.4% of captured apps in 2023 to 8.8% in 2025 (64 of 730 companies) source[1]. The jump traces to the generative-AI wave: ChatGPT was first captured January 2024, followed by a Perplexity/Notion cluster that April source[2]. If you are deciding whether an in-app assistant is table stakes, it is still a minority pattern but the fastest-climbing AI surface measured.
AI-assistant screens reached 8.8% of captured apps in 2025, up from 2.4% in 2023 - roughly a 4x rise (July 2026).
Bar chart · Companies with pattern
Companies with pattern — The trend: 2.4% to 8.8% over three years
One block is about 2.3 Companies with pattern
- 2023
- 7
- 2024
- 24
- 2025
- 64
The trend: 2.4% to 8.8% over three years
Share of captured apps showing an AI-assistant, AI-chat, chatbot, or conversational-AI screen, normalized to the distinct companies captured each year:
That is a roughly 4x climb across the reliable window. 2026 is a partial year (captures through July 4) with thin tagging, so its 2.0% reading is a capture artifact, not a decline - we exclude it from the trend number[3].
Emergence timeline
First-capture dates confirm genuine chronological emergence rather than a tagging shift. A 2023 trickle came from health and education apps - Libby (Feb 2023), Carrot (Apr 2023), Flo (May 2023), Brainly (Sep 2023) - before the generative wave hit mainstream productivity: ChatGPT first captured Jan 20 2024, then Perplexity (Apr 22 2024) and Notion (Apr 19 2024) source[2].
How to apply it
At 8.8% prevalence, an in-app AI assistant is still a differentiator, not yet an expectation, in the broad app corpus - but its trajectory is the steepest of any AI surface tracked (AI media generators sat flat near 3.4% over the same period) source[1]. If your category skews productivity, education, or health, weight the adoption higher than the corpus average, since those verticals led. Treat the 8.8% as a lower bound: tag recall is imperfect, so true prevalence is likely somewhat higher.
Caveats
Prevalence is deduped by distinct company and matched on the tag patterns %ai assistant%, %ai chat%, %chatbot%, %conversational ai%; values are lower bounds bounded by tag recall source[1]. Do not read raw screenshot counts as a trend - capture cadence swings hard quarter to quarter, which is why every figure normalizes to companies-captured-per-year number[4]. 2022 (one company) and partial-2026 are never used as trend points number[3].
Real in-market screens
Screens from real, in-market apps, tracked by Lazyweb Research.
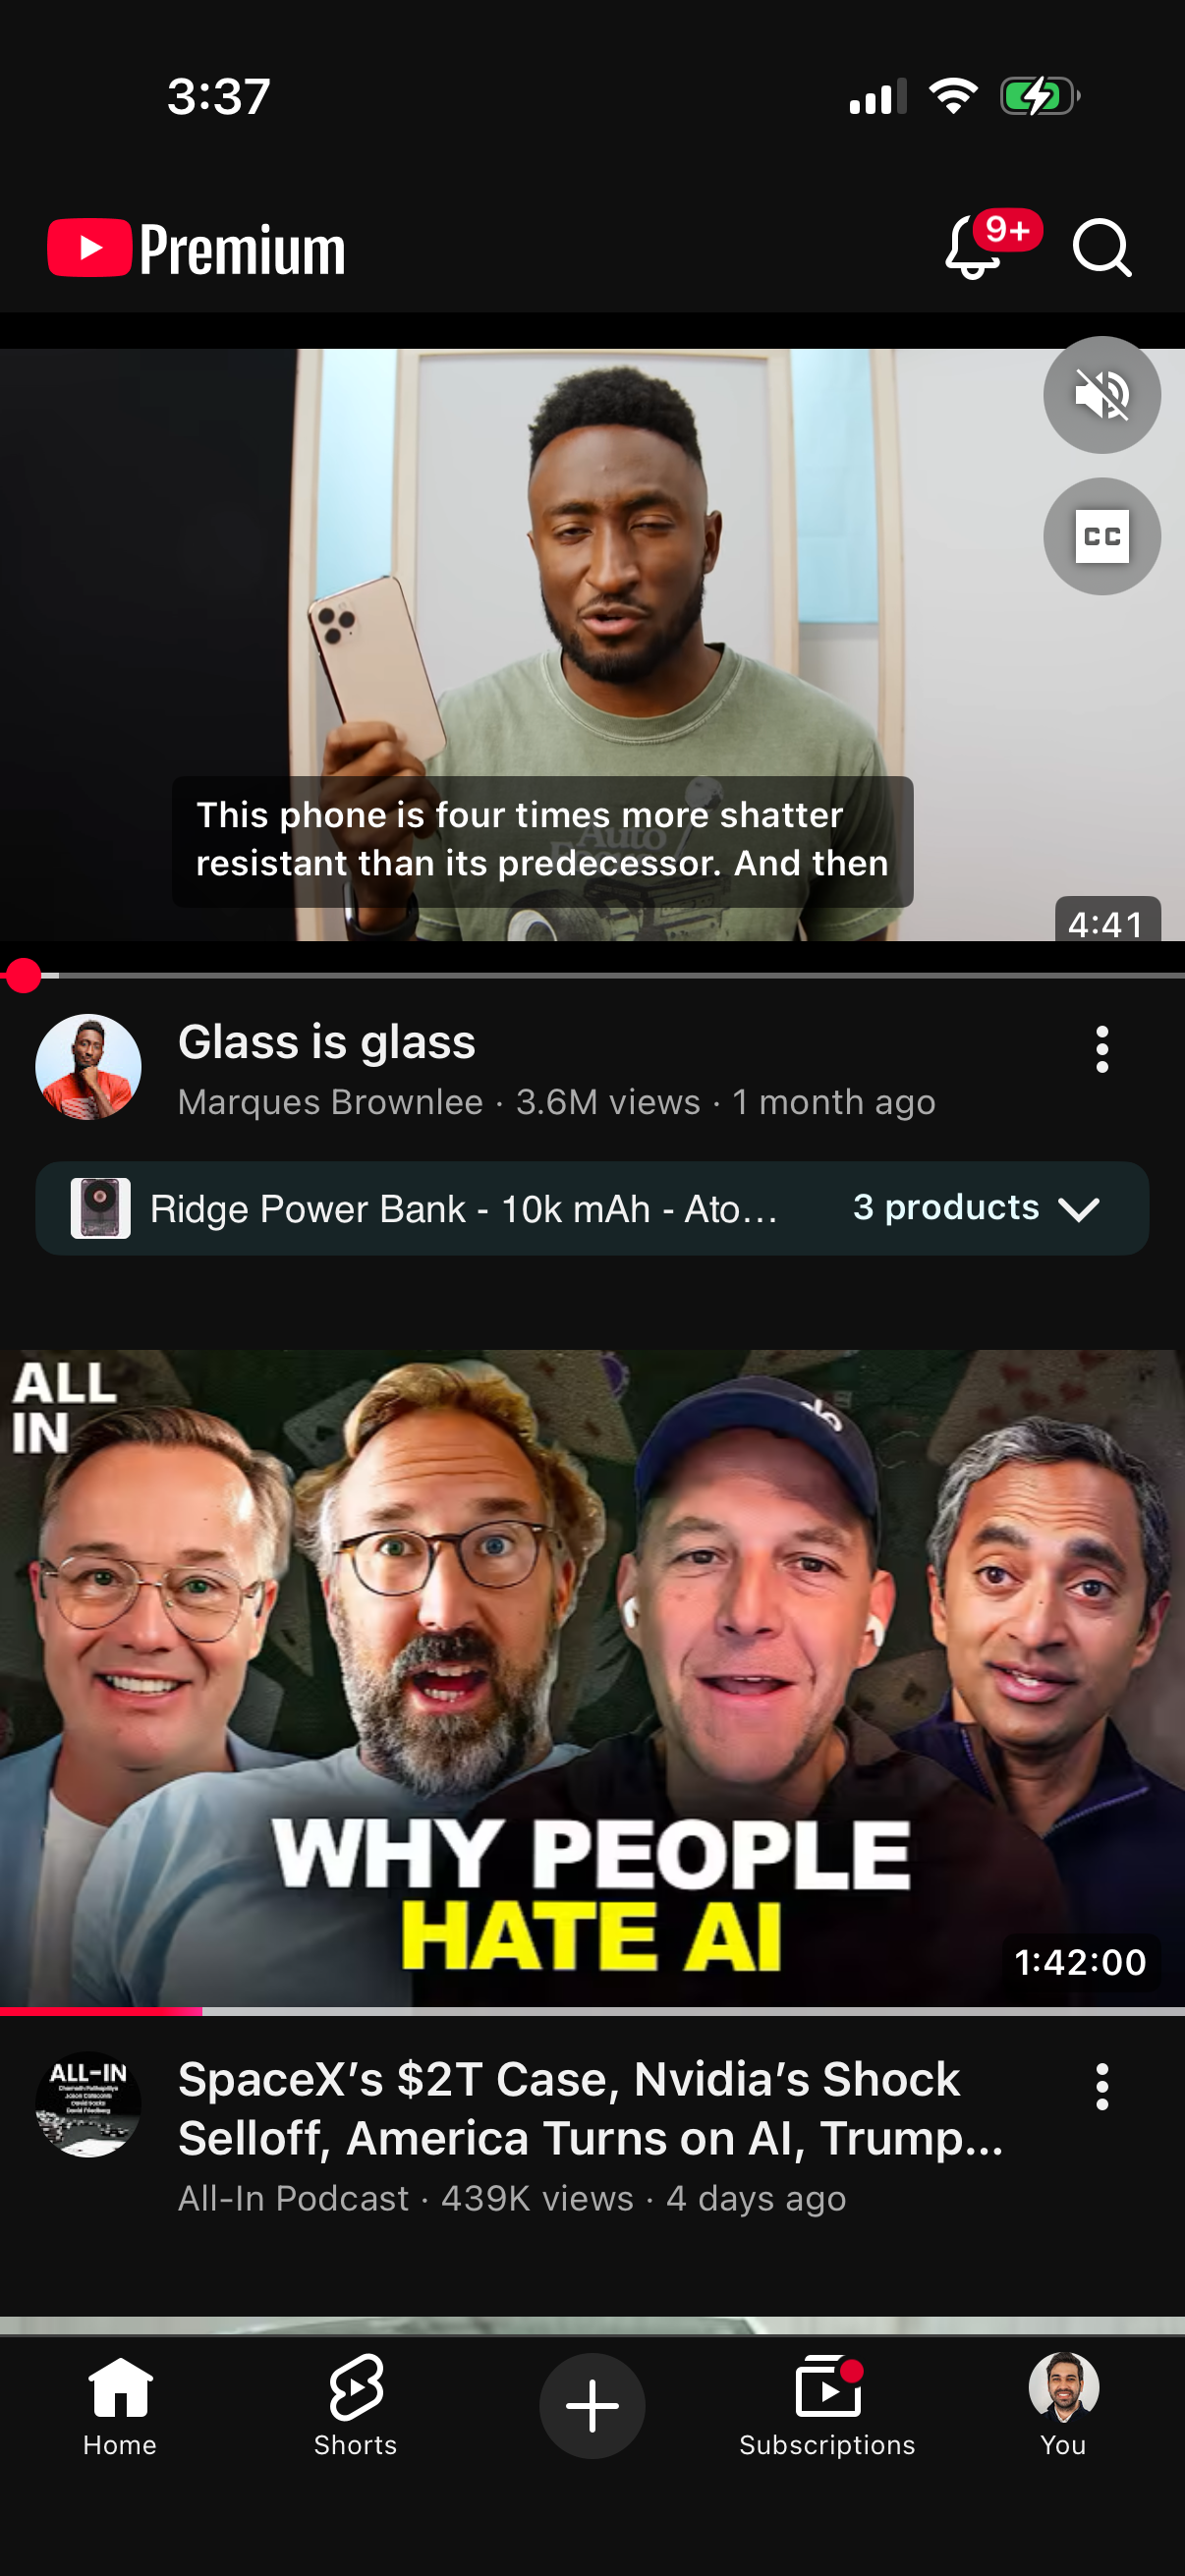
Youtube1206 × 2622opens the full image 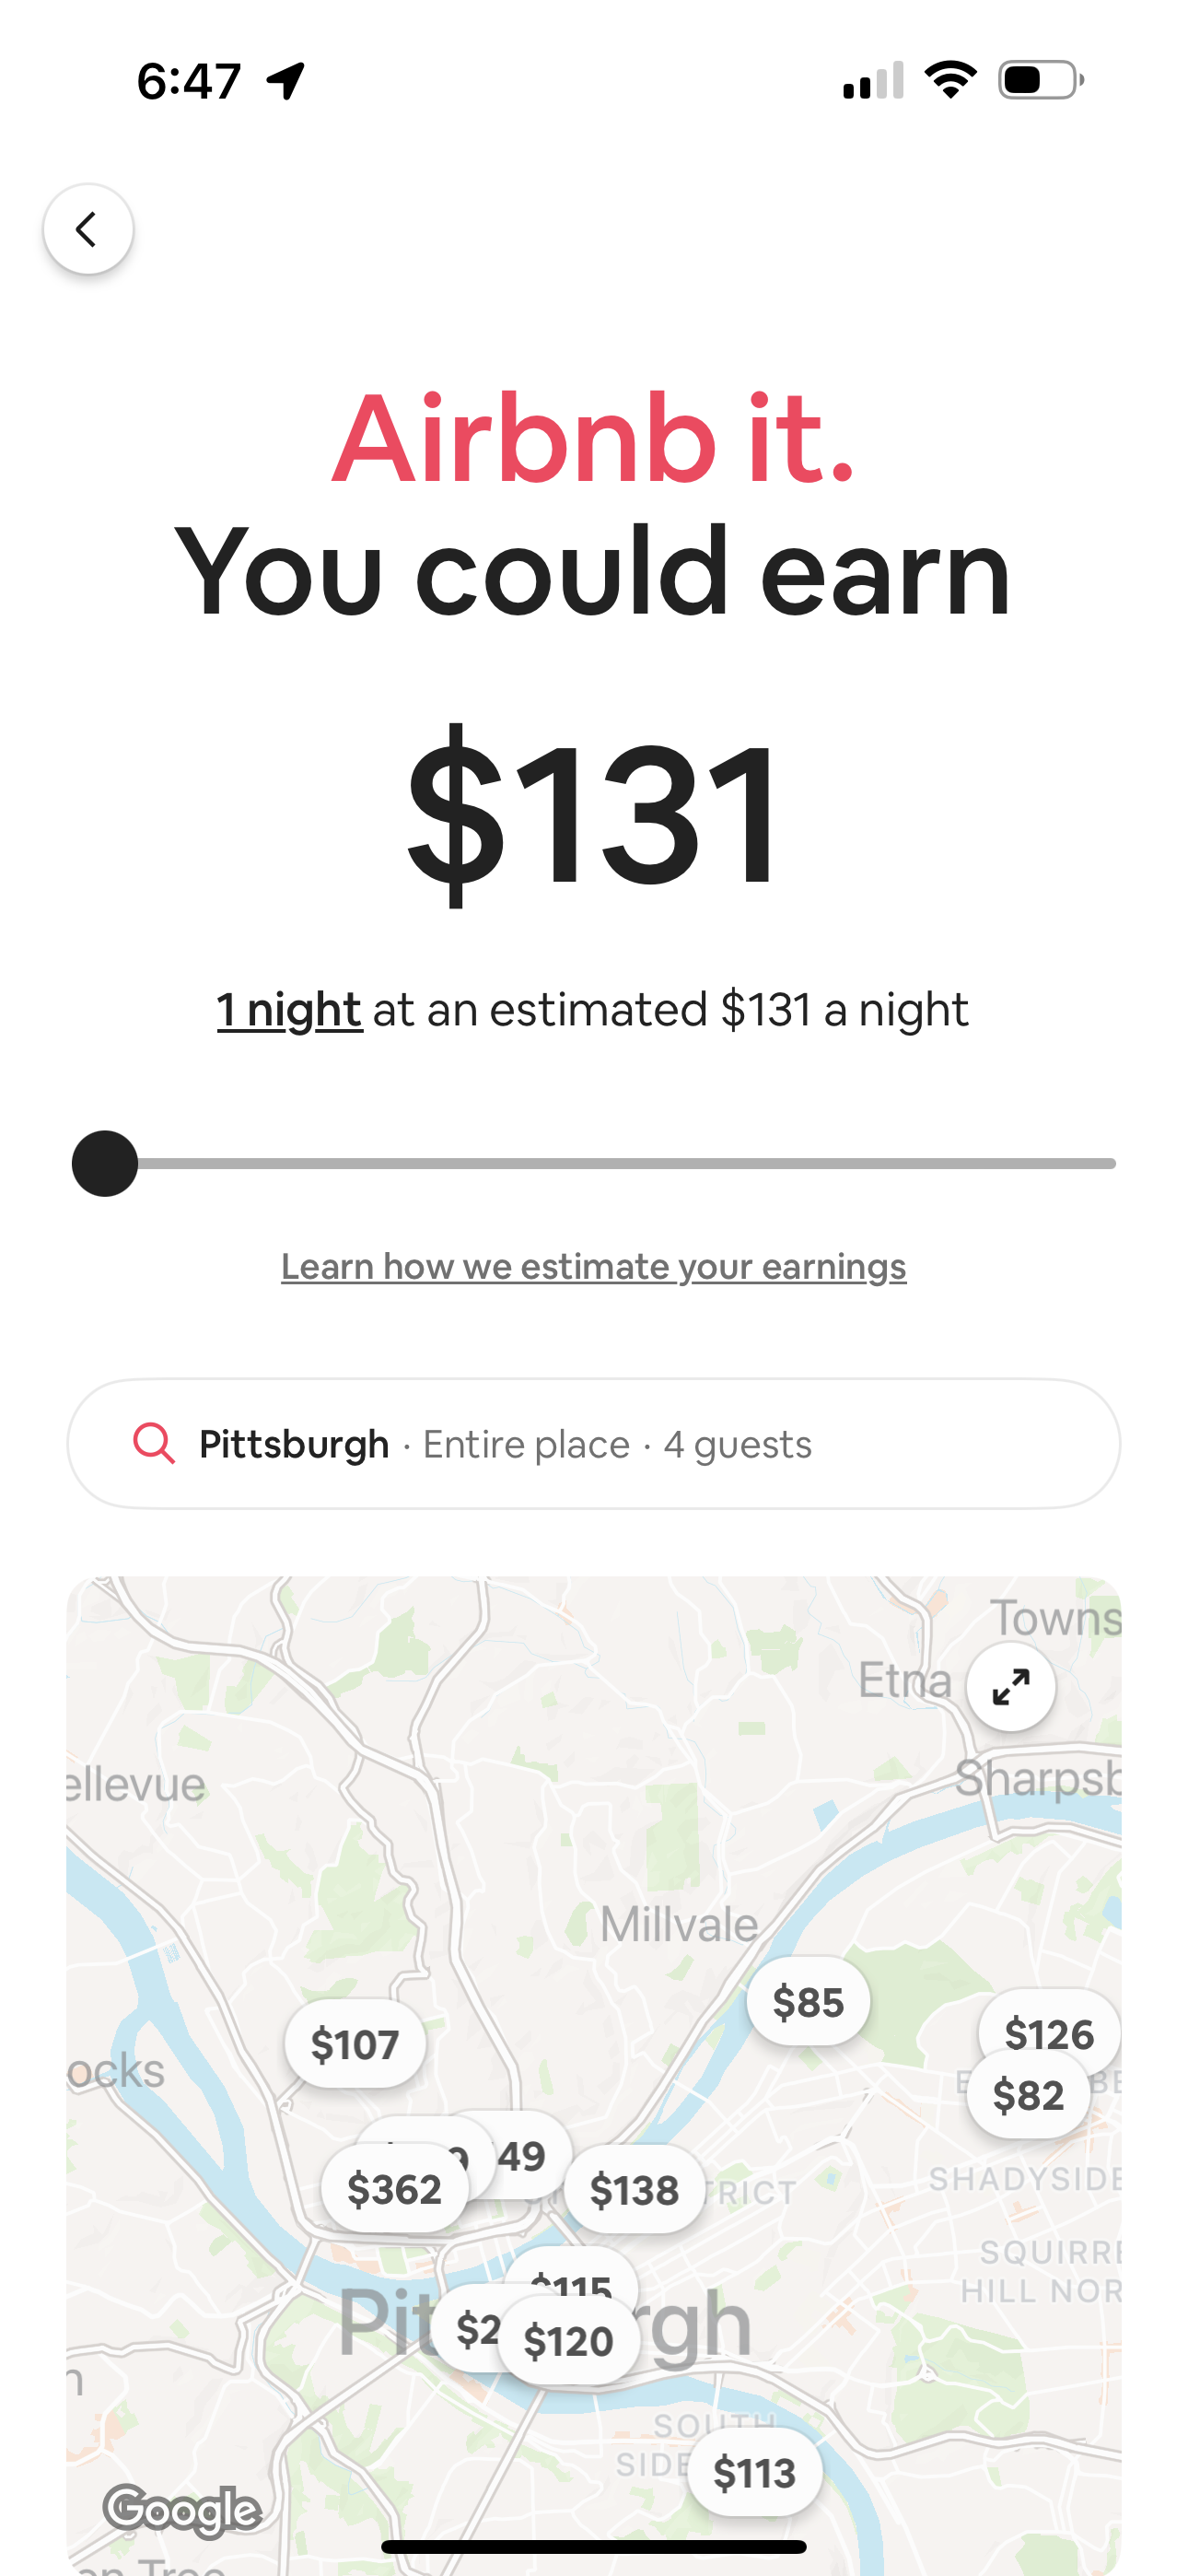
Airbnb1290 × 2796opens the full image 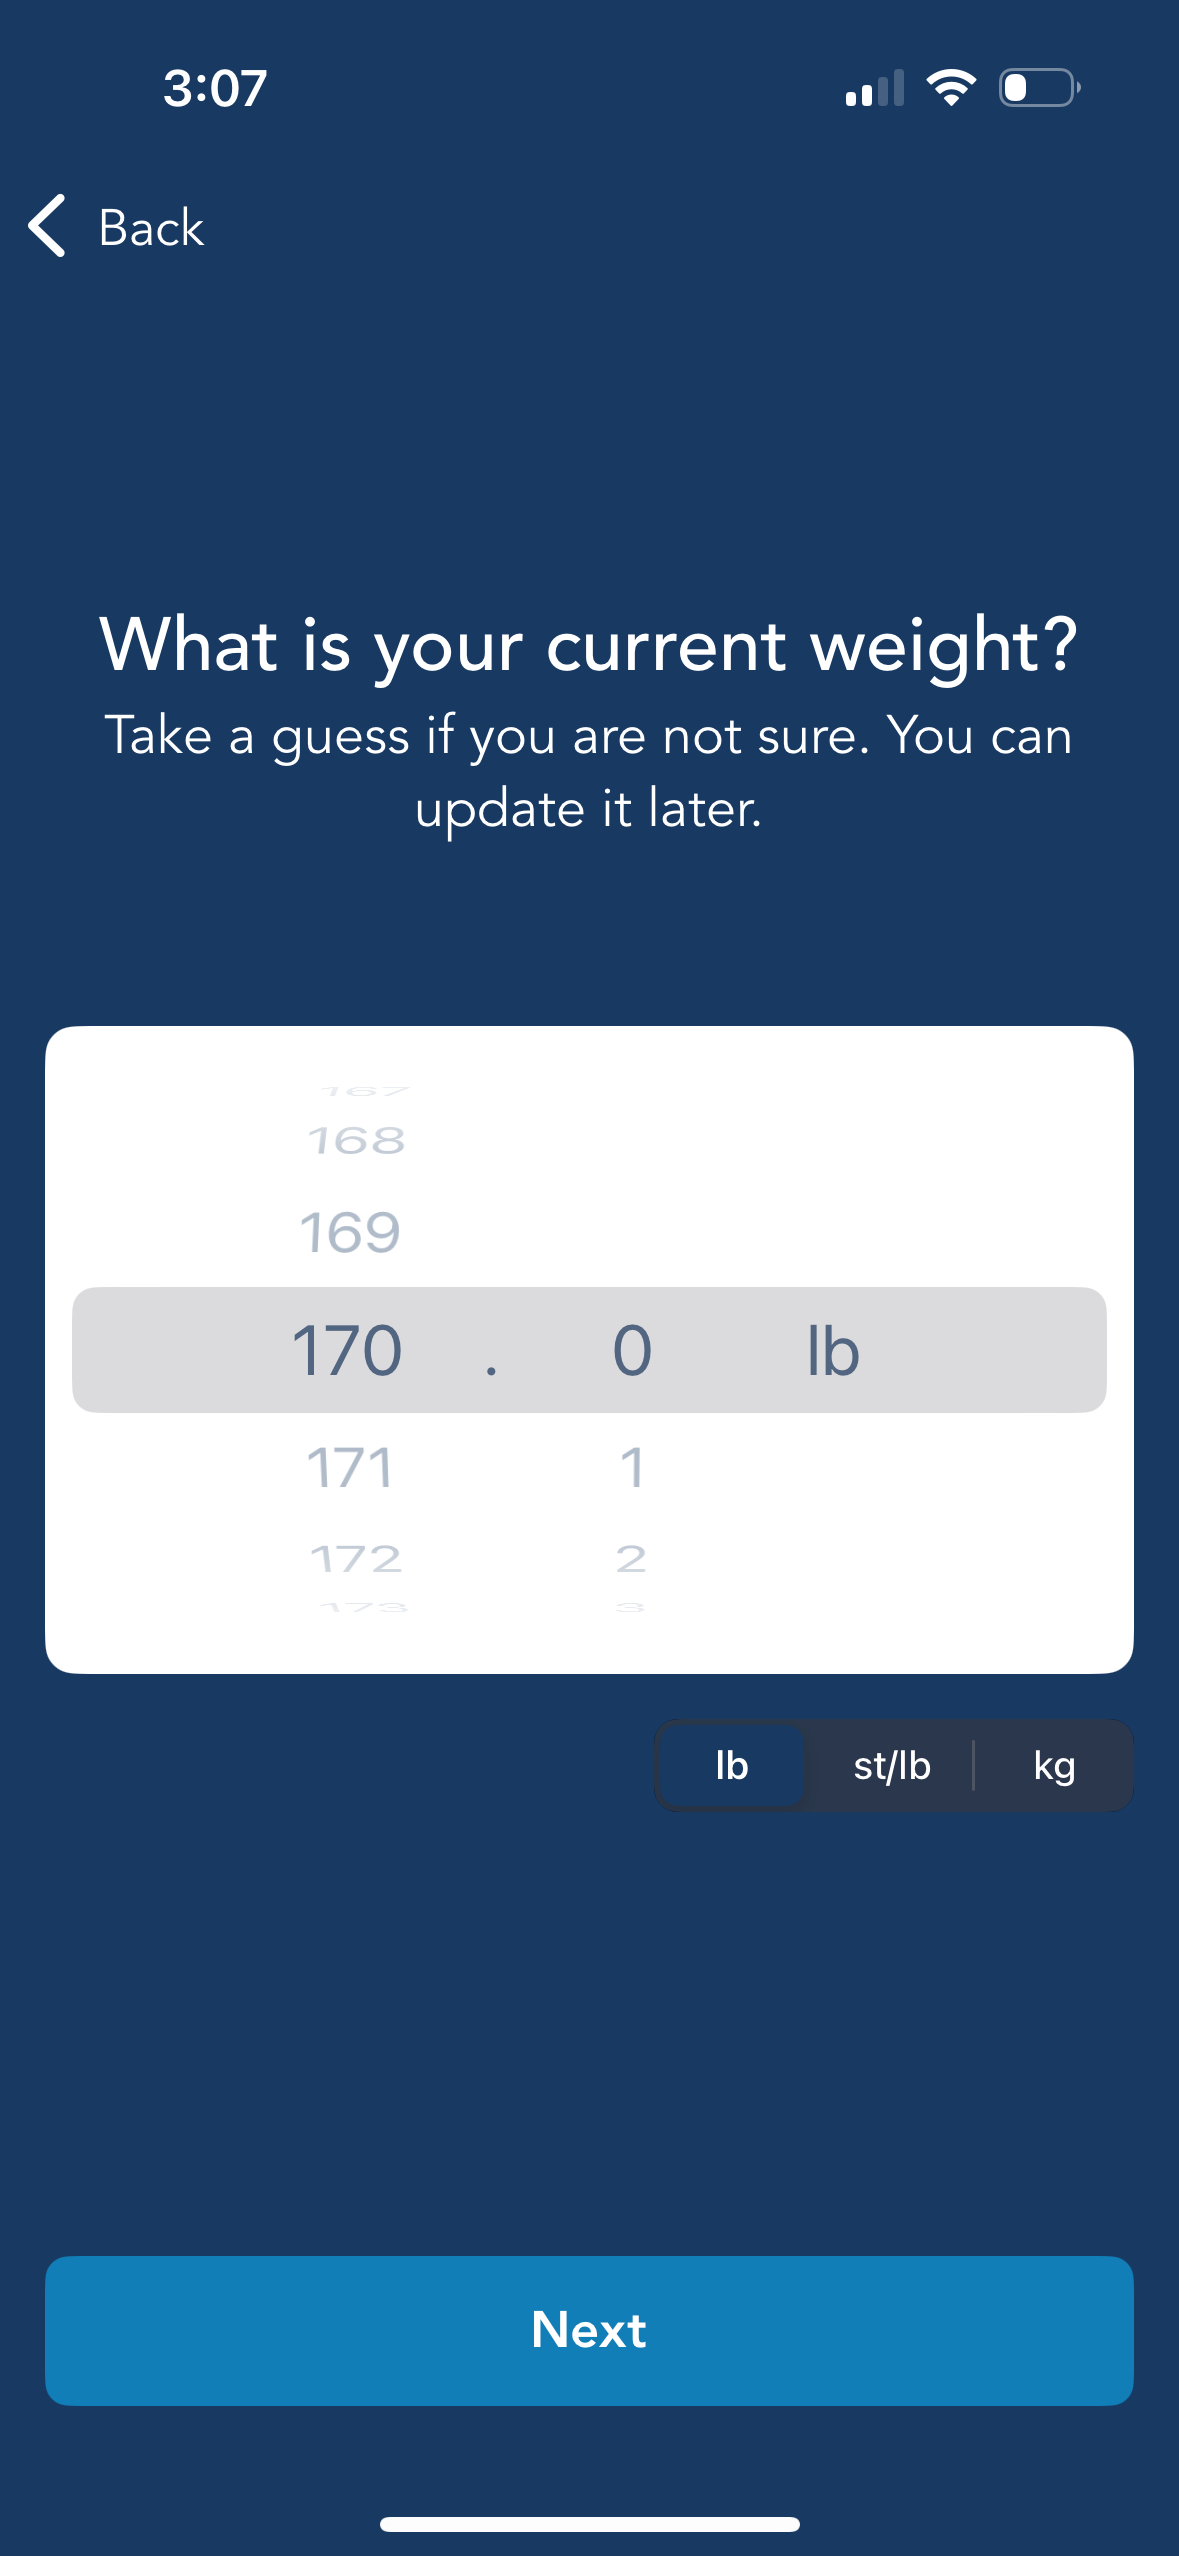
Lose It1179 × 2556opens the full image 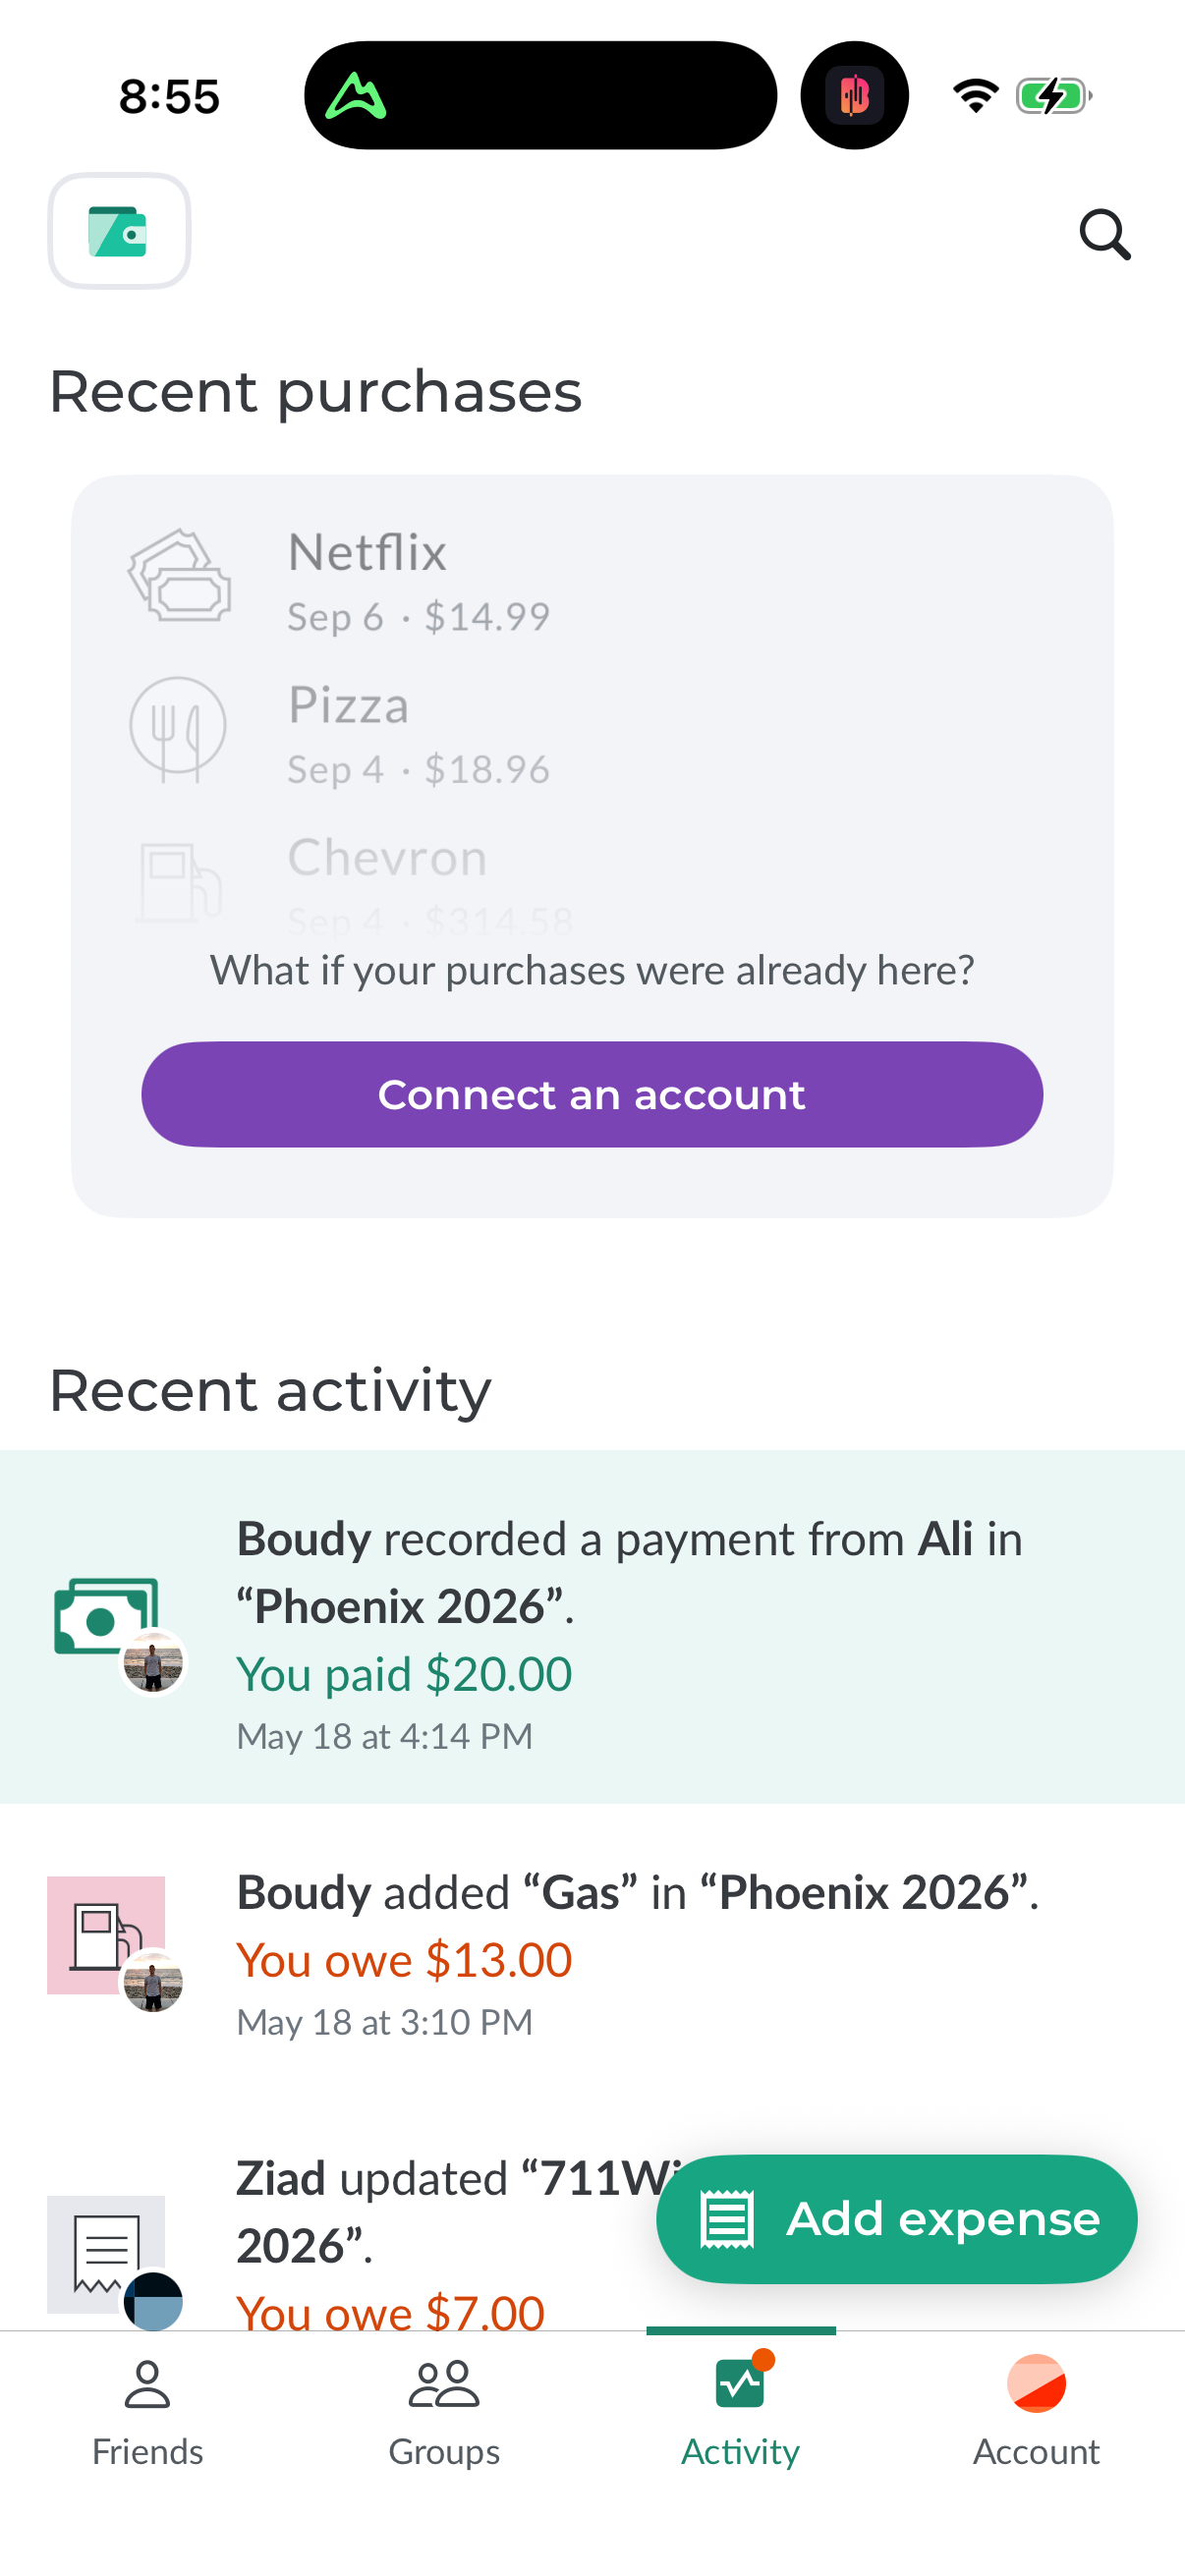
Splitwise1206 × 2622opens the full image
The numbers
| # | Stat | Computed from |
|---|---|---|
| [1] | 2.4% (2023, 7/293) -> 6.0% (2024, 24/399) -> 8.8% (2025, 64/730) | ai_assistant_prevalence_over_time |
| [2] | First captures: Libby 2023-02-23, ChatGPT 2024-01-20, Perplexity 2024-04-22, Notion 2024-04-19 | ai_assistant_early_adopters |
| [3] | 2026 partial year (through Jul 4) reads 2.0% (13 apps) - a capture/tagging artifact, not comparable | ai_assistant_prevalence_over_time / smallSampleWarnings |
| [4] | Capture cadence uneven (e.g. 2025-Q2 11,943 screenshots/533 co vs 2025-Q3 1,370/265); trends normalized to companies/year | capture_cadence_note |
Methodology
Universe: 47,578 capture-dated screenshots across 809 tracked mobile apps (293-730 companies captured per year, Oct 2022-Jul 2026). Method: for each capture year, share of distinct companies whose screens carry an AI-assistant/chat/chatbot/conversational-AI tag. Reliable window is 2023-2025; 2022 (n=1) and partial-2026 are excluded. Caveat: tag-matched prevalence is a lower bound.
Sources
- [1]
Lazyweb Research analysis of 809 tracked apps (mobile-app corpus, 47,578 capture-dated screenshots), July 2026
Prevalence = share of companies captured each year whose screens show an AI-assistant/chat/chatbot/conversational-AI tag, deduped by company_name.
- [2]
Lazyweb Research analysis of 809 tracked apps (mobile-app corpus, 47,578 capture-dated screenshots), July 2026
First-capture (MIN created_at) date per company for AI-assistant-tagged screens.
Source: Lazyweb Research — proprietary analysis of real, in-market app screens. Cite as Lazyweb Research, 2026-07-07.
Explore the evidence
- Full 45-frame August 2026 capture
- Three captured screens · August 2026