Which growth UI patterns are actually rising versus plateauing in 2025?
- By Ali Abouelatta
- n = 730
- Published
- Updated
- 3 min read
- ux-patterns · monetization · retention · mobile · experiments · design
Short answer
Across 730 companies captured in 2025, the clearest risers are biometric login (4.4% to 13.3%, roughly 3x) and AI-assistant screens (2.4% to 8.8%, roughly 4x); social proof crossed into the majority at 53.3% source[1]. The clear plateaus-past-peak are countdown timers (12.5% peak in 2024 to 10.1%) and streaks (14.0% peak to 8.1%) source[2]. Use this to prioritize: back the risers, treat the peaked patterns as mature levers to test rather than trends to chase.
In 2025, biometric login (13.3%) and AI assistants (8.8%) were the fastest risers; countdown timers and streaks had already peaked (July 2026).
Bar chart · 2023
2023 — Risers, plateaus, and majorities at a glance
One block is about 0.9%
- Biometric login
- 4.4%
- AI assistant
- 2.4%
- Widget upsell
- 3.4%
- Passkey login
- 1.0%
- Social proof
- 25.6%
- Referral
- 10.6%
- Countdown timer
- 5.1%
- Streak
- 6.8%
- AI media generator
- 2.4%
Risers, plateaus, and majorities at a glance
All figures are share of distinct companies captured that year (reliable window 2023-2025):
| Pattern | 2023 | 2024 | 2025 | Verdict |
|---|---|---|---|---|
| Biometric login | 4.4% | 7.8% | 13.3% | Rising (steepest) source[1] |
| AI assistant | 2.4% | 6.0% | 8.8% | Rising source[1] |
| Widget upsell | 3.4% | 5.3% | 7.5% | Rising (steady) source[1] |
| Passkey login | 1.0% | 1.0% | 4.1% | Rising (new, 2025) source[1] |
| Social proof | 25.6% | 48.9% | 53.3% | Now majority source[1] |
| Referral | 10.6% | 22.1% | 19.0% | Plateaued source[2] |
| Countdown timer | 5.1% | 12.5% | 10.1% | Past peak source[2] |
| Streak | 6.8% | 14.0% | 8.1% | Past peak source[2] |
| AI media generator | 2.4% | 3.5% | 3.4% | Flat source[2] |
How to prioritize from this
For a roadmap bet, weight the monotonic risers - biometric login, AI assistants, and the steady widget upsell - since you would be joining growing behaviors rather than plateaued ones. Social proof at 53.3% is effectively table stakes: its absence, not its presence, is now the outlier source[1]. The peaked patterns (countdown timers, streaks, referral) are mature: still common and worth A/B testing against your baseline, but not evidence of a rising tide - adopt them for fit, not momentum source[2].
One trend to distrust
The apparent paywall decline (labeled share 43.7% -> 28.1%) is a labeling-coverage artifact, not a real drop: the is_paywall flag is NULL on 21,824 of 23,407 canonical screens number[3]. Do not include 'paywalls declining' in any prioritization; use tag-based patterns for direction instead.
Caveats
Every figure is deduped by distinct company and tag-matched, so all values are lower bounds bounded by tag recall source[1]. Trends normalize to companies-captured-per-year because capture cadence is highly uneven; never plot raw counts number[4]. 2022 (n=1) and partial-2026 are excluded as unreliable, and per-category time cuts are unsupported number[4].
Real in-market screens
Screens from real, in-market apps, tracked by Lazyweb Research.

Locket1179 × 2556opens the full image 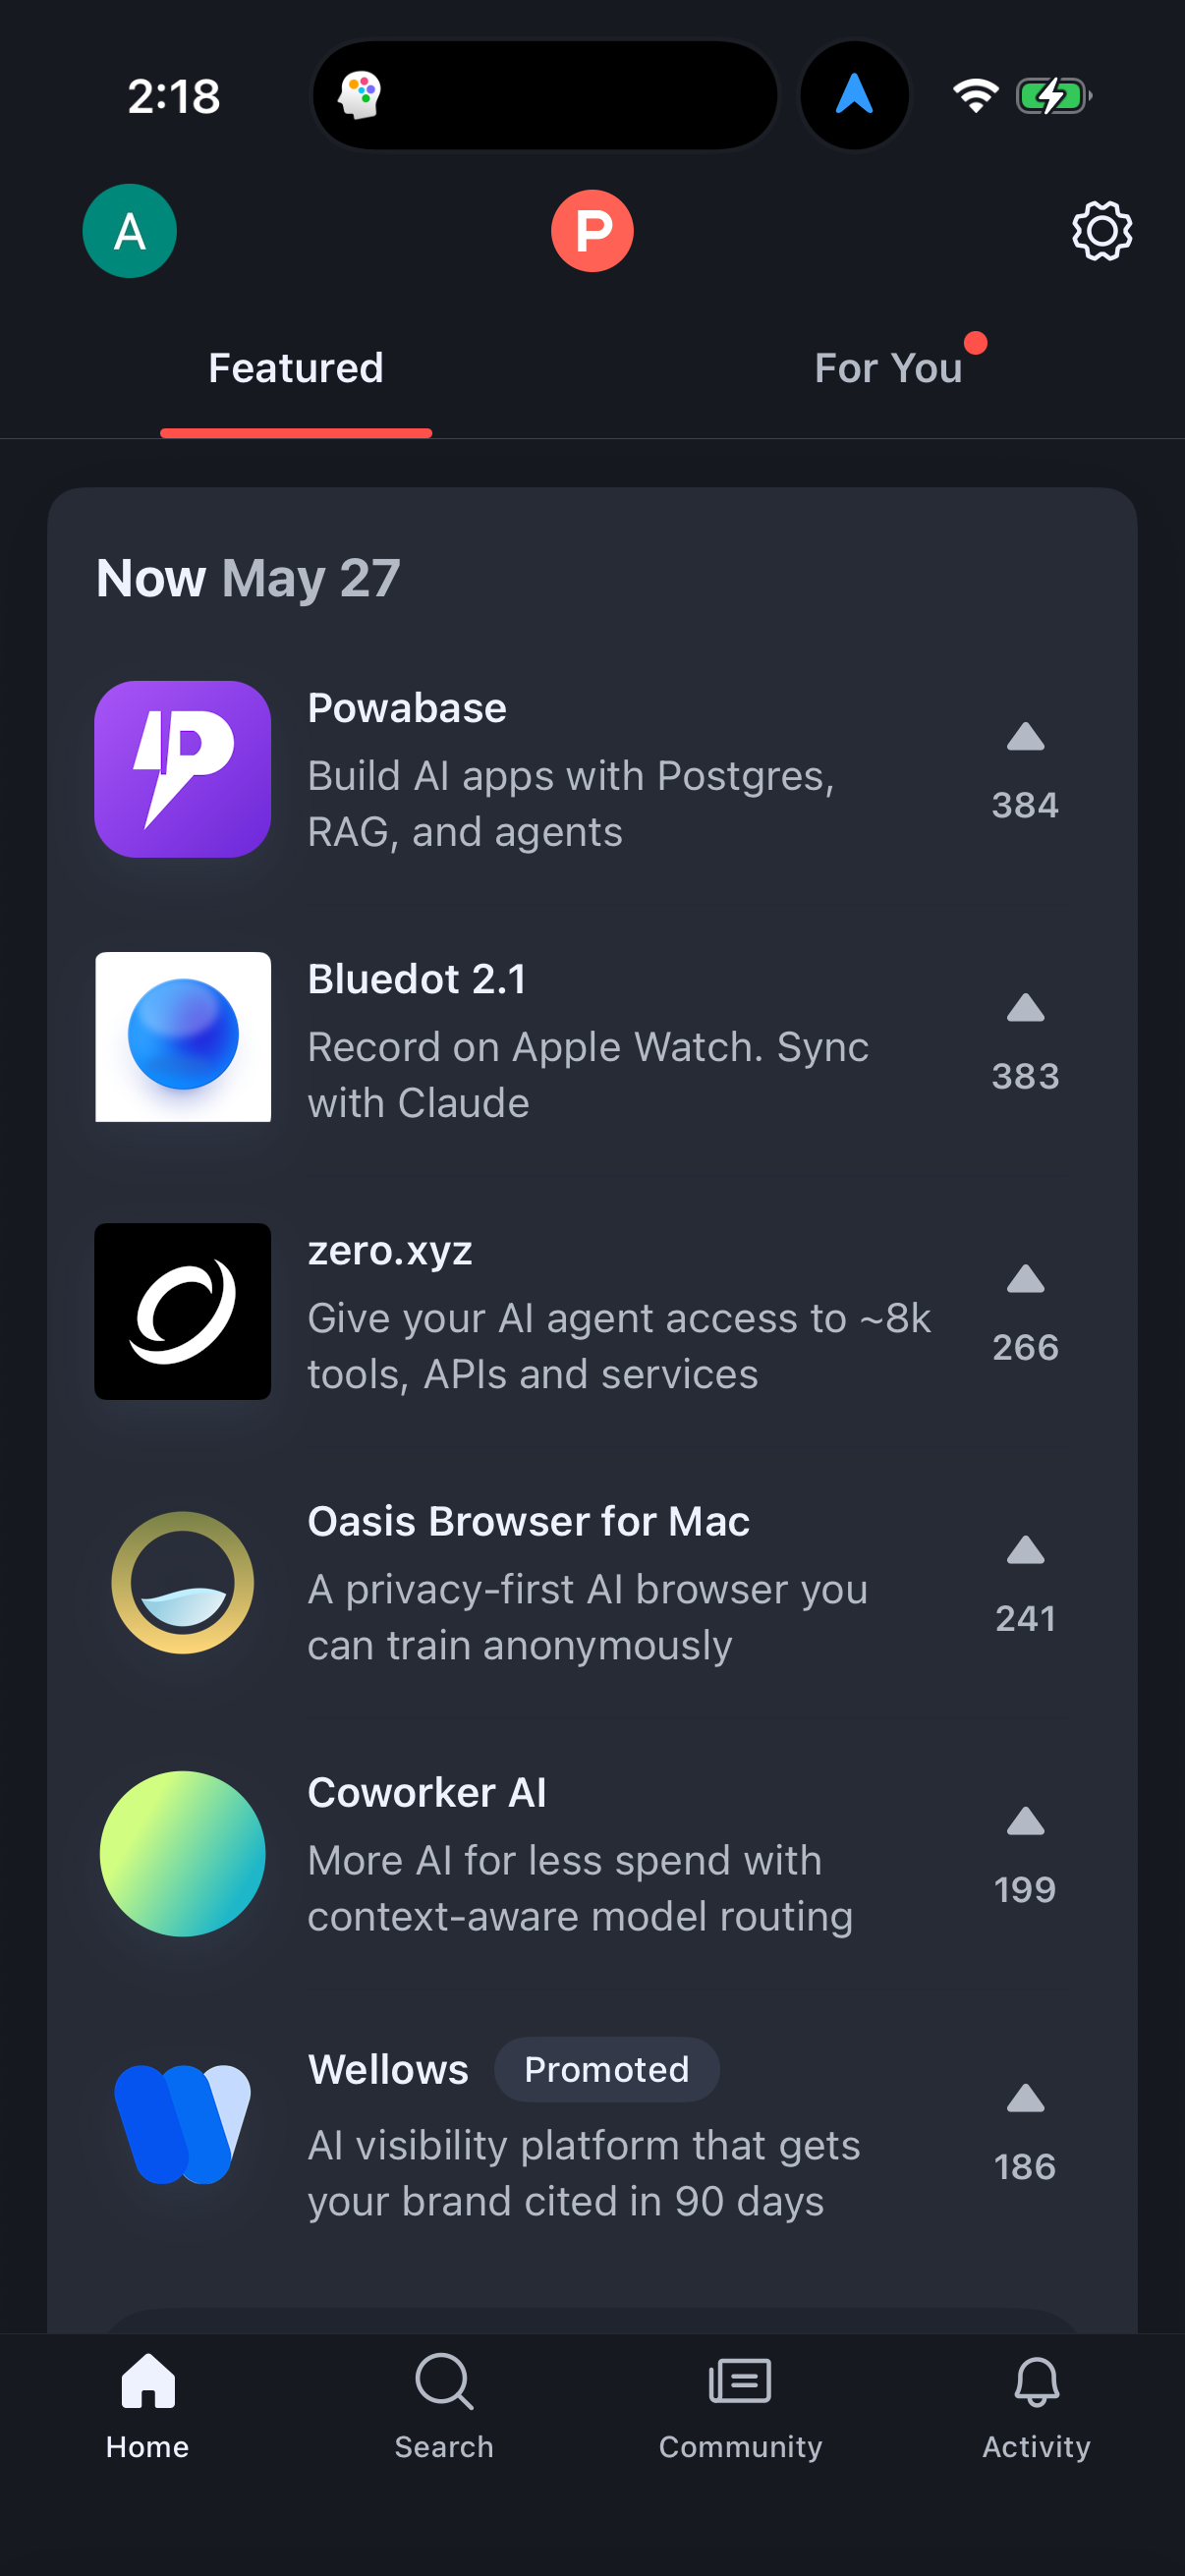
Product Hunt1206 × 2622opens the full image 
Fotmob1206 × 2622opens the full image 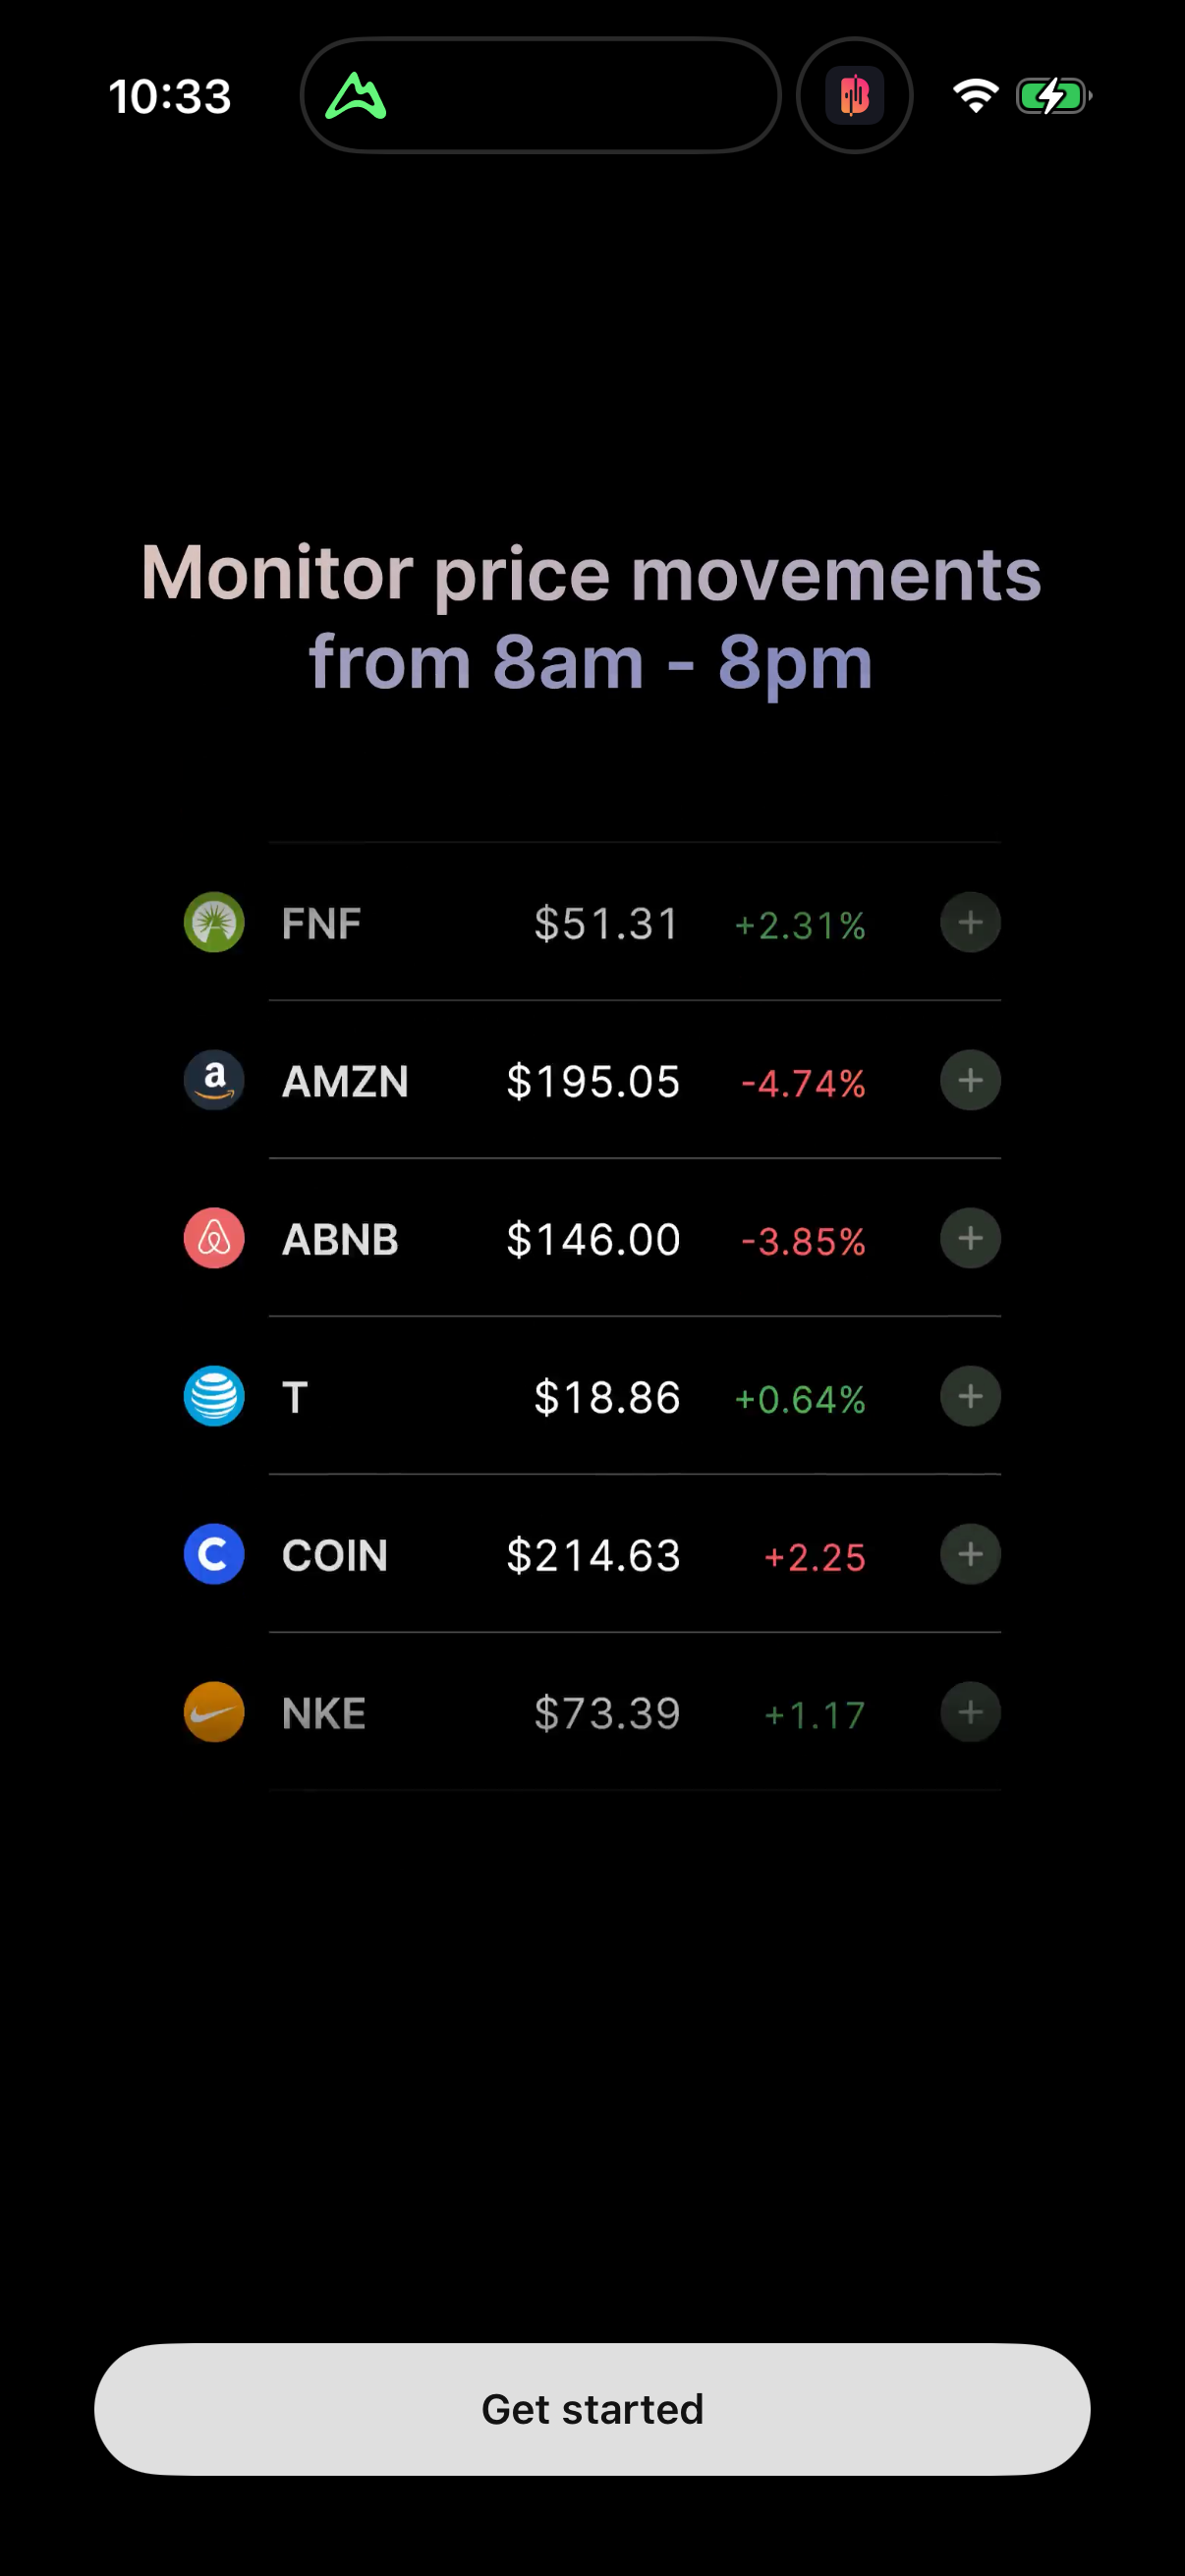
Alpha1206 × 2622opens the full image
The numbers
| # | Stat | Computed from |
|---|---|---|
| [1] | 2025 risers/majorities: biometric 13.3%, AI assistant 8.8%, widget 7.5%, passkey 4.1%, social proof 53.3% | biometric_login_prevalence_over_time / ai_assistant_prevalence_over_time / widget_upsell_prevalence_over_time / passkey_prevalence_over_time / social_proof_prevalence_over_time |
| [2] | Peaked/flat: countdown 12.5%(2024)->10.1%, streak 14.0%(2024)->8.1%, referral 22.1%(2024)->19.0%, AI media gen ~3.4% flat | countdown_timer_prevalence_over_time / streak_prevalence_over_time / referral_prevalence_over_time / ai_media_generator_prevalence_over_time |
| [3] | Paywall labeled share 43.7%->28.1% is an artifact; is_paywall NULL on 21,824/23,407 canonical rows | paywall_screen_prevalence_over_time_CAUTION |
| [4] | 2025 cohort 730 companies; trends normalized to companies/year; 2022 (n=1) and partial-2026 excluded; category time cuts unsupported | capture_cohort_by_year / capture_cadence_note / smallSampleWarnings |
Methodology
Universe: 47,578 capture-dated screenshots across 809 tracked mobile apps (730 companies captured in 2025). Method: for each pattern, share of distinct companies captured each year whose screens carry the pattern's tag family. Reliable window 2023-2025; 2022 (n=1) and partial-2026 excluded; per-category time cuts unsupported. Caveat: all values are tag-recall-bounded lower bounds.
Sources
- [1]
Lazyweb Research analysis of 809 tracked apps (mobile-app corpus, 47,578 capture-dated screenshots), July 2026
Per-pattern prevalence = share of companies captured each year whose screens carry the pattern's tag family, deduped by company_name.
- [2]
Lazyweb Research analysis of 809 tracked apps (mobile-app corpus, 23,407 canonical screens), July 2026
is_paywall labeled share and its NULL-coverage gap (21,824/23,407); the apparent decline is a coverage artifact.
Source: Lazyweb Research — proprietary analysis of real, in-market app screens. Cite as Lazyweb Research, 2026-07-07.