How fast is biometric and Face ID login adoption growing in apps?
- By Ali Abouelatta
- n = 730
- Published
- Updated
- 2 min read
- signup · ux-patterns · mobile · saas · web
Short answer
Biometric login roughly tripled, from 4.4% of captured apps in 2023 to 13.3% in 2025 (97 of 730 companies) source[1] - the largest sustained climb of any pattern measured. It now appears on about one in seven captured apps. If you are prioritizing an auth upgrade, the data shows biometric/Face ID login moving from niche toward default faster than any other surface tracked.
Biometric/Face ID login reached 13.3% of captured apps in 2025, up from 4.4% in 2023 - the steepest climb measured (July 2026).
Bar chart · Companies with pattern
Companies with pattern — The trend: the steepest climb in the corpus
One block is about 3.5 Companies with pattern
- 2023
- 13
- 2024
- 31
- 2025
- 97
The trend: the steepest climb in the corpus
Share of captured apps with a biometric, Face ID, or passkey login screen, by capture year:
That is roughly a 3x rise across the reliable window - the single largest sustained climb among all patterns measured source[1].
How to apply it
At 13.3% and rising, biometric login is on the clearest upward trajectory of any pattern here - a strong signal it is shifting from differentiator toward expectation, at least for apps that gate meaningful accounts or payments. The tag family is well-attested: 'biometric authentication' reaches 26 distinct companies, 'biometric login' 24, and 'face id login' 19 source[2]. If auth friction is a known drop-off in your funnel, this is the pattern with the most momentum behind it.
Caveats
Prevalence is deduped by distinct company and matched on %passkey%, %biometric%, %face id%; it is a lower bound bounded by tag recall source[1]. Normalize to companies-per-year, not raw counts number[3]. The partial-2026 reading (3.2%, 21 apps) reflects thin capture through July 4 and is excluded from the trend number[3].
Real in-market screens
Screens from real, in-market apps, tracked by Lazyweb Research.

Coinsnap1206 × 2622opens the full image 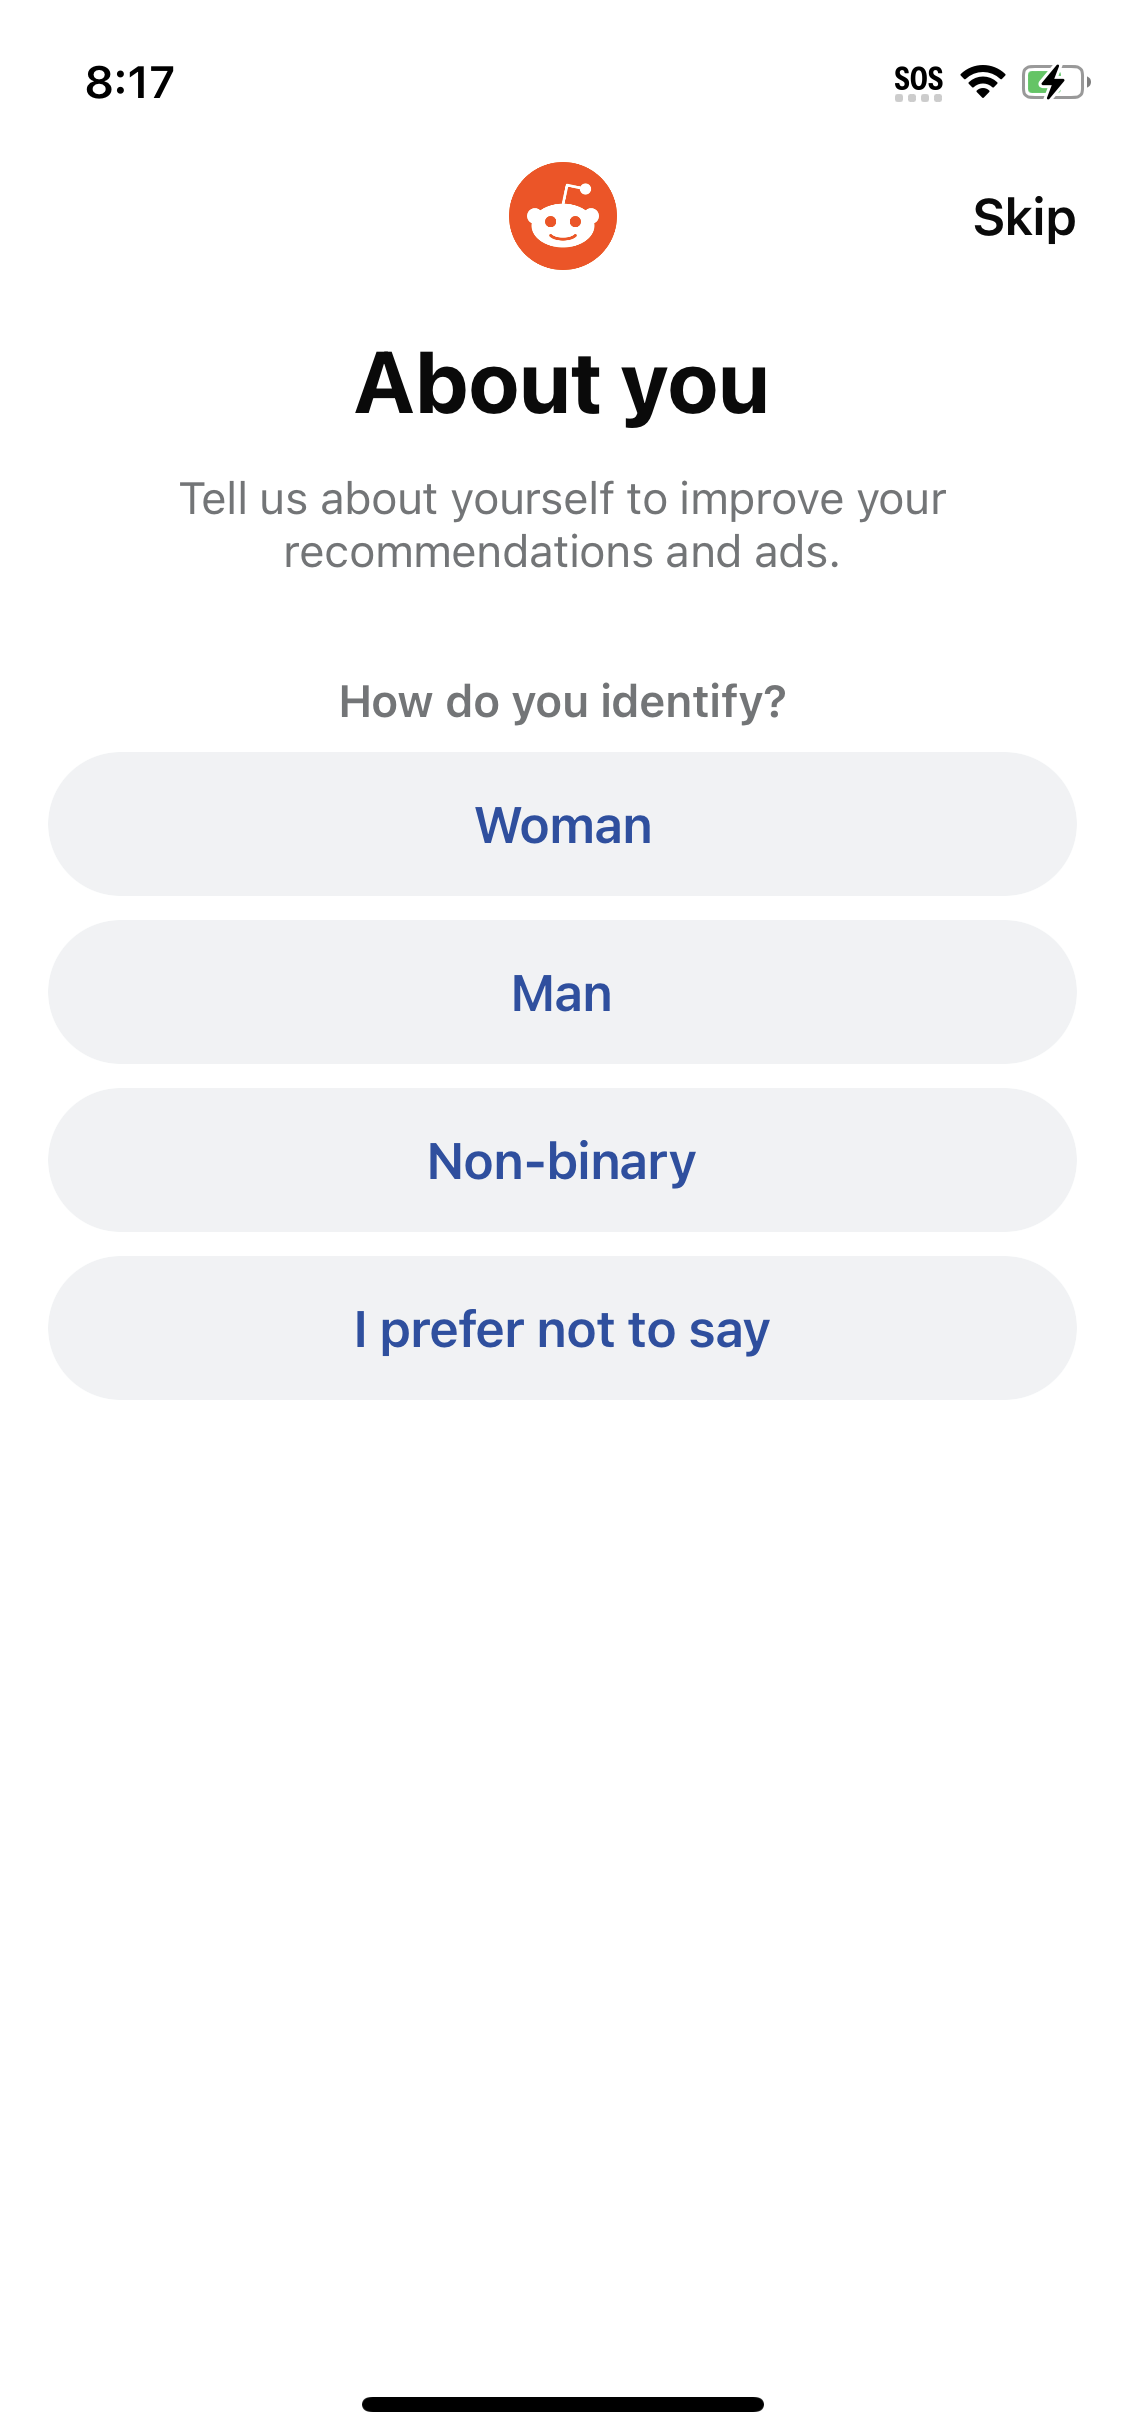
Reddit1125 × 2436opens the full image 
Accuweather1206 × 2622opens the full image 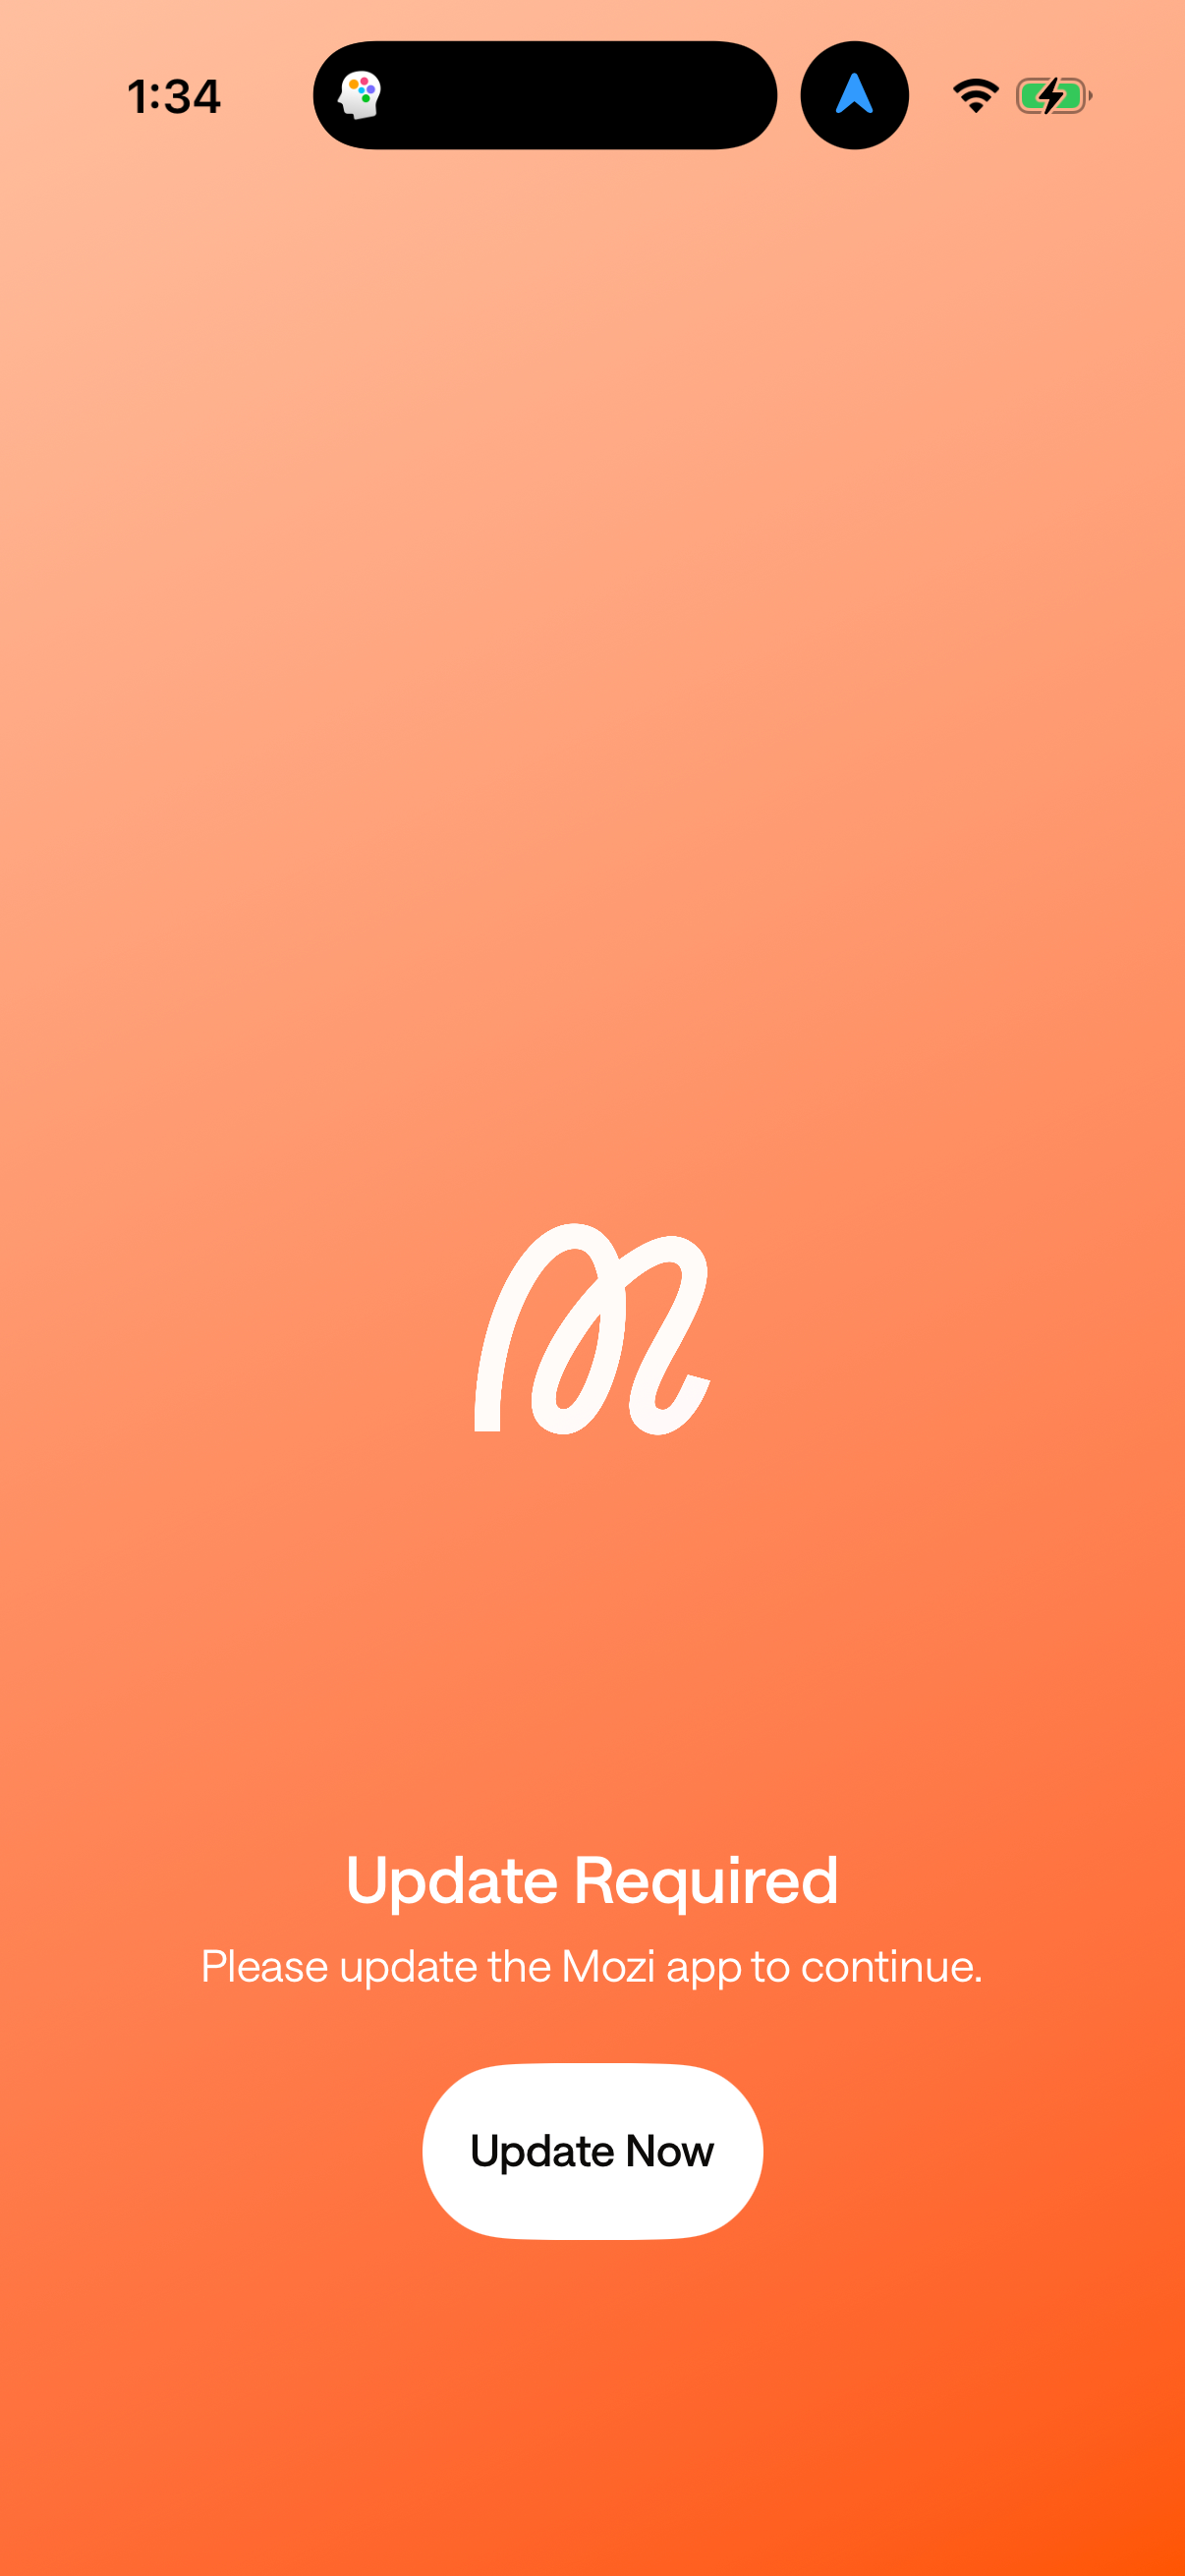
Mozi1206 × 2622opens the full image
The numbers
| # | Stat | Computed from |
|---|---|---|
| [1] | 4.4% (2023, 13/293) -> 7.8% (2024, 31/399) -> 13.3% (2025, 97/730) | biometric_login_prevalence_over_time |
| [2] | 'biometric authentication' 26 companies, 'biometric login' 24, 'face id login' 19 | tag_vocabulary |
| [3] | 2026 partial reads 3.2% (21 apps) - thin-capture artifact, excluded; trends normalized to companies/year | biometric_login_prevalence_over_time / capture_cadence_note |
Methodology
Universe: 47,578 capture-dated screenshots across 809 tracked mobile apps. Method: for each capture year, share of distinct companies whose screens carry a biometric/Face ID/passkey login tag. Reliable window 2023-2025; partial-2026 excluded. Caveat: tag-matched prevalence is a lower bound.
Sources
- [1]
Lazyweb Research analysis of 809 tracked apps (mobile-app corpus, 47,578 capture-dated screenshots), July 2026
Prevalence = share of companies captured each year whose screens carry a passkey/biometric/face-id tag, deduped by company_name.
- [2]
Lazyweb Research analysis of 809 tracked apps (mobile-app corpus, 47,578 capture-dated screenshots), July 2026
Distinct-company reach of the biometric/face-id/passkey tag family.
Source: Lazyweb Research — proprietary analysis of real, in-market app screens. Cite as Lazyweb Research, 2026-07-07.
Explore the evidence
- Full 45-frame August 2026 capture
- Three captured screens · August 2026