Are streak features still spreading beyond Duolingo?
- By Ali Abouelatta
- n = 730
- Published
- Updated
- 2 min read
- retention · onboarding · mobile · ux-patterns · experiments
Short answer
They spread, then plateaued. Streak screens rose from 6.8% of captured apps in 2023 to a 14.0% peak in 2024, then fell back to 8.1% in 2025 (59 of 730 companies) source[1]. Streaks broke out beyond Duolingo in 2024 but did not keep climbing as a share. If you are considering a streak mechanic, it is a proven-but-not-rising pattern - adopt it for fit, not because it is trending up.
Streak screens peaked at 14.0% of captured apps in 2024, then settled to 8.1% in 2025 (July 2026).
Bar chart · Companies with pattern
Companies with pattern — The trend: a 2024 breakout that receded
One block is about 2.1 Companies with pattern
- 2023
- 20
- 2024
- 56
- 2025
- 59
The trend: a 2024 breakout that receded
Share of captured apps showing a streak (gamification) screen, by capture year:
Streaks roughly doubled in share into 2024 as the mechanic spread beyond language-learning, then slipped back as a share in 2025 source[1].
How to apply it
The 2024 spike-and-retreat suggests streaks are best treated as a fit-dependent mechanic, not a universal growth lever. They work where a daily-habit loop is genuine (learning, fitness, journaling); the share pullback in 2025 hints that apps without that loop tried streaks and did not sustain them. Adopt streaks because your retention model rewards daily returns, not because the pattern is climbing - it is not.
Caveats
Prevalence is deduped by distinct company and matched on %streak%; it is a lower bound bounded by tag recall source[1]. Note the absolute company count barely moved 2024->2025 (56->59) while share fell, because the 2025 cohort was much larger (730 vs 399) - a reminder to read share, not counts source[2]. Partial-2026 (11 apps) is excluded as a thin-capture artifact source[2].
Real in-market screens
Screens from real, in-market apps, tracked by Lazyweb Research.
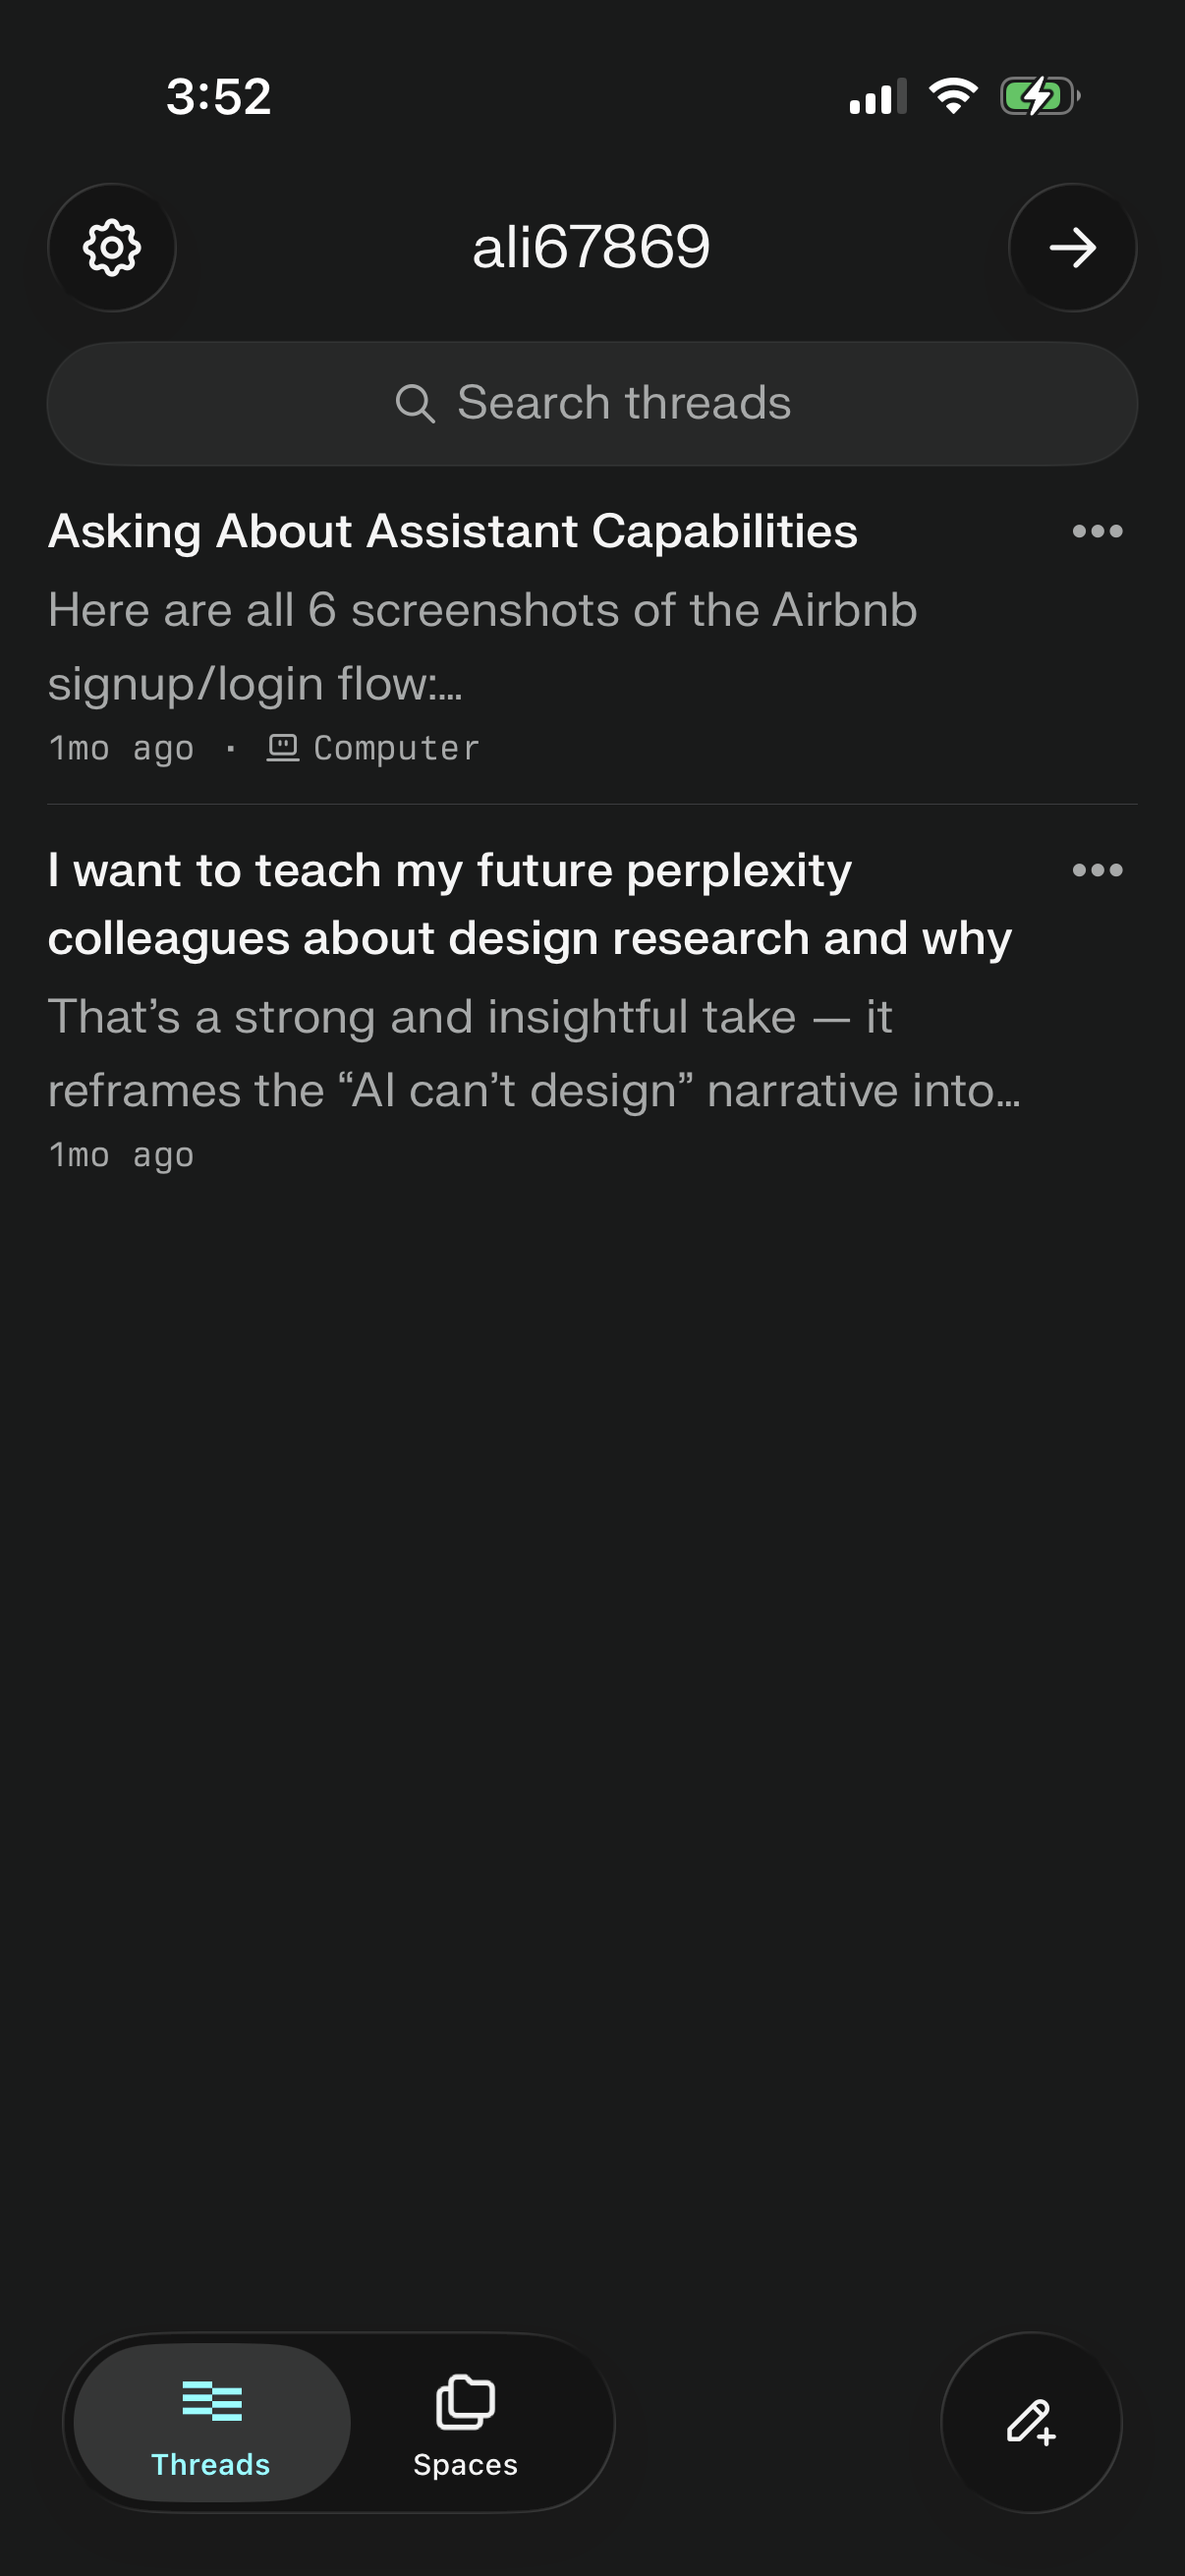
Perplexity1206 × 2622opens the full image 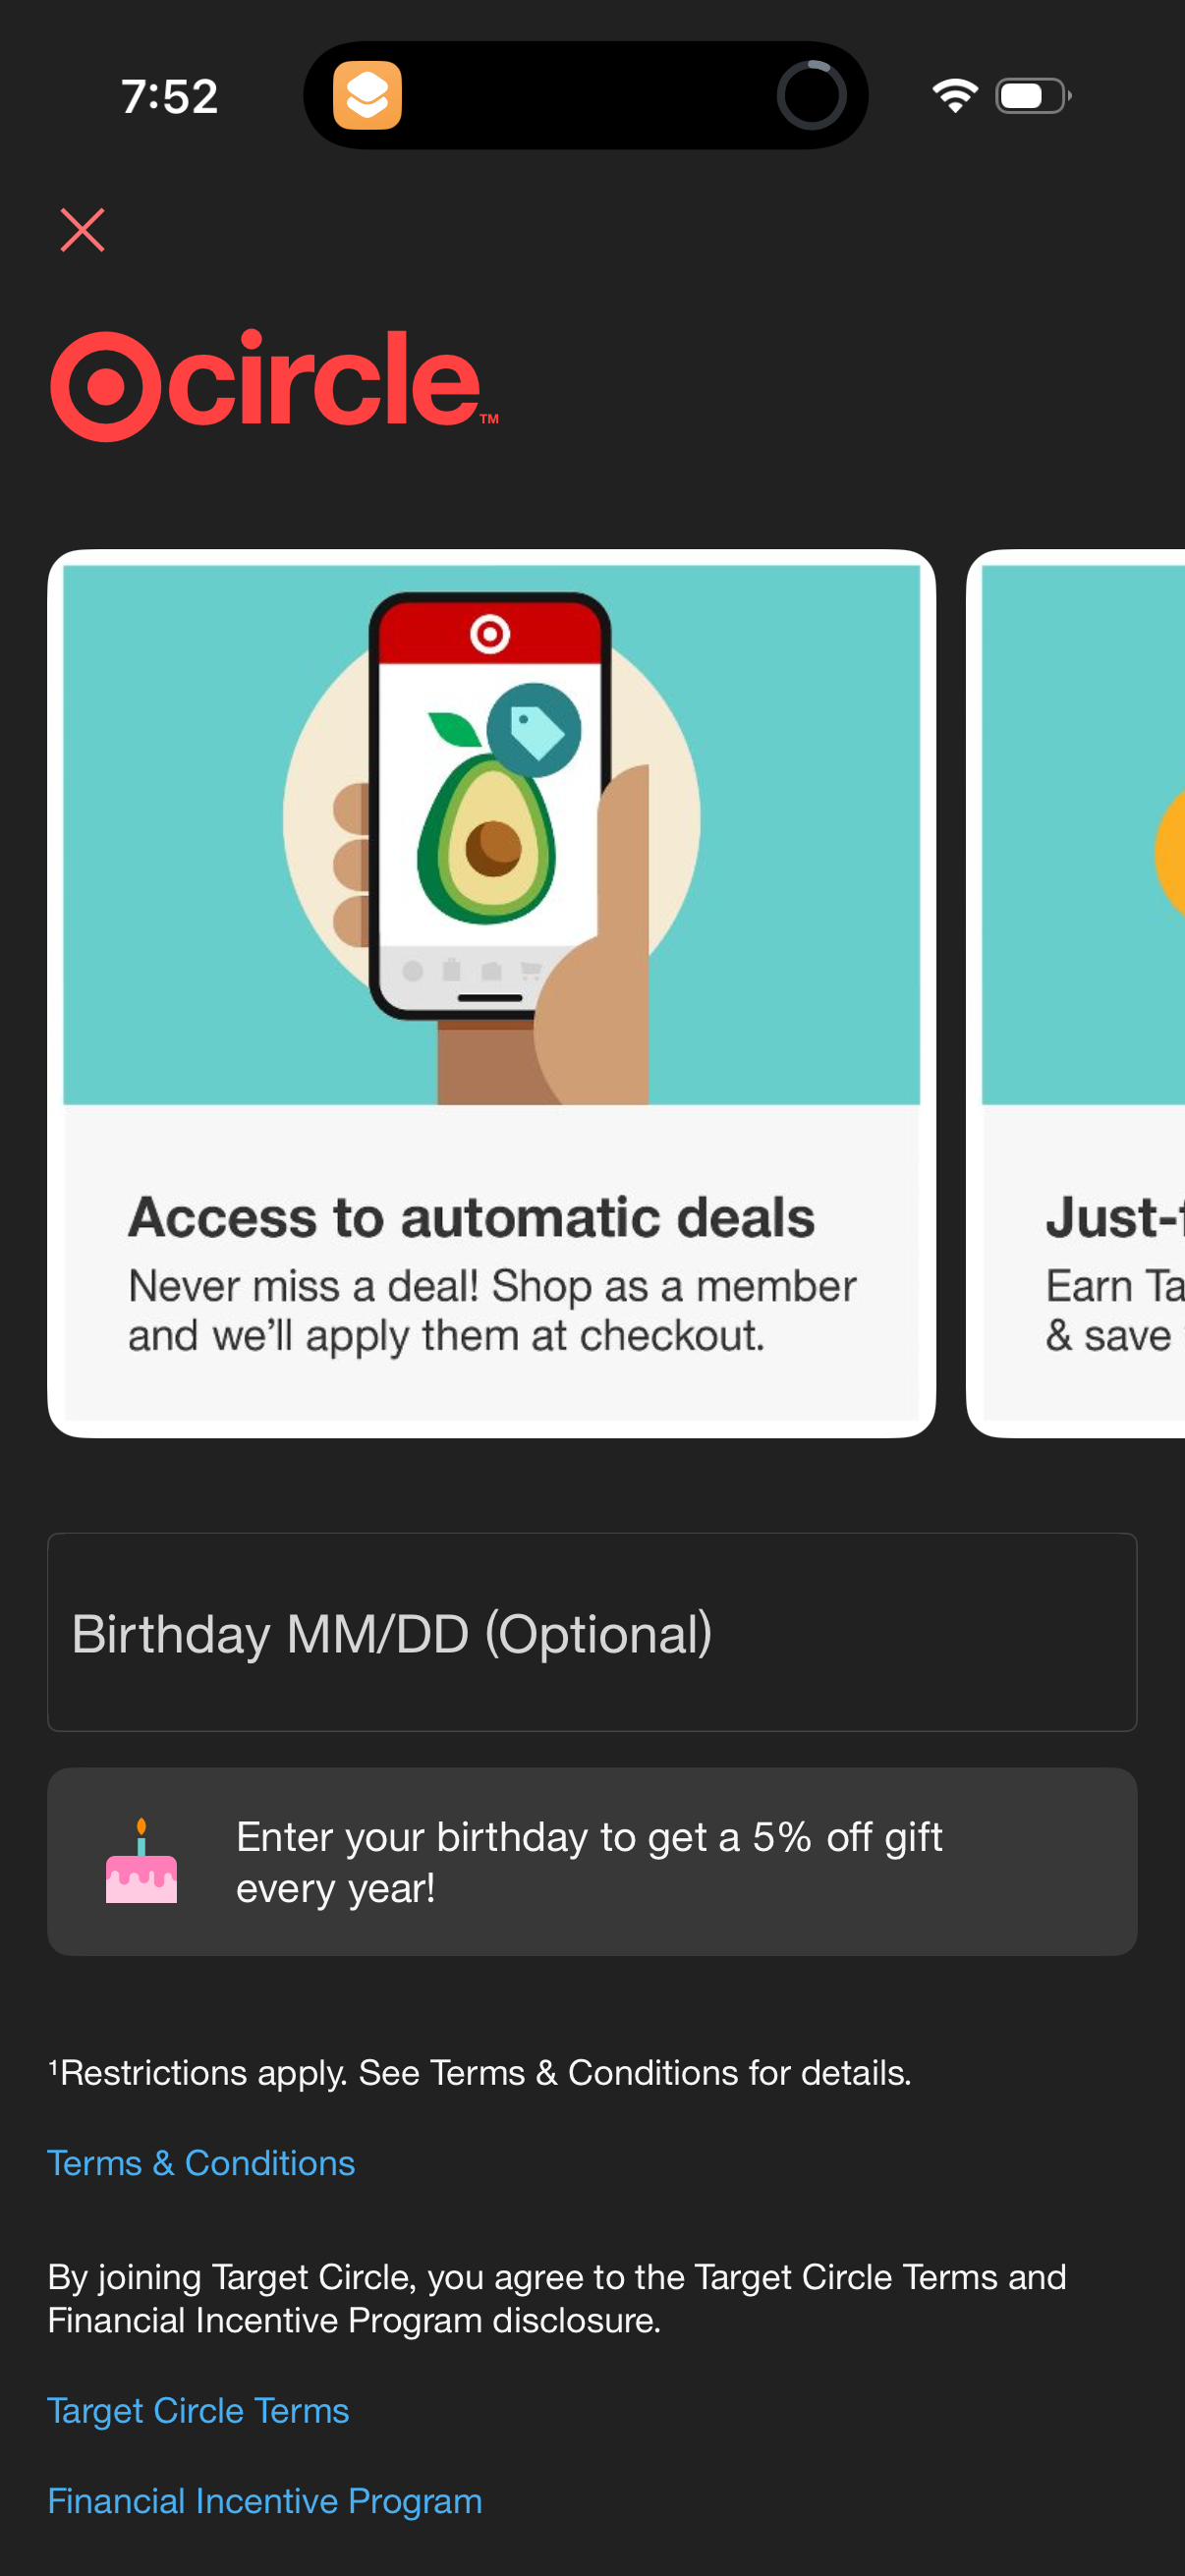
Target1206 × 2622opens the full image 
Alexa1206 × 2622opens the full image 
Soundcloud1206 × 2622opens the full image
The numbers
| # | Stat | Computed from |
|---|---|---|
| [1] | 6.8% (2023, 20/293) -> 14.0% (2024, 56/399) -> 8.1% (2025, 59/730) | streak_prevalence_over_time |
| [2] | 2025 cohort 730 co vs 2024 399 co; 2026 partial 11 apps excluded; read share not raw counts | streak_prevalence_over_time / capture_cohort_by_year |
Methodology
Universe: 47,578 capture-dated screenshots across 809 tracked mobile apps. Method: for each capture year, share of distinct companies whose screens carry a streak tag. Reliable window 2023-2025; partial-2026 excluded. Caveat: tag-matched prevalence is a lower bound.
Sources
- [1]
Lazyweb Research analysis of 809 tracked apps (mobile-app corpus, 47,578 capture-dated screenshots), July 2026
Prevalence = share of companies captured each year whose screens carry a `%streak%` tag, deduped by company_name.
- [2]
Lazyweb Research analysis of 809 tracked apps (mobile-app corpus, 47,578 capture-dated screenshots), July 2026
Capture cohort sizes by year; trend read as share, not raw counts.
Source: Lazyweb Research — proprietary analysis of real, in-market app screens. Cite as Lazyweb Research, 2026-07-07.
Explore the evidence
- Full 45-frame August 2026 capture
- Three captured screens · August 2026