How common is social proof on mobile apps, and is it still growing?
- By Ali Abouelatta
- n = 730
- Published
- Updated
- 2 min read
- landing-page · onboarding · monetization · mobile · ux-patterns
Short answer
It is now the majority pattern. Social-proof screens (testimonials, reviews, ratings) roughly doubled in prevalence, from 25.6% of captured apps in 2023 to 53.3% in 2025 (389 of 730 companies) source[1]. More than half of captured apps now show social proof. If you are deciding whether to add testimonials or ratings, the data says it has crossed from tactic to near-default.
Social-proof screens reached 53.3% of captured apps in 2025, up from 25.6% in 2023 (July 2026).
Bar chart · Companies with pattern
Companies with pattern — The trend: doubled to a majority
One block is about 13.9 Companies with pattern
- 2023
- 75
- 2024
- 195
- 2025
- 389
The trend: doubled to a majority
Share of captured apps showing a social-proof (testimonial/review/rating) screen, by capture year:
Social proof roughly doubled 2023-2025 and now sits on a majority of captured apps - the highest prevalence of any pattern in this family source[1].
How to apply it
At 53.3%, social proof is effectively table stakes: more than half of captured apps surface it, so its absence is now the outlier. The practical implication is that testimonials/ratings are less a differentiator than a hygiene factor - the question shifts from whether to show social proof to how credibly you show it. Because it is so widespread, expect diminishing novelty; test placement and specificity rather than mere presence.
Caveats
Prevalence is deduped by distinct company and matched on %social proof%, %testimonial%, %review%, %rating%; it is a lower bound bounded by tag recall, and the broad 'review'/'rating' terms may catch some in-app review UI beyond pure marketing social proof source[1]. The partial-2026 figure (45 apps) reflects thin capture through July 4 and is not comparable source[2]. Normalize to companies-per-year, not raw counts source[2].
Real in-market screens
Screens from real, in-market apps, tracked by Lazyweb Research.
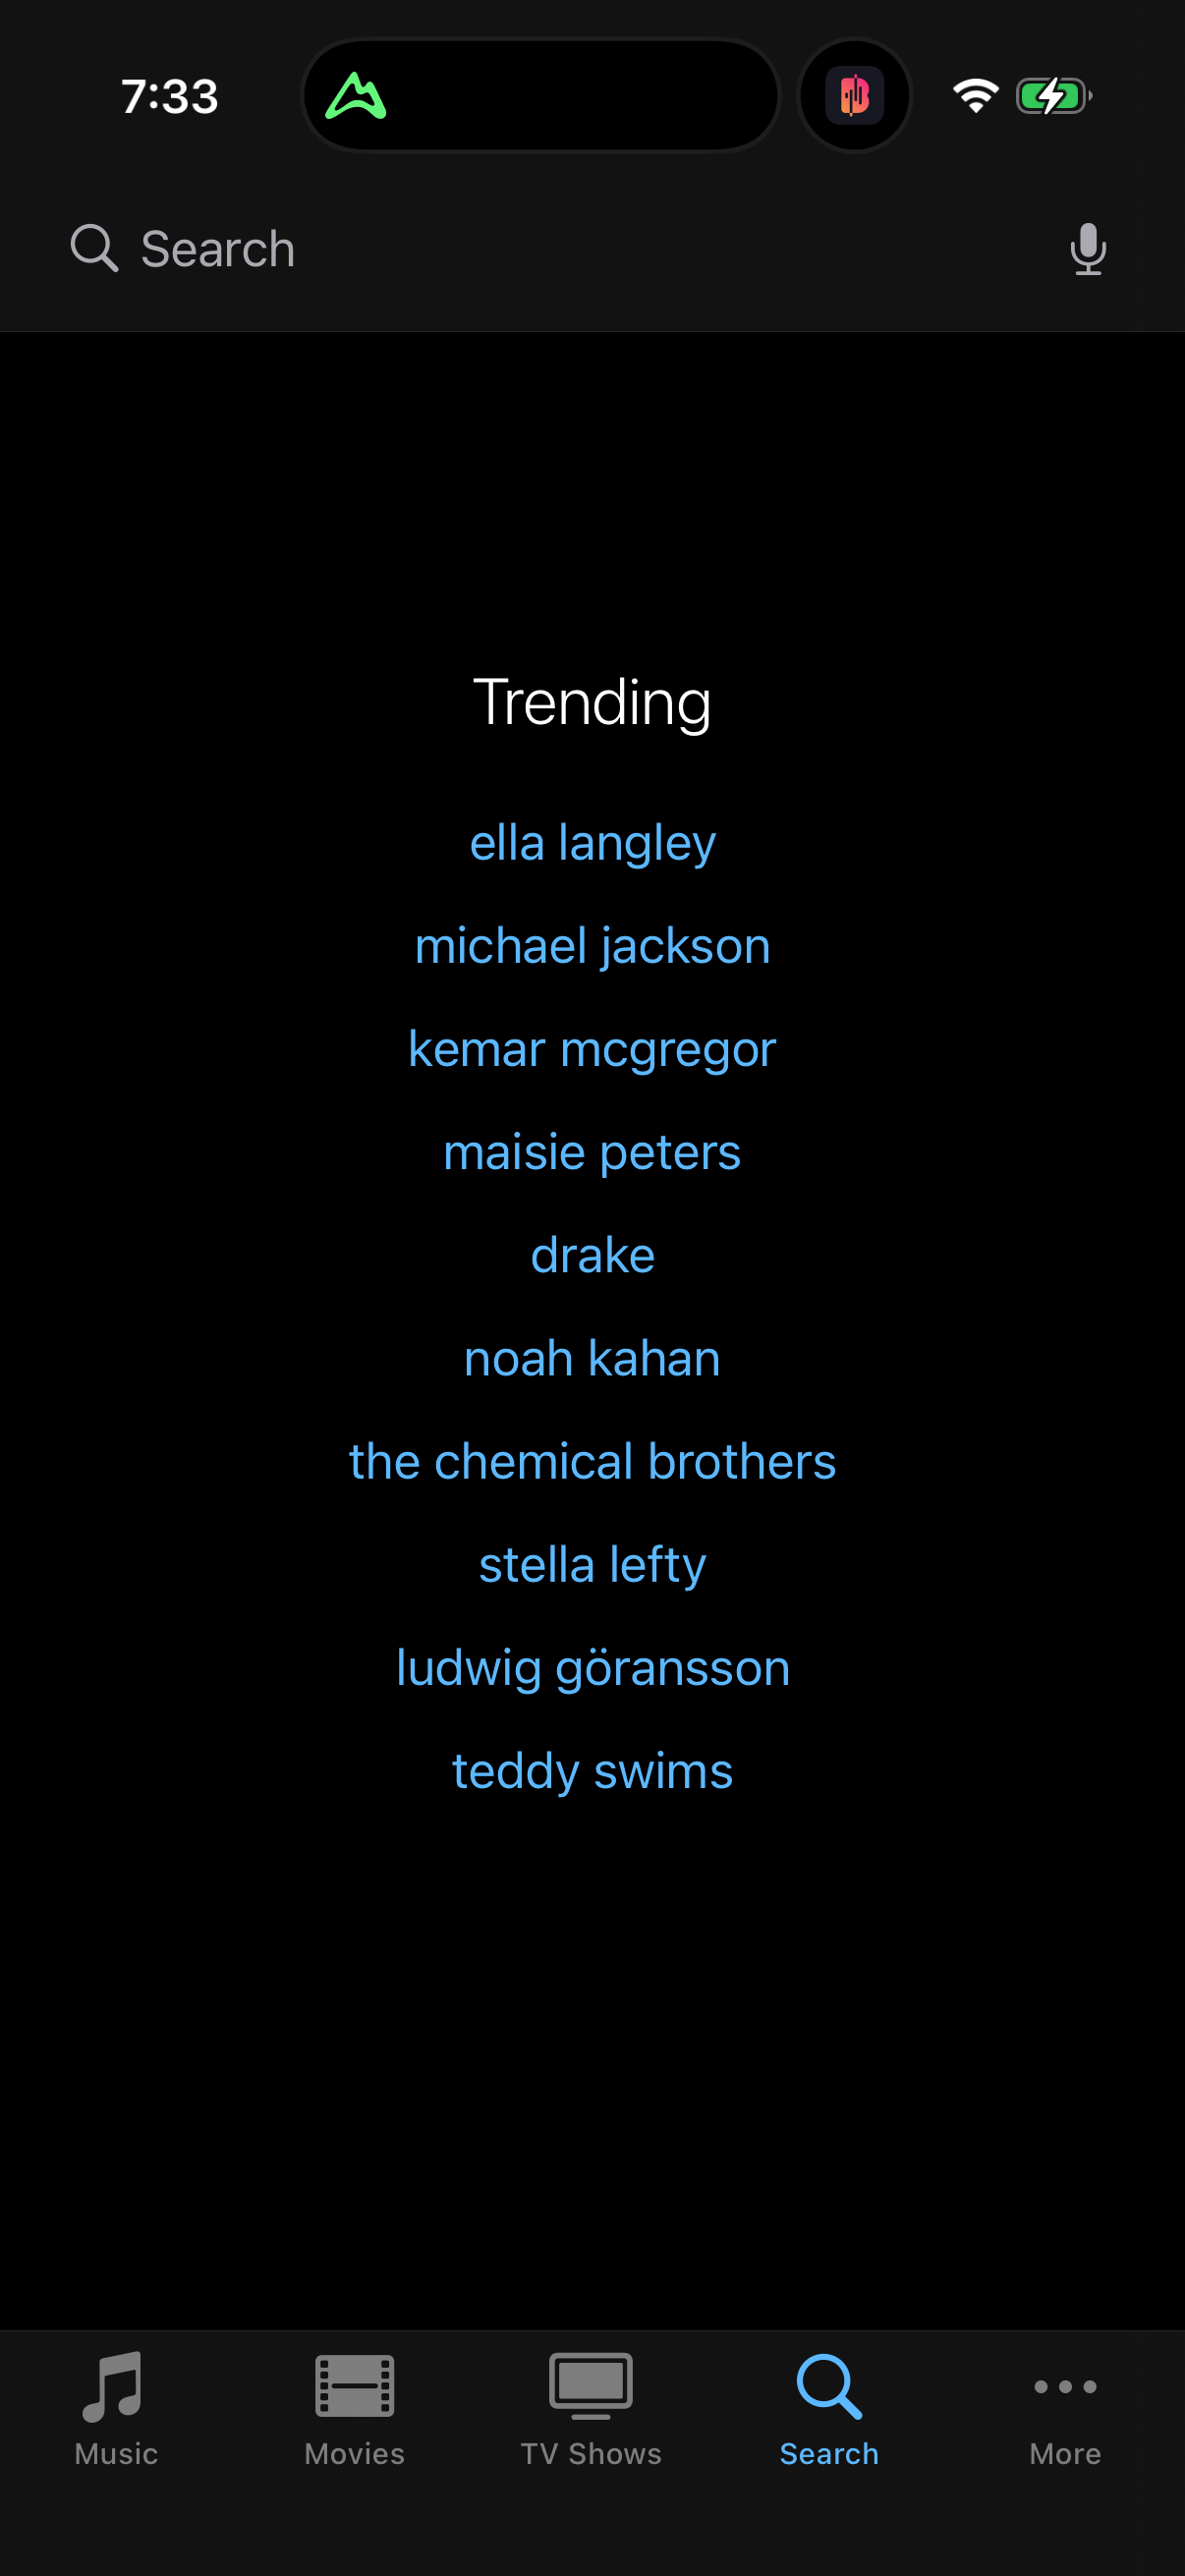
Itunes1206 × 2622opens the full image 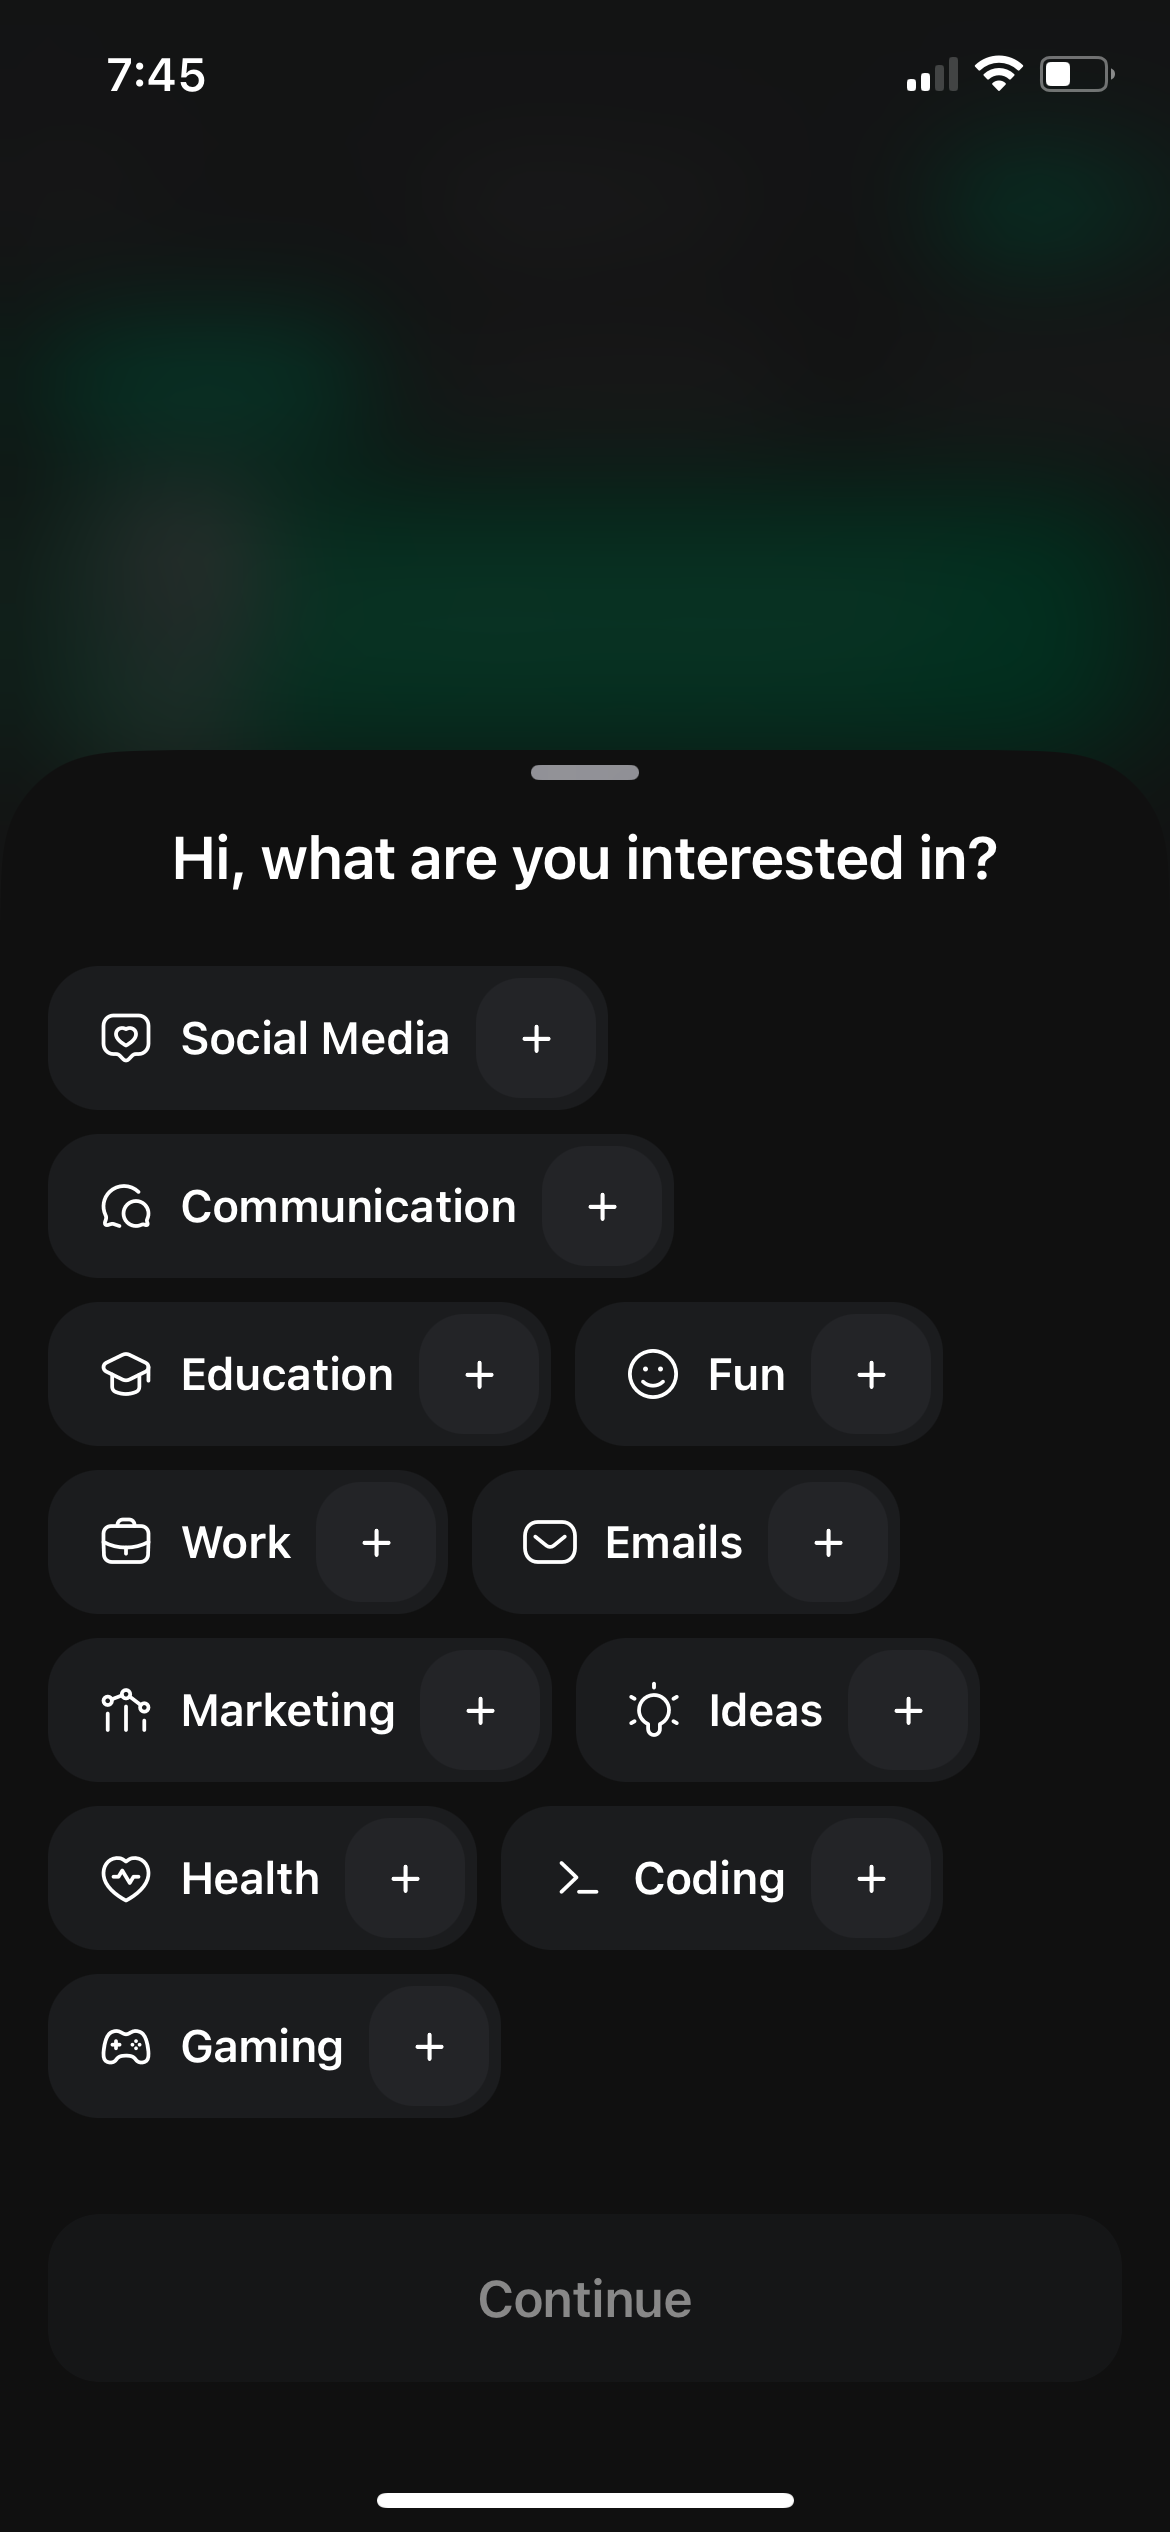
Chaton1170 × 2532opens the full image 
Wsj1206 × 2622opens the full image 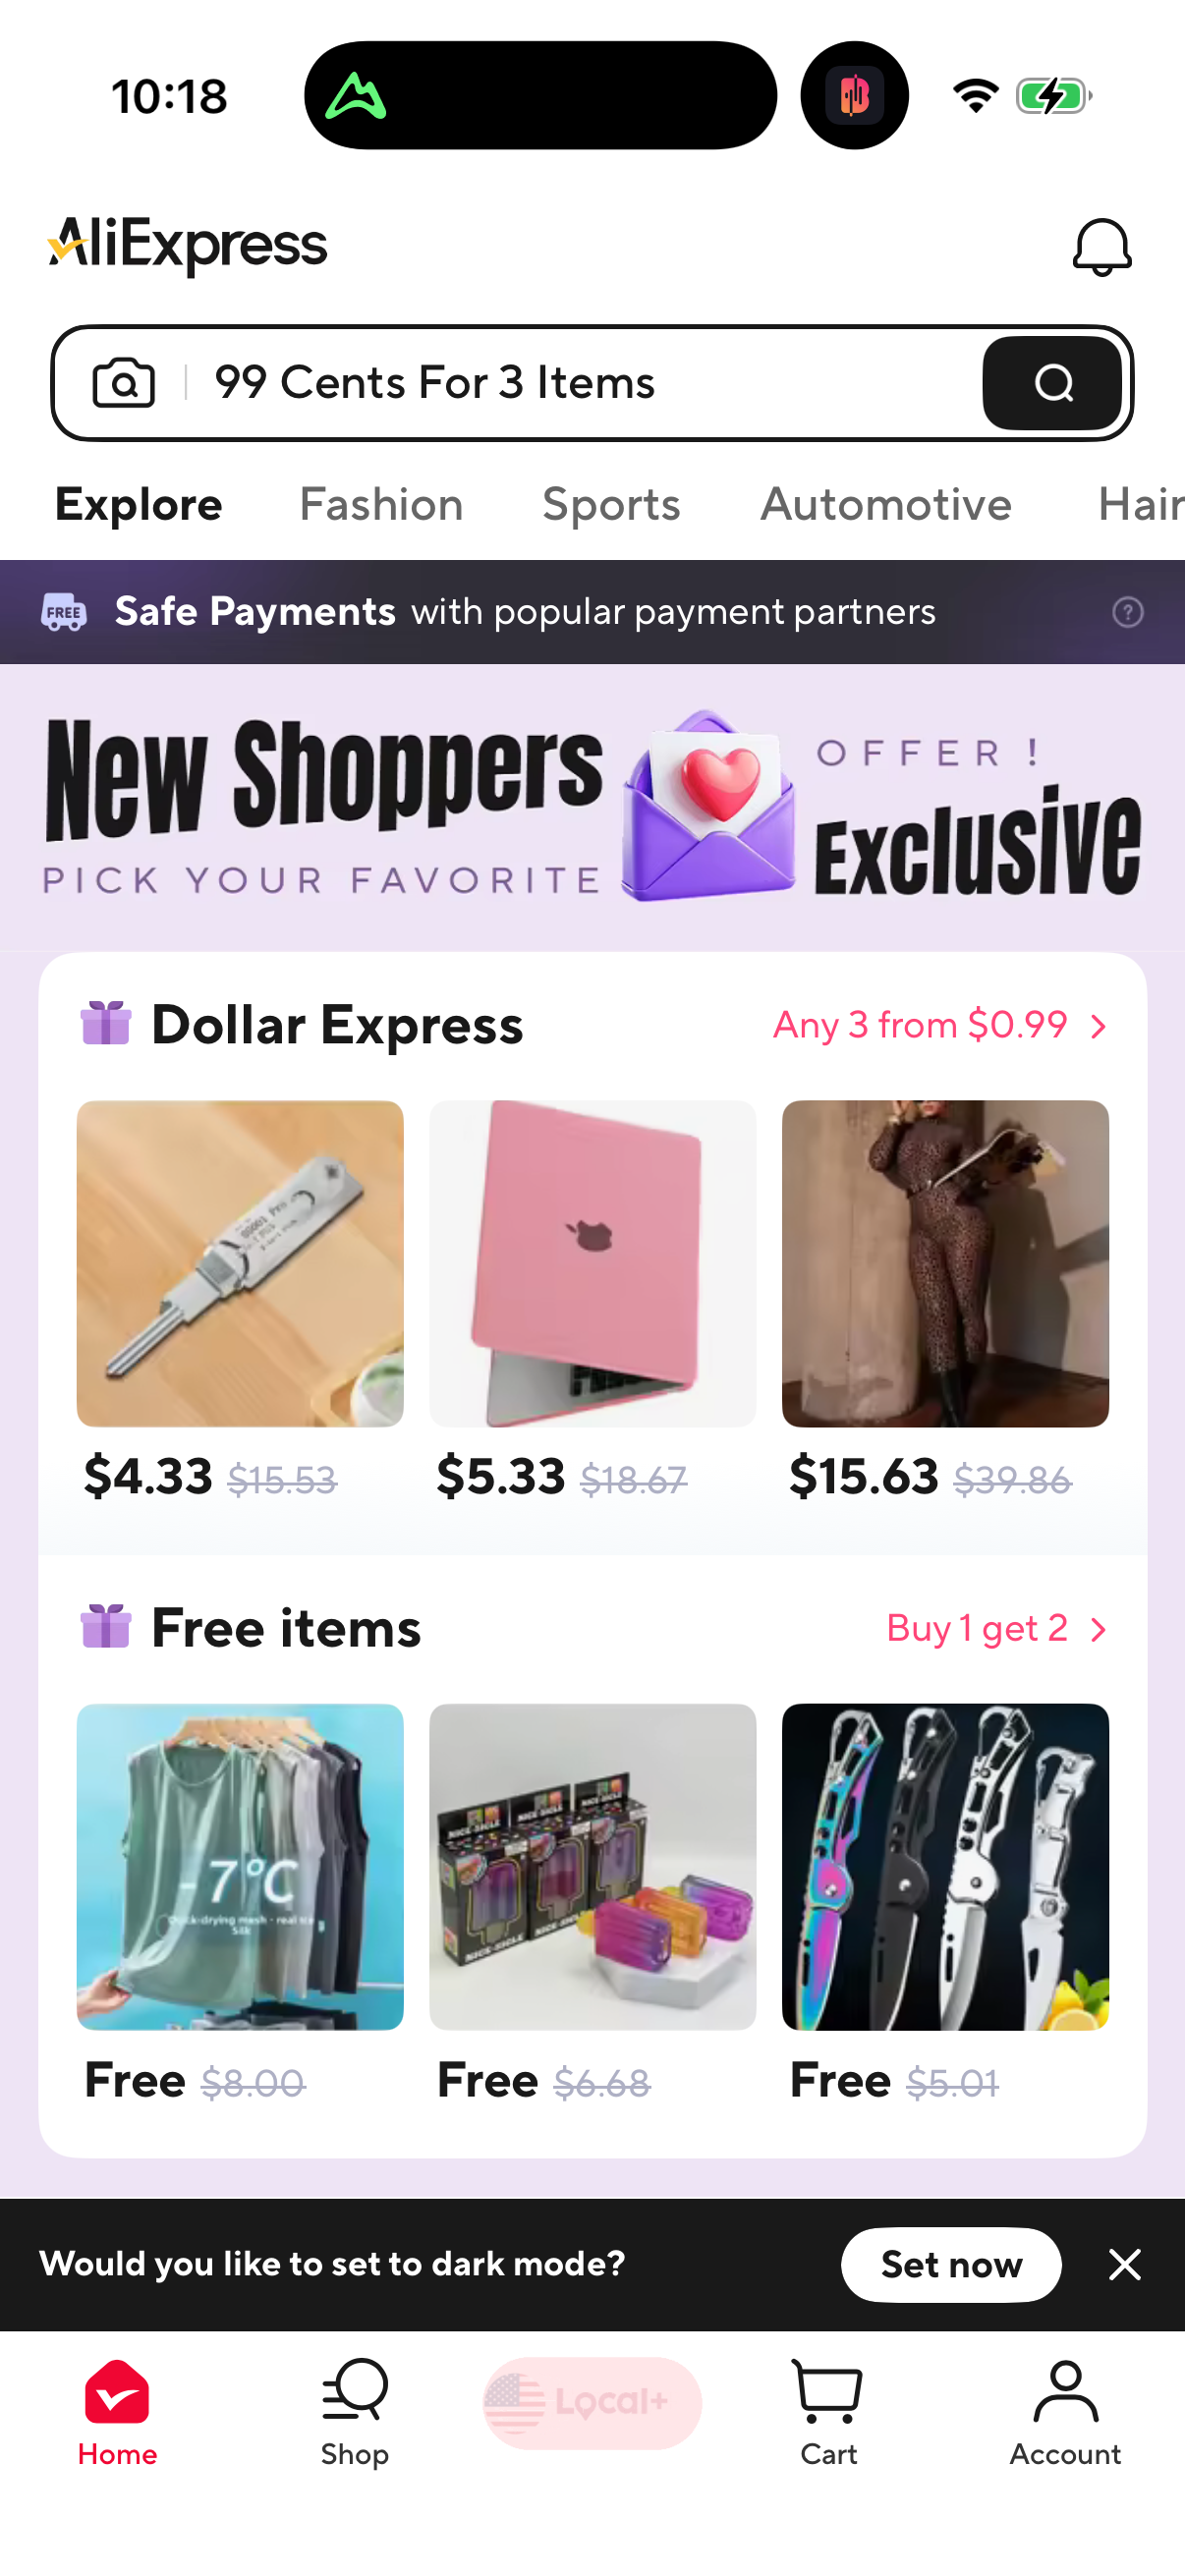
Aliexpress1206 × 2622opens the full image
The numbers
| # | Stat | Computed from |
|---|---|---|
| [1] | 25.6% (2023, 75/293) -> 48.9% (2024, 195/399) -> 53.3% (2025, 389/730) | social_proof_prevalence_over_time |
| [2] | 2026 partial = 45 apps (thin-capture artifact, not comparable); trends normalized to companies/year | social_proof_prevalence_over_time / capture_cadence_note |
Methodology
Universe: 47,578 capture-dated screenshots across 809 tracked mobile apps. Method: for each capture year, share of distinct companies whose screens carry a social-proof/testimonial/review/rating tag. Reliable window 2023-2025; partial-2026 excluded. Caveat: broad review/rating terms make this an upper-leaning estimate within the social-proof family and a lower bound on tag recall.
Sources
- [1]
Lazyweb Research analysis of 809 tracked apps (mobile-app corpus, 47,578 capture-dated screenshots), July 2026
Prevalence = share of companies captured each year whose screens carry a social-proof/testimonial/review/rating tag, deduped by company_name.
- [2]
Lazyweb Research analysis of 809 tracked apps (mobile-app corpus, 47,578 capture-dated screenshots), July 2026
2026 captures run only through Jul 4 with thin tagging; that year is excluded from the trend.
Source: Lazyweb Research — proprietary analysis of real, in-market app screens. Cite as Lazyweb Research, 2026-07-07.
Explore the evidence
- Full 45-frame August 2026 capture
- Three captured screens · August 2026