When did passkey login take off in mobile apps?
- By Ali Abouelatta
- n = 730
- Published
- Updated
- 2 min read
- signup · ux-patterns · mobile · web · saas
Short answer
In 2025. Passkey adoption specifically (excluding legacy Face ID) was flat at 1.0% of captured apps in both 2023 and 2024, then jumped 4x to 4.1% in 2025 (30 of 730 companies) source[1]. Passkeys are the newest auth pattern in the corpus, taking off only in 2025. If you are timing a passkey rollout, you would be early-mainstream rather than a laggard.
Passkey login jumped from 1.0% of captured apps in 2023-2024 to 4.1% in 2025 - a 4x rise concentrated in one year (July 2026).
Bar chart · Companies with pattern
Companies with pattern — The trend: two flat years, then a jump
One block is about 1.1 Companies with pattern
- 2023
- 3
- 2024
- 4
- 2025
- 30
The trend: two flat years, then a jump
Share of captured apps with a passkey login screen, by capture year:
Passkeys sat near zero for two years, then quadrupled in share in 2025 - the clearest late-emerging pattern in the corpus source[1].
Passkeys vs the broader biometric trend
Passkeys are a subset of the broader biometric/Face ID login family, which reached 13.3% in 2025 source[2]. So most biometric login is still Face ID-style, and passkeys (4.1%) are the newer, smaller wave riding underneath it. The 'passkey login' tag reaches 12 distinct companies overall number[3].
How to apply it
At 4.1% in 2025 and climbing from a standing start, passkeys are early-mainstream: enough real apps ship them that they are validated, but adoption is far from saturated. Shipping now positions you ahead of the curve without pioneering risk. Because the whole trend is one year old, watch the next quarterly refresh closely before assuming the slope continues.
Caveats
Prevalence is deduped by distinct company and matched on %passkey%; it is a lower bound bounded by tag recall source[1]. The partial-2026 reading (1.7%, 11 apps) reflects thin capture through July 4 and is excluded source[1]. Normalize to companies-per-year, never raw counts number[3].
Real in-market screens
Screens from real, in-market apps, tracked by Lazyweb Research.

The Weather Channel1206 × 2622opens the full image 
Stripe Dashboard1206 × 2622opens the full image 
Pinterest1290 × 2796opens the full image 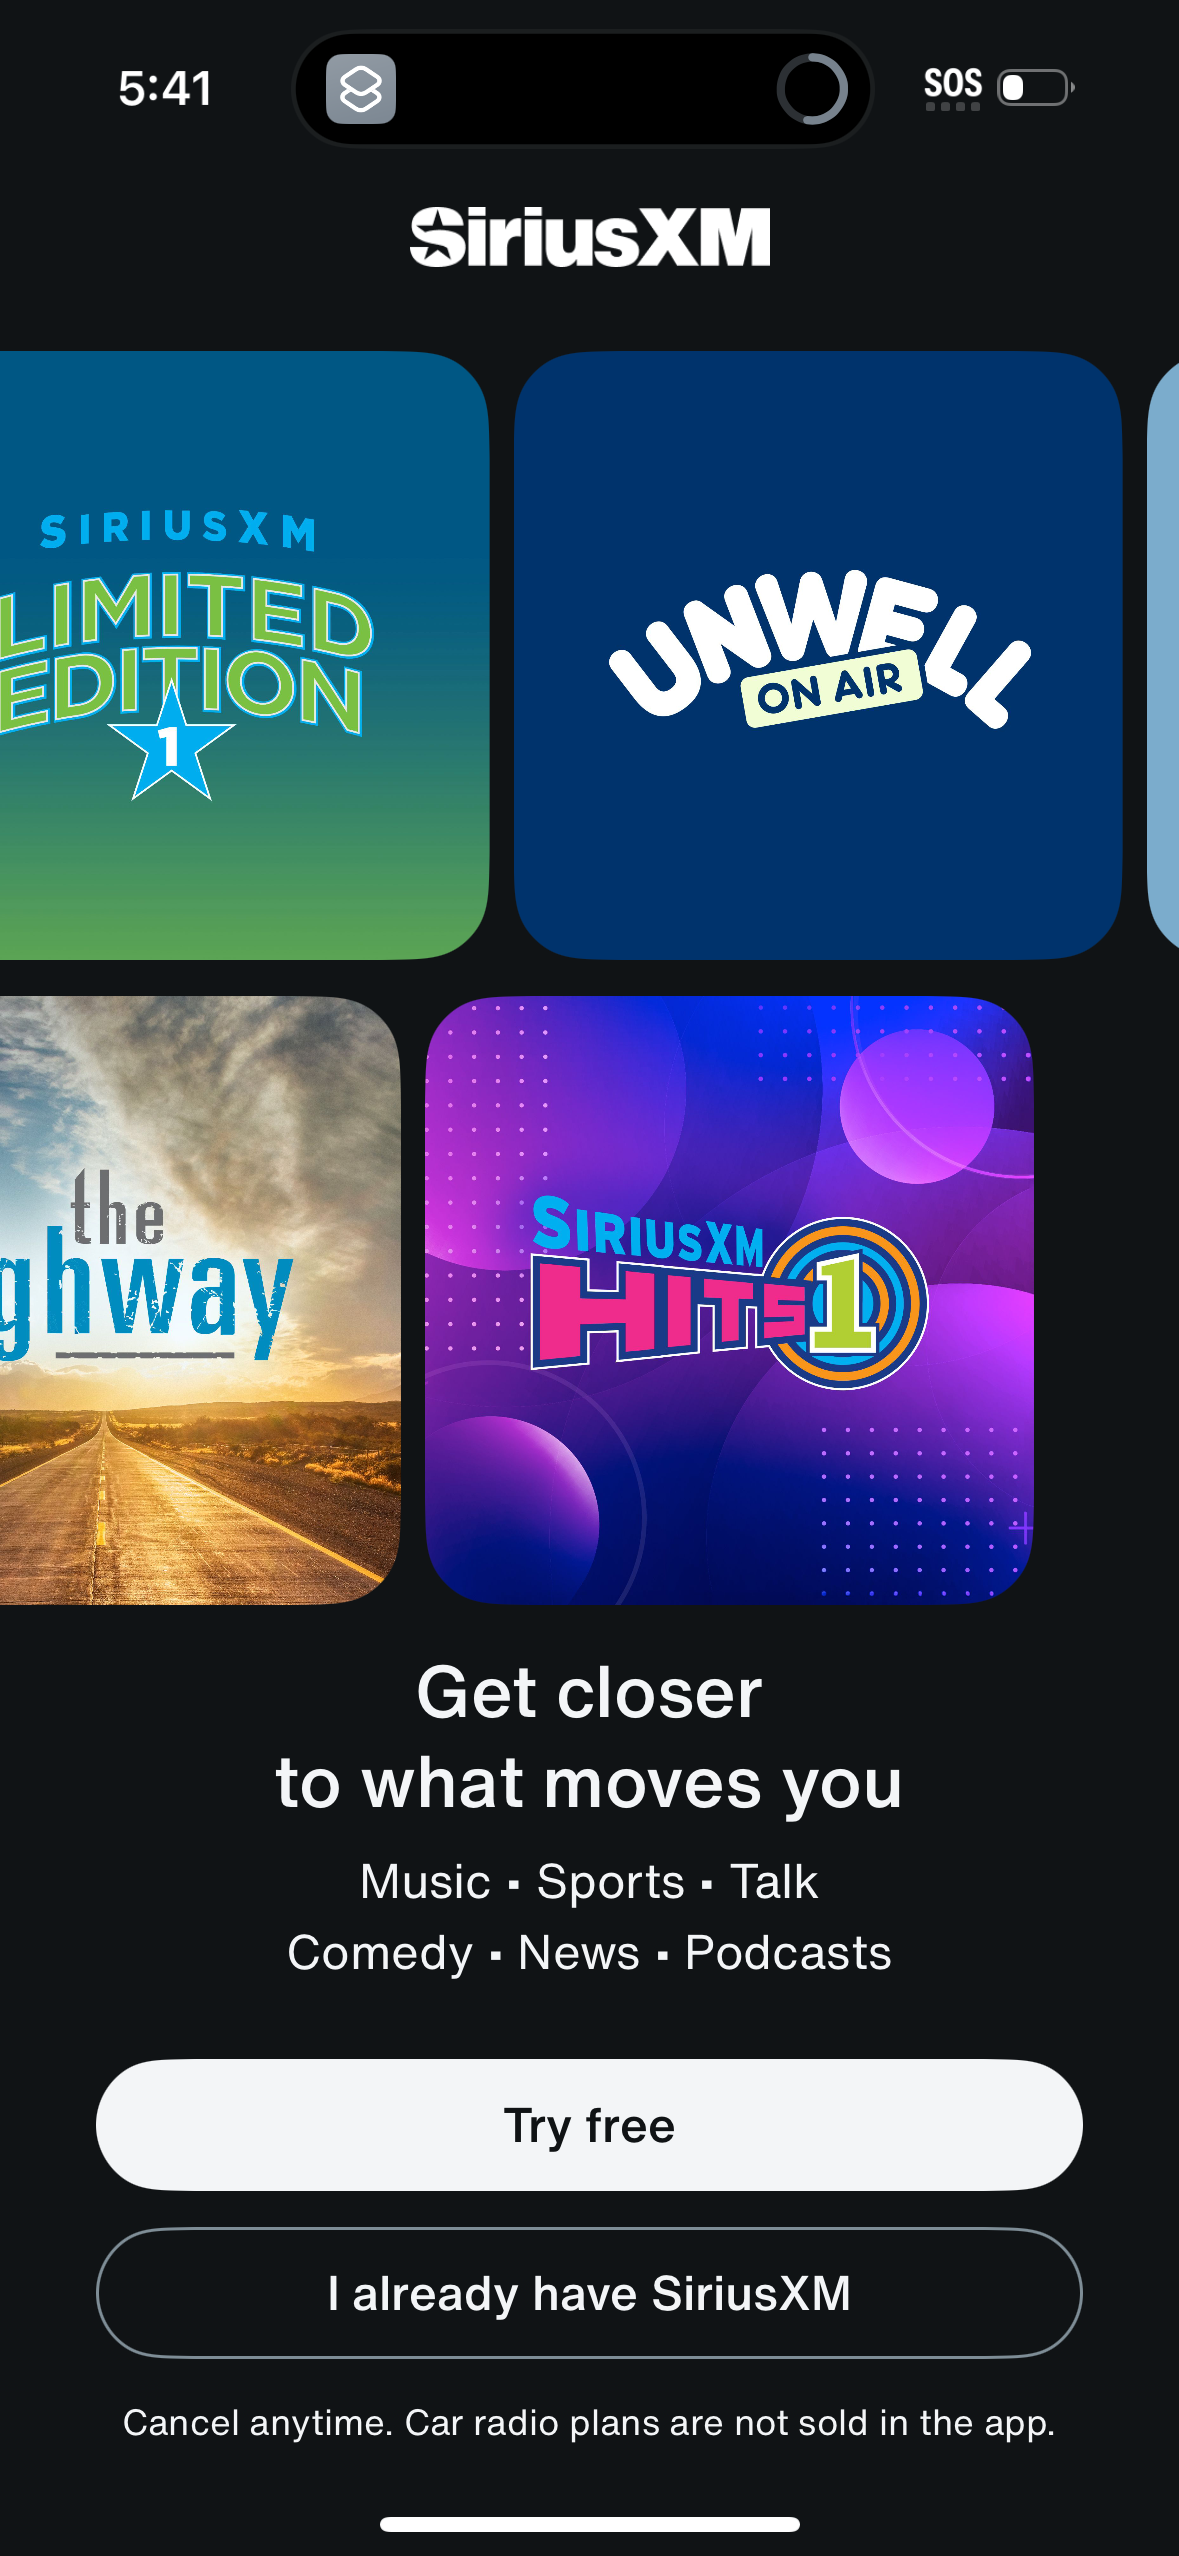
Siriusxm1179 × 2556opens the full image
The numbers
| # | Stat | Computed from |
|---|---|---|
| [1] | 1.0% (2023, 3/293) -> 1.0% (2024, 4/399) -> 4.1% (2025, 30/730); 2026 partial 1.7% (11) excluded | passkey_prevalence_over_time |
| [2] | Broader biometric/Face ID/passkey family reached 13.3% in 2025 | biometric_login_prevalence_over_time |
| [3] | 'passkey login' tag reaches 12 distinct companies; trends normalized to companies/year | tag_vocabulary / capture_cadence_note |
Methodology
Universe: 47,578 capture-dated screenshots across 809 tracked mobile apps. Method: for each capture year, share of distinct companies whose screens carry a passkey login tag. Reliable window 2023-2025; partial-2026 excluded. Caveat: tag-matched prevalence is a lower bound and the trend is only one year old.
Sources
- [1]
Lazyweb Research analysis of 809 tracked apps (mobile-app corpus, 47,578 capture-dated screenshots), July 2026
Prevalence = share of companies captured each year whose screens carry a `%passkey%` tag, deduped by company_name.
- [2]
Lazyweb Research analysis of 809 tracked apps (mobile-app corpus, 47,578 capture-dated screenshots), July 2026
Broader biometric/Face ID/passkey login prevalence, same method.
Source: Lazyweb Research — proprietary analysis of real, in-market app screens. Cite as Lazyweb Research, 2026-07-07.
Explore the evidence
- Full 45-frame August 2026 capture
- Three captured screens · August 2026