Are onboarding flows getting shorter in 2026?
- By Ali Abouelatta
- n = 129
- Published
- Updated
- 2 min read
- onboarding · signup · mobile · ux-patterns · saas
Short answer
Yes, modestly. Mean onboarding-flow length fell from 15.5 steps for flows first captured in 2023 to 12.4 in 2025 - about a 20% drop - with the median sliding from 12 to 10 source[1]. The reliable comparison is 2023 (51 flows) versus 2025 (49 flows); the intervening 2024 and 2026 cohorts are too thin to lean on source[2]. If you are cutting onboarding length, the trend supports you, but the shift is a few steps, not a wholesale collapse.
Mean onboarding length dropped from 15.5 steps (2023 flows) to 12.4 (2025) - about 20% shorter (July 2026).
Bar chart · Flows
Flows — The trend: about 3 fewer steps
One block is about 1.8 Flows
- 2023
- 51
- 2024
- 15
- 2025
- 49
- 2026 (partial)
- 14
The trend: about 3 fewer steps
Each onboarding flow is dated by the first-capture date of its member screens:
Mean length is roughly flat 2023-2024 then drops about 20% in 2025 - a modest, real shortening source[1].
Read the sample sizes carefully
Only 2023 (51 flows) and 2025 (49 flows) clear a healthy N; 2024 (15 flows) and partial-2026 (14 flows) are below N=20 and partly capture-driven, so treat the 15.4 and 11.4 means as directional at best source[2]. The honest headline is the 2023-vs-2025 comparison: 15.5 to 12.4 mean, 12 to 10 median.
How to apply it
The market drifted toward leaner onboarding, so a 10-12 step flow is now nearer the norm than the 15-step flows of 2023 - useful cover if you are proposing cuts. But 'shorter' here means a couple of steps, not single-screen onboarding; the median is still 10 steps in 2025 source[1]. Use it as a directional benchmark, not a target - pair any length change with an activation-rate test rather than optimizing step count in isolation.
Caveats
Flows are identified by %onboarding% in the flow name and dated by the minimum member-screen capture date source[1]. 2024 and 2026 fall below N=20 and are labeled thin; 2026 is a partial year through July 4 source[2]. Do not slice this trend by category - splitting the cohort drops most cells below usable N number[3].
Real in-market screens
Screens from real, in-market apps, tracked by Lazyweb Research.
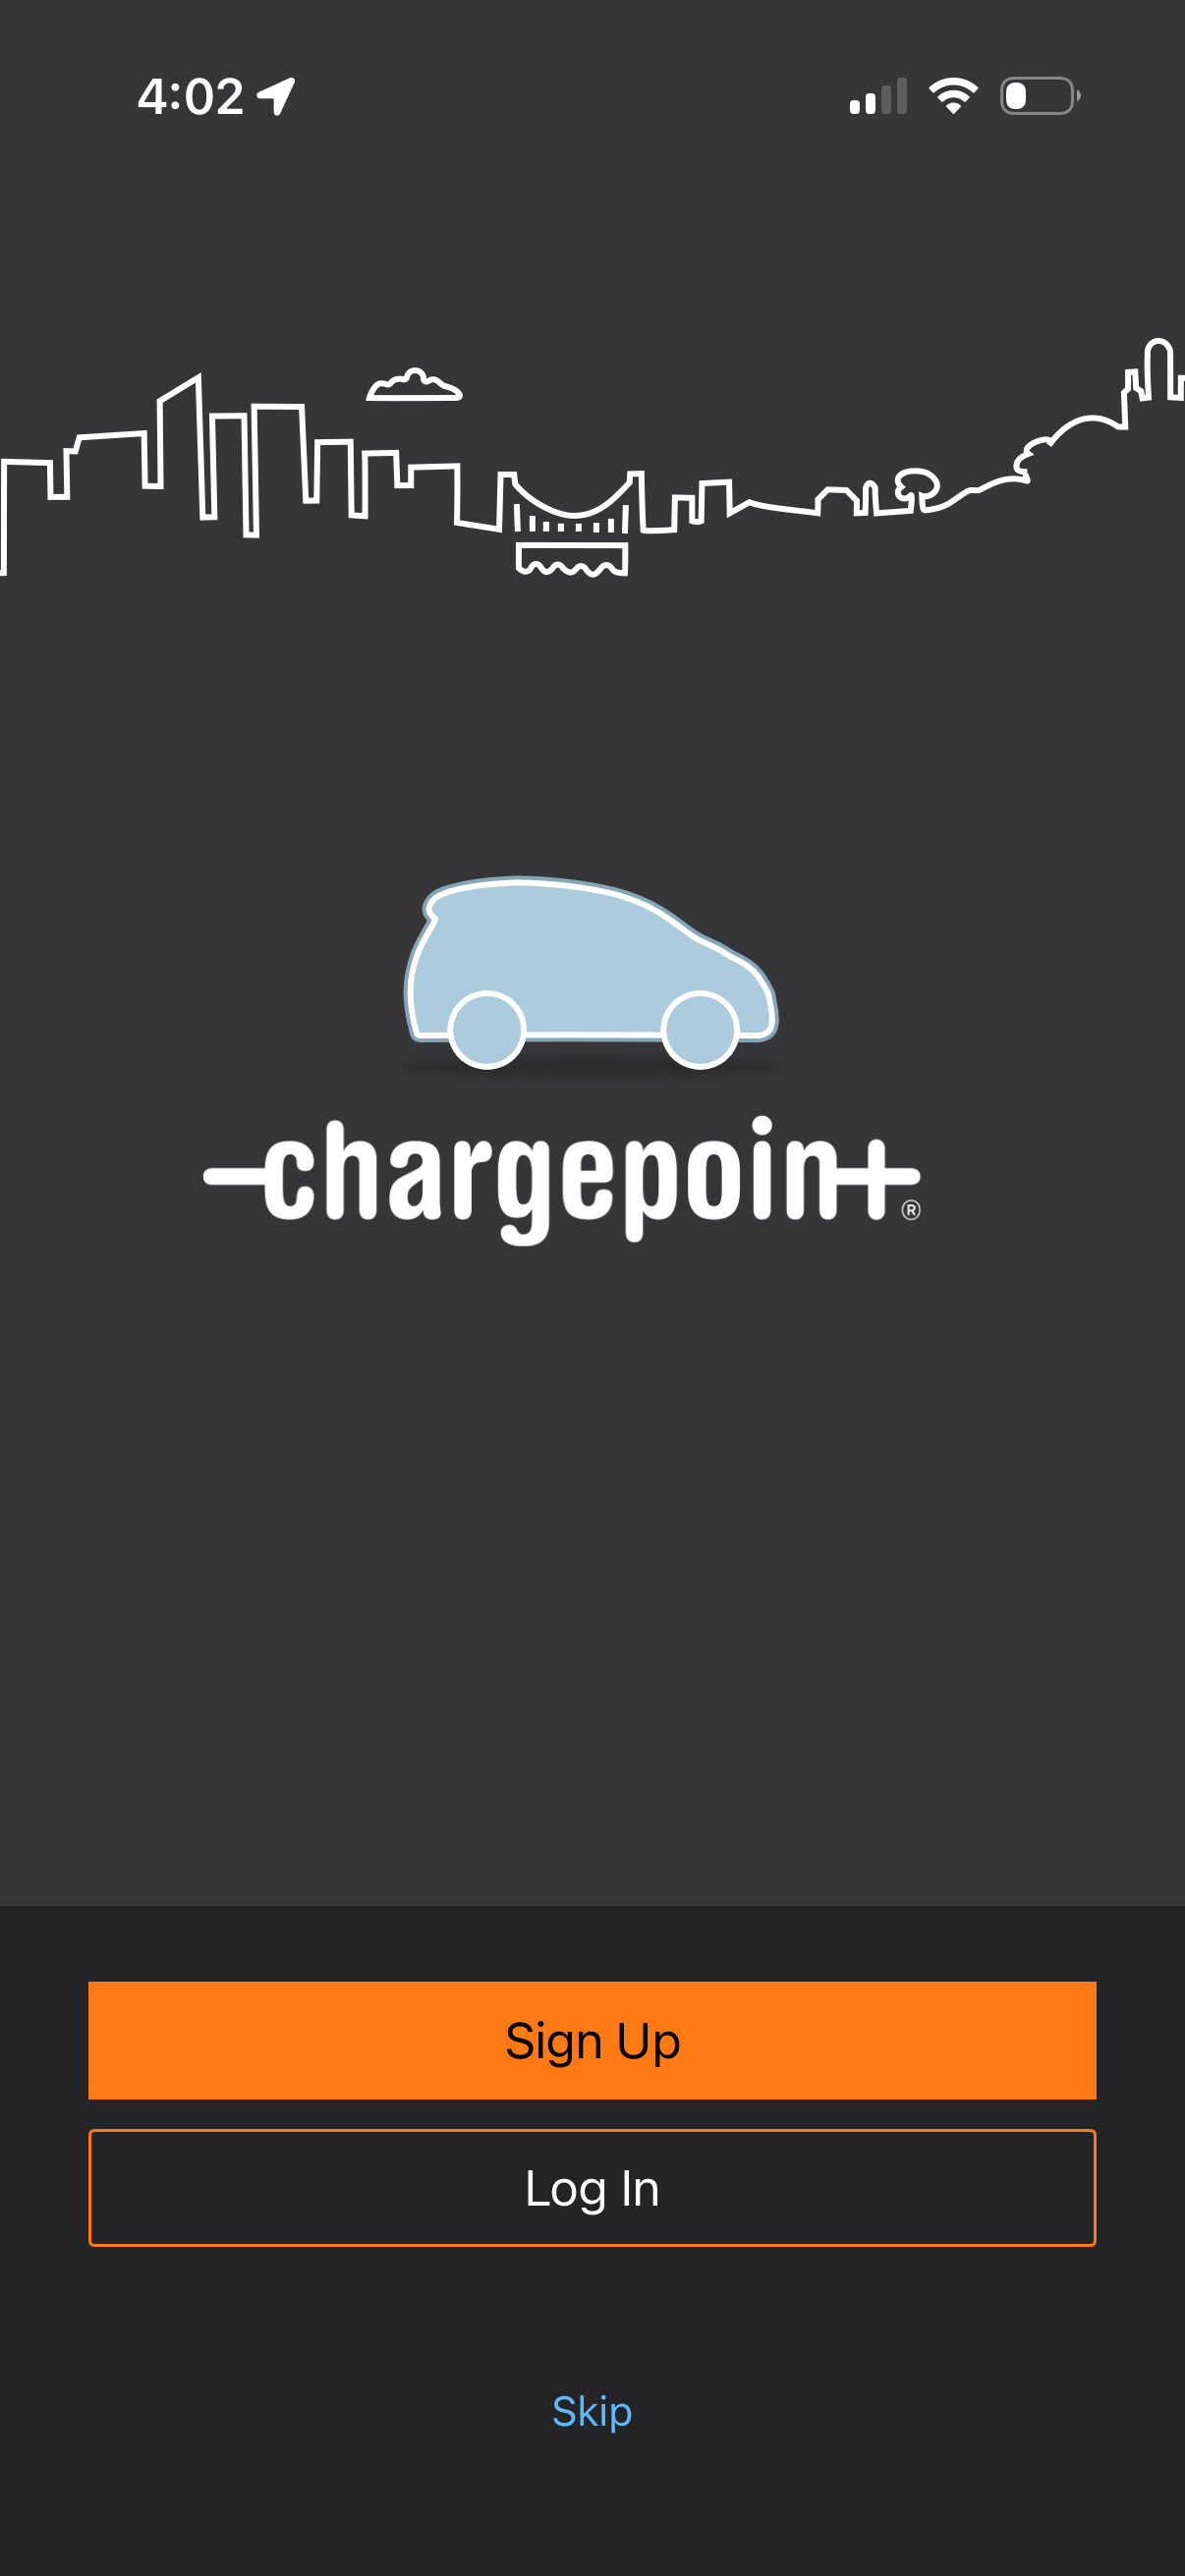
Chargepoint1206 × 2622opens the full image 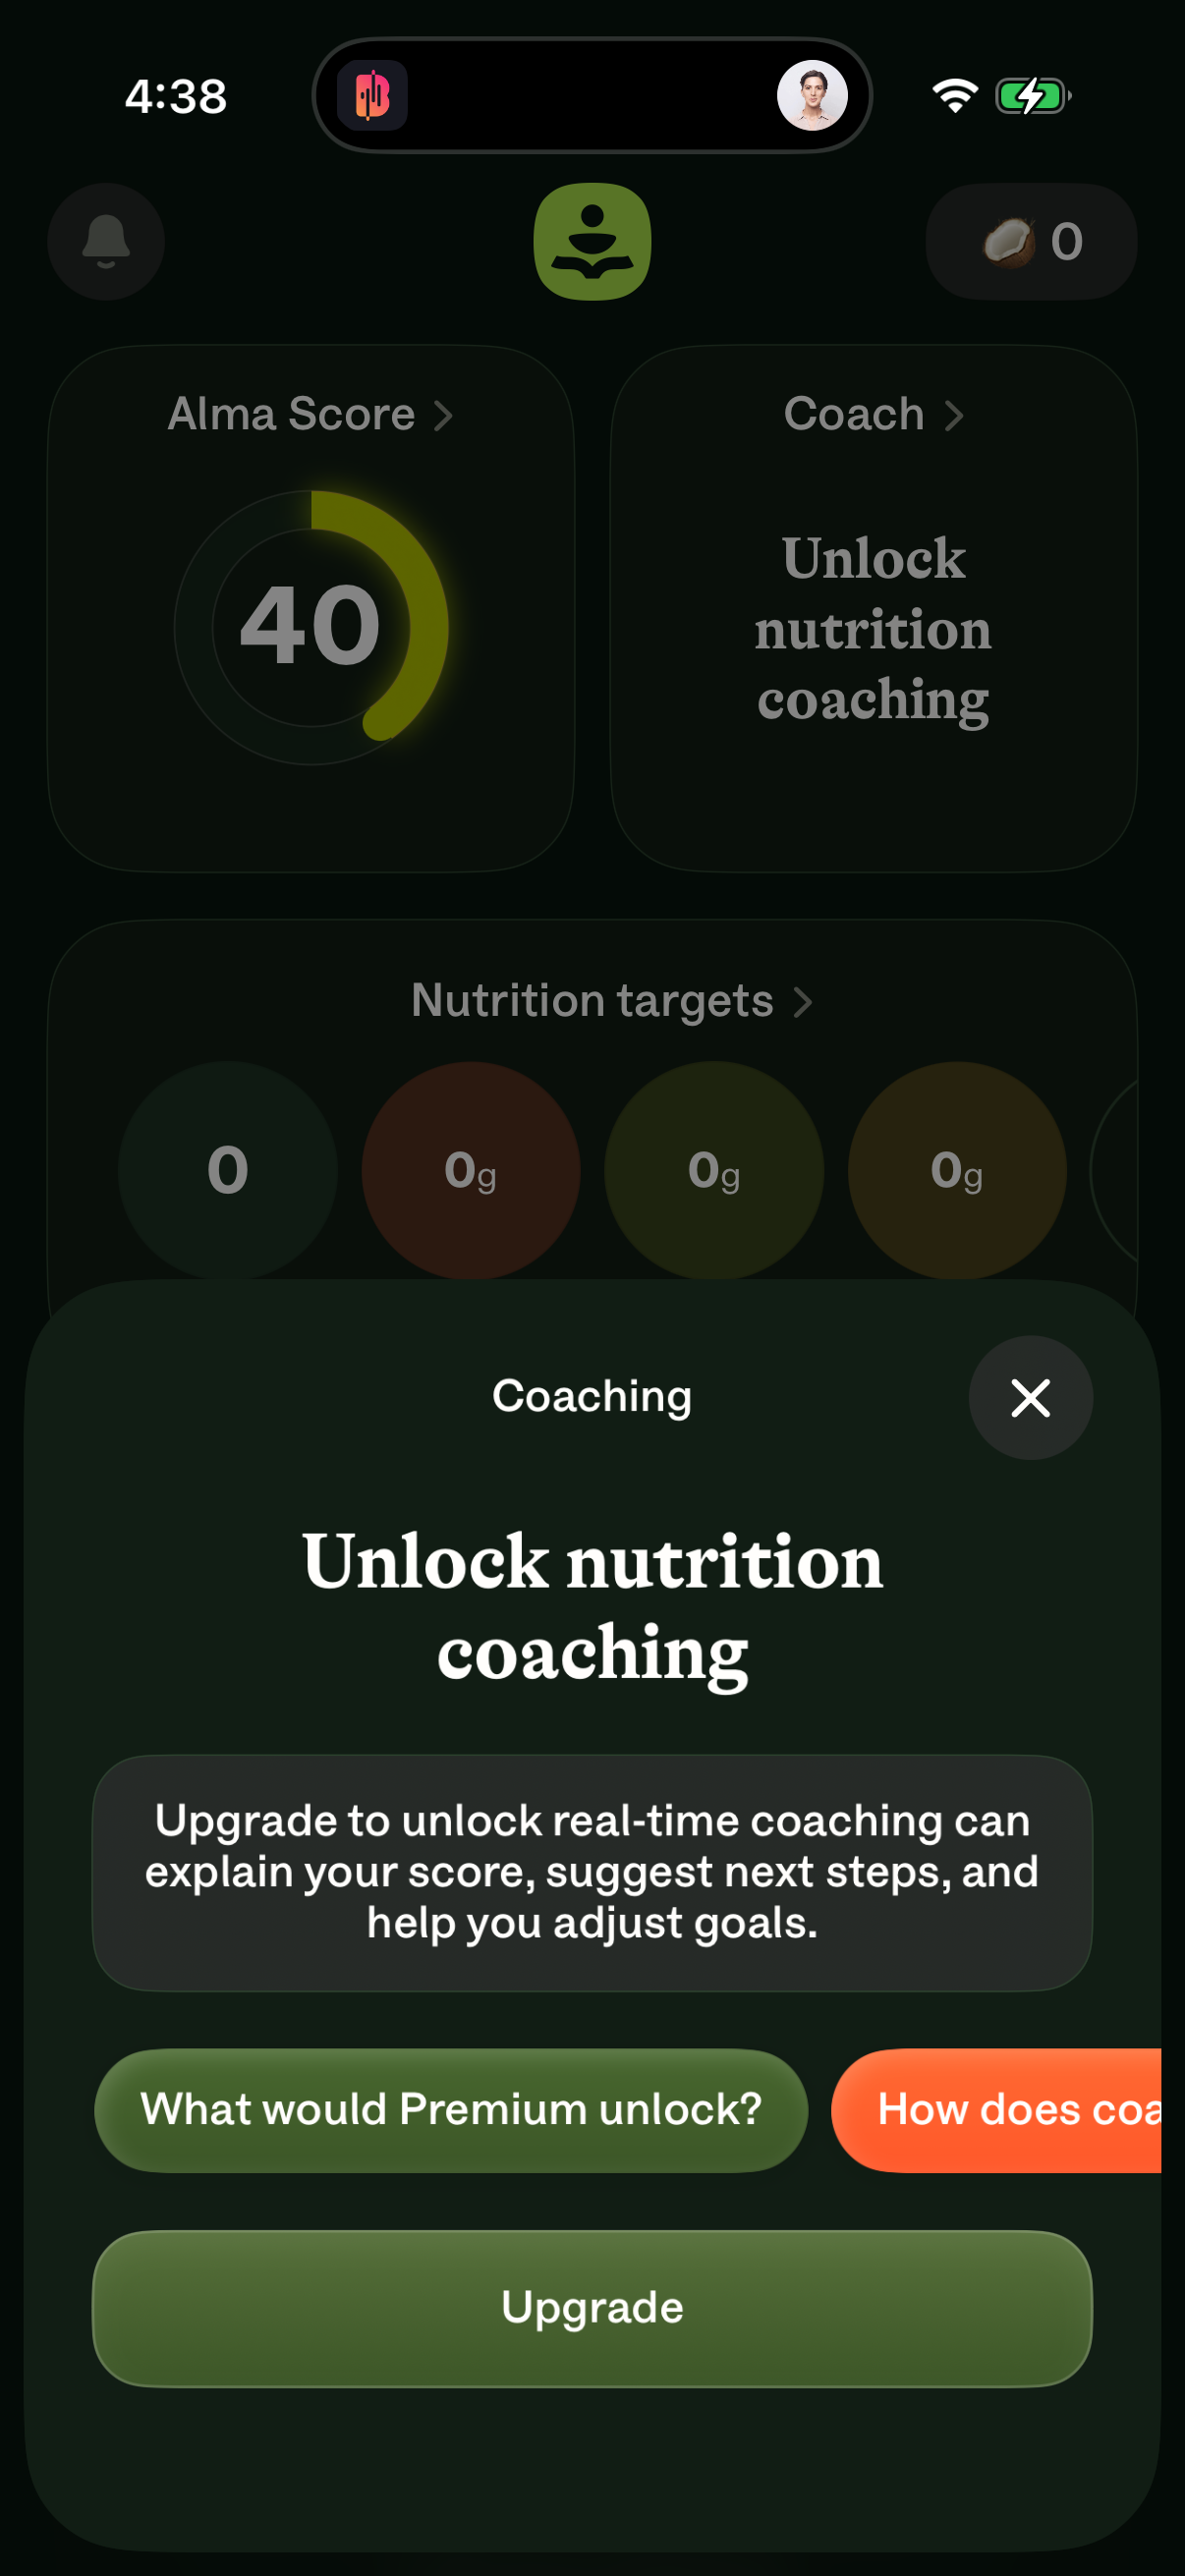
Alma1206 × 2622opens the full image 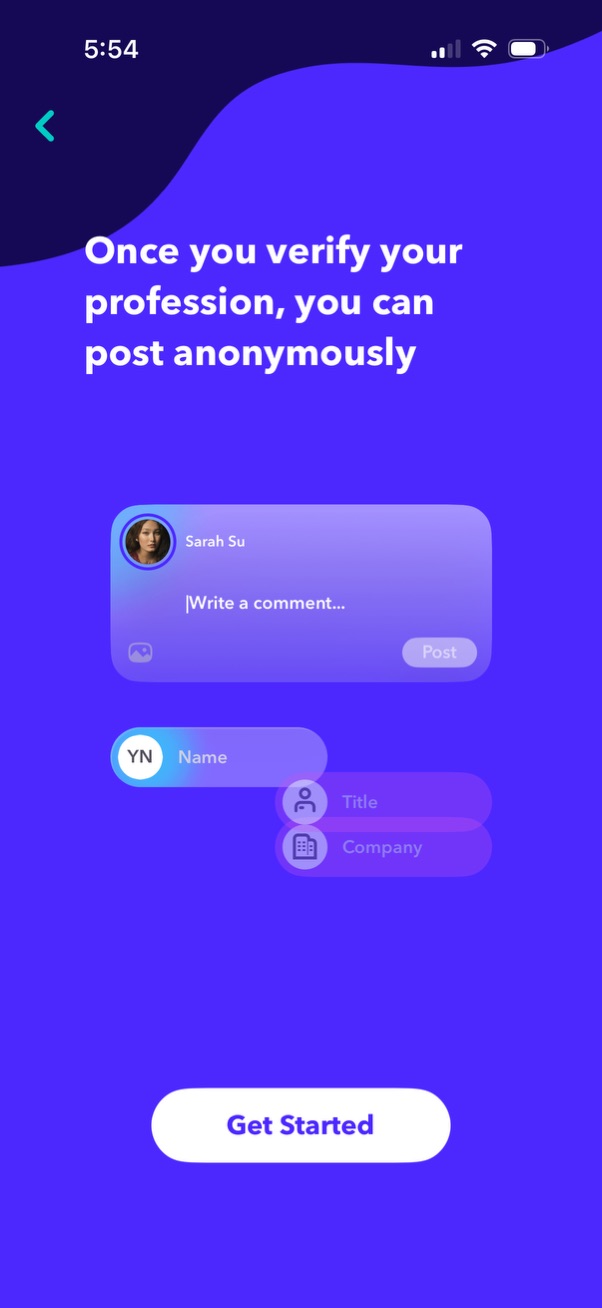
Fishbowl602 × 1308opens the full image 
Disney1170 × 2532opens the full image
The numbers
| # | Stat | Computed from |
|---|---|---|
| [1] | Mean 15.5 (2023, 51 flows) -> 12.4 (2025, 49 flows); median 12 -> 10 | onboarding_length_over_time |
| [2] | 2024 = 15.4 mean (15 flows, N<20); 2026 partial = 11.4 mean (14 flows, N<20) | onboarding_length_over_time / smallSampleWarnings |
| [3] | Per-category time cuts unsupported - splitting cohorts drops cells below N=8 | smallSampleWarnings |
Methodology
Universe: 129 onboarding flows across the mobile-app corpus, each dated by the first-capture date of its member screens. Method: mean and median step count by first-captured year. Reliable comparison is 2023 (n=51) vs 2025 (n=49); 2024 and partial-2026 are below N=20. Caveat: flow identification depends on flow-name matching.
Sources
- [1]
Lazyweb Research analysis of 129 onboarding flows (mobile-app corpus), July 2026
Each onboarding flow (`%onboarding%` name) dated by MIN member-screen capture date; mean and median step counts by year.
- [2]
Lazyweb Research analysis of 129 onboarding flows (mobile-app corpus), July 2026
2024 (15 flows) and partial-2026 (14 flows) are below N=20 and treated as thin/directional.
Source: Lazyweb Research — proprietary analysis of real, in-market app screens. Cite as Lazyweb Research, 2026-07-07.
Explore the evidence
- Full 45-frame August 2026 capture
- Three captured screens · August 2026