Is the countdown-timer paywall growing or dying?
- By Ali Abouelatta
- n = 730
- Published
- Updated
- 2 min read
- paywall · monetization · pricing · mobile · ux-patterns
Short answer
Neither - it peaked. Countdown-timer urgency screens rose from 5.1% of captured apps in 2023 to a 12.5% peak in 2024, then eased to 10.1% in 2025 (74 of 730 companies) source[1]. It is past its peak but far from dead, sitting on roughly one in ten captured apps. If you are weighing an urgency paywall, it is a mature, still-common tactic rather than a rising or fading one.
Countdown-timer paywalls peaked at 12.5% of captured apps in 2024, easing to 10.1% in 2025 (July 2026).
Bar chart · Companies with pattern
Companies with pattern — The trend: fast rise, then a plateau
One block is about 2.6 Companies with pattern
- 2023
- 15
- 2024
- 50
- 2025
- 74
The trend: fast rise, then a plateau
Share of captured apps with a countdown-timer (urgency) screen, by capture year:
The pattern more than doubled into 2024, then slipped slightly in 2025 - a plateau off its peak, not a collapse source[1].
Why the 2026 number is not a signal
The partial-2026 reading of 0.3% (2 apps) looks like a crash but is an artifact of thin 2026 capture and tagging volume through July 4 - not a real disappearance of the pattern. It is explicitly flagged as not-a-trend-point and should never be plotted source[2].
How to apply it
At ~10% prevalence in 2025, countdown urgency is a proven, widely-used paywall tactic - common enough to be familiar to users, which cuts both ways (lower novelty, possible fatigue). The 2024 peak suggests the easy adoption wave is over; treat it as a known lever to test against your baseline rather than a fresh trend to chase. Related urgency tags such as 'countdown timer offer' reach 14 distinct companies, confirming this is a real tag family, not a one-off label number[3].
Caveats
Prevalence is deduped by distinct company and matched on %countdown%; it is a lower bound bounded by tag recall source[1]. Normalize to companies-per-year, never raw counts, because capture cadence is highly uneven number[4]. The 2026 partial year is excluded as an artifact source[2].
Real in-market screens
Screens from real, in-market apps, tracked by Lazyweb Research.
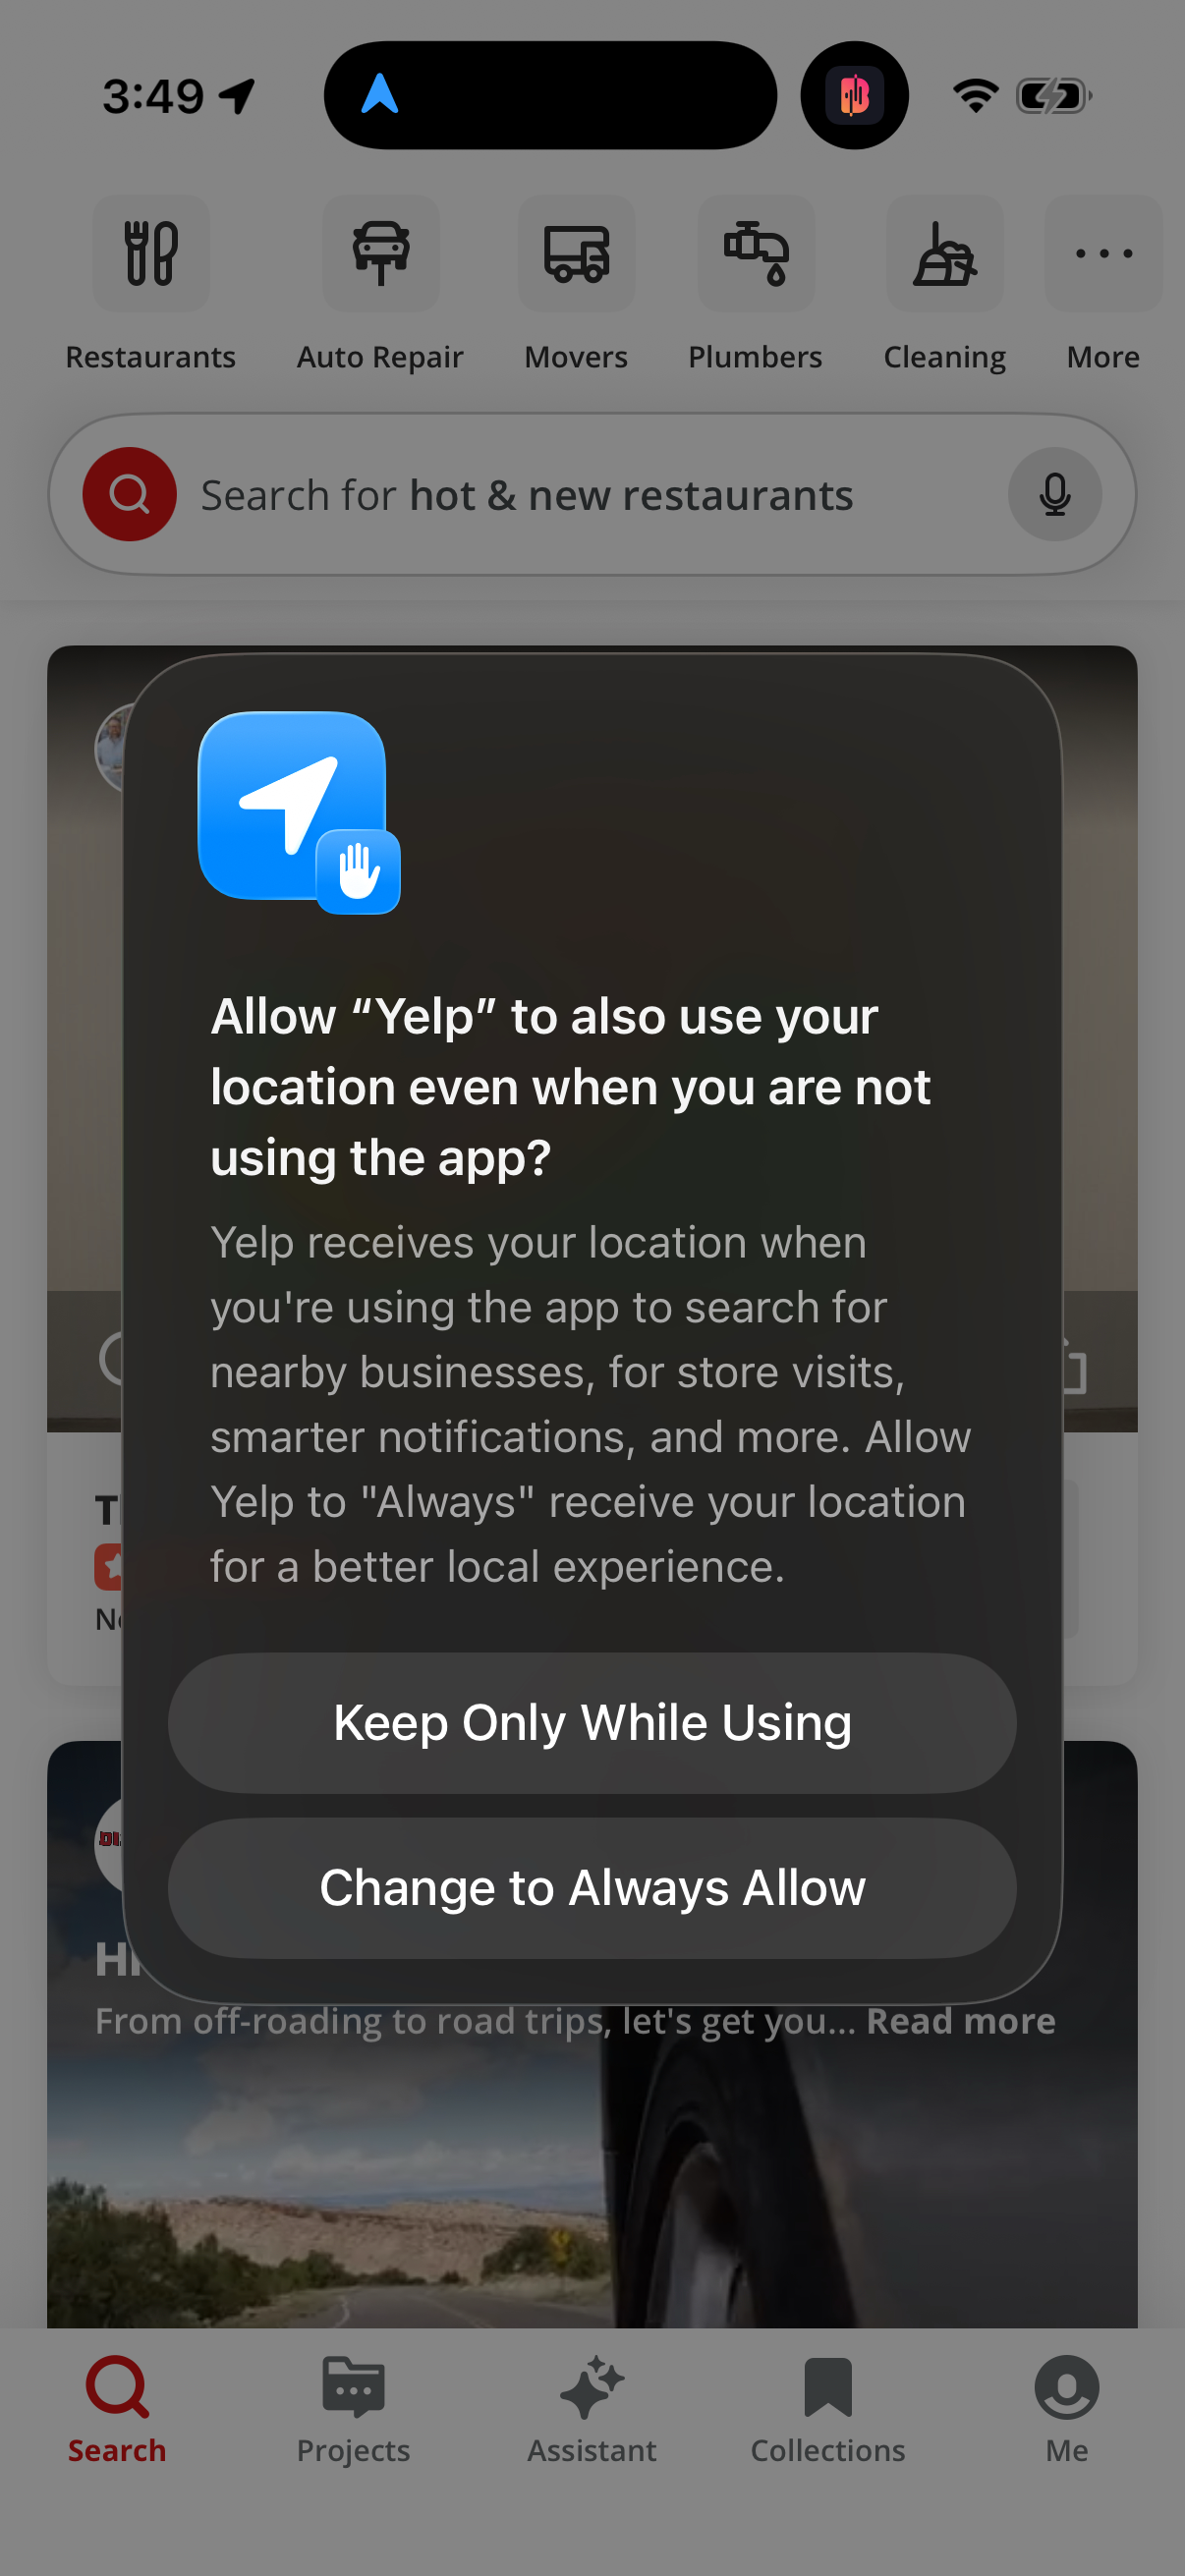
Yelp1206 × 2622opens the full image 
Faceapp1206 × 2622opens the full image 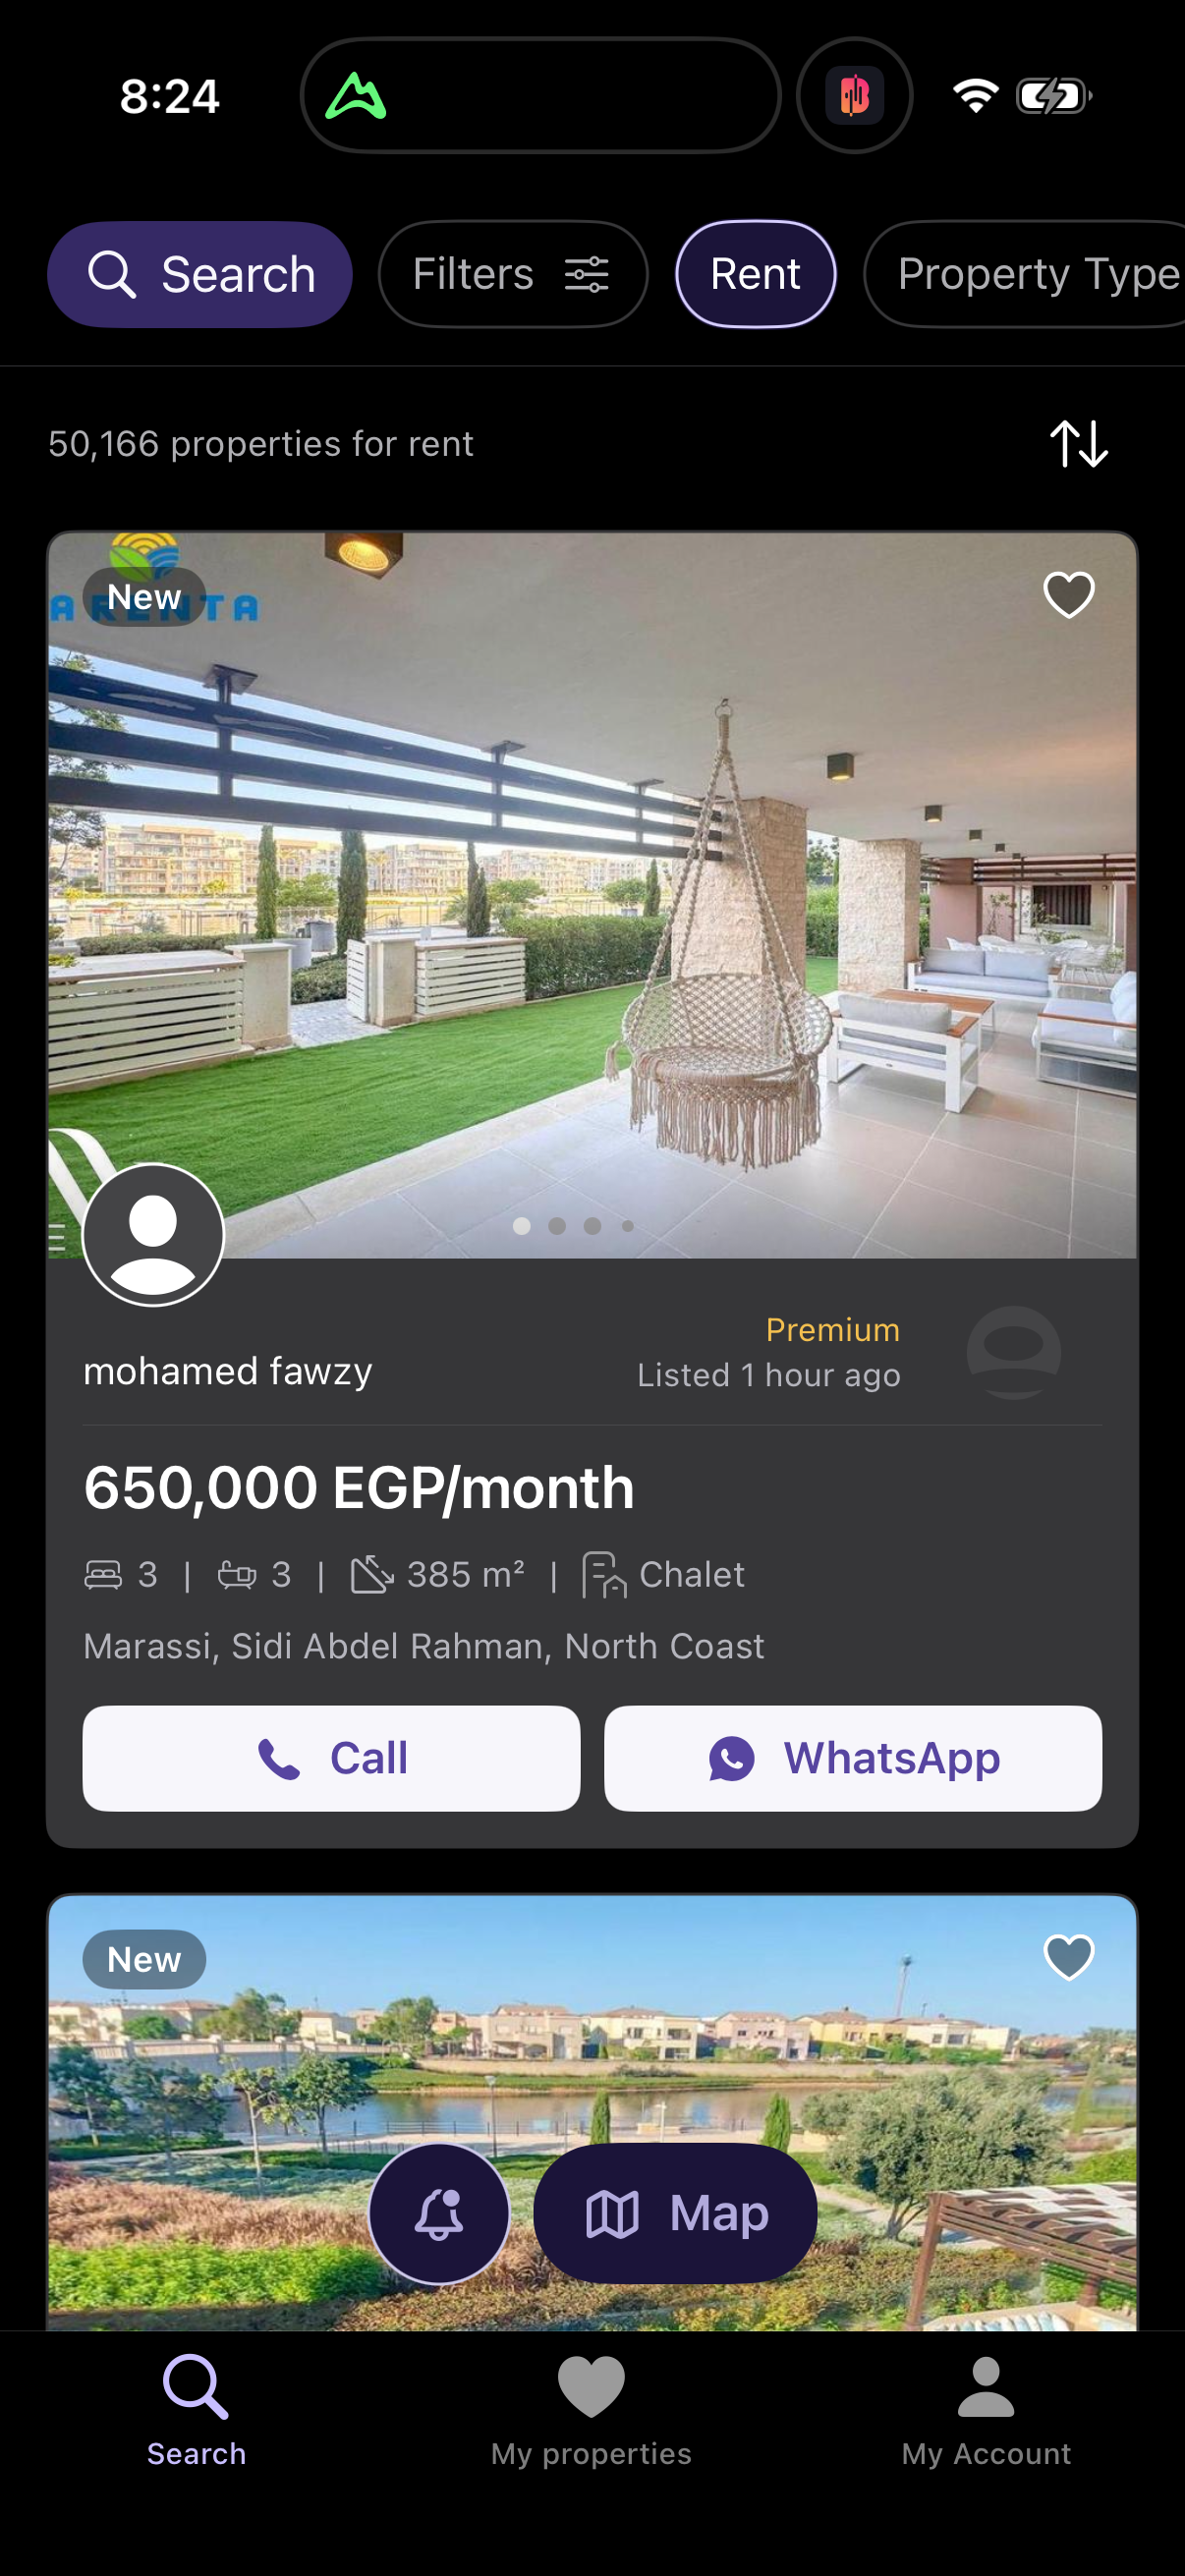
Property Finder1206 × 2622opens the full image 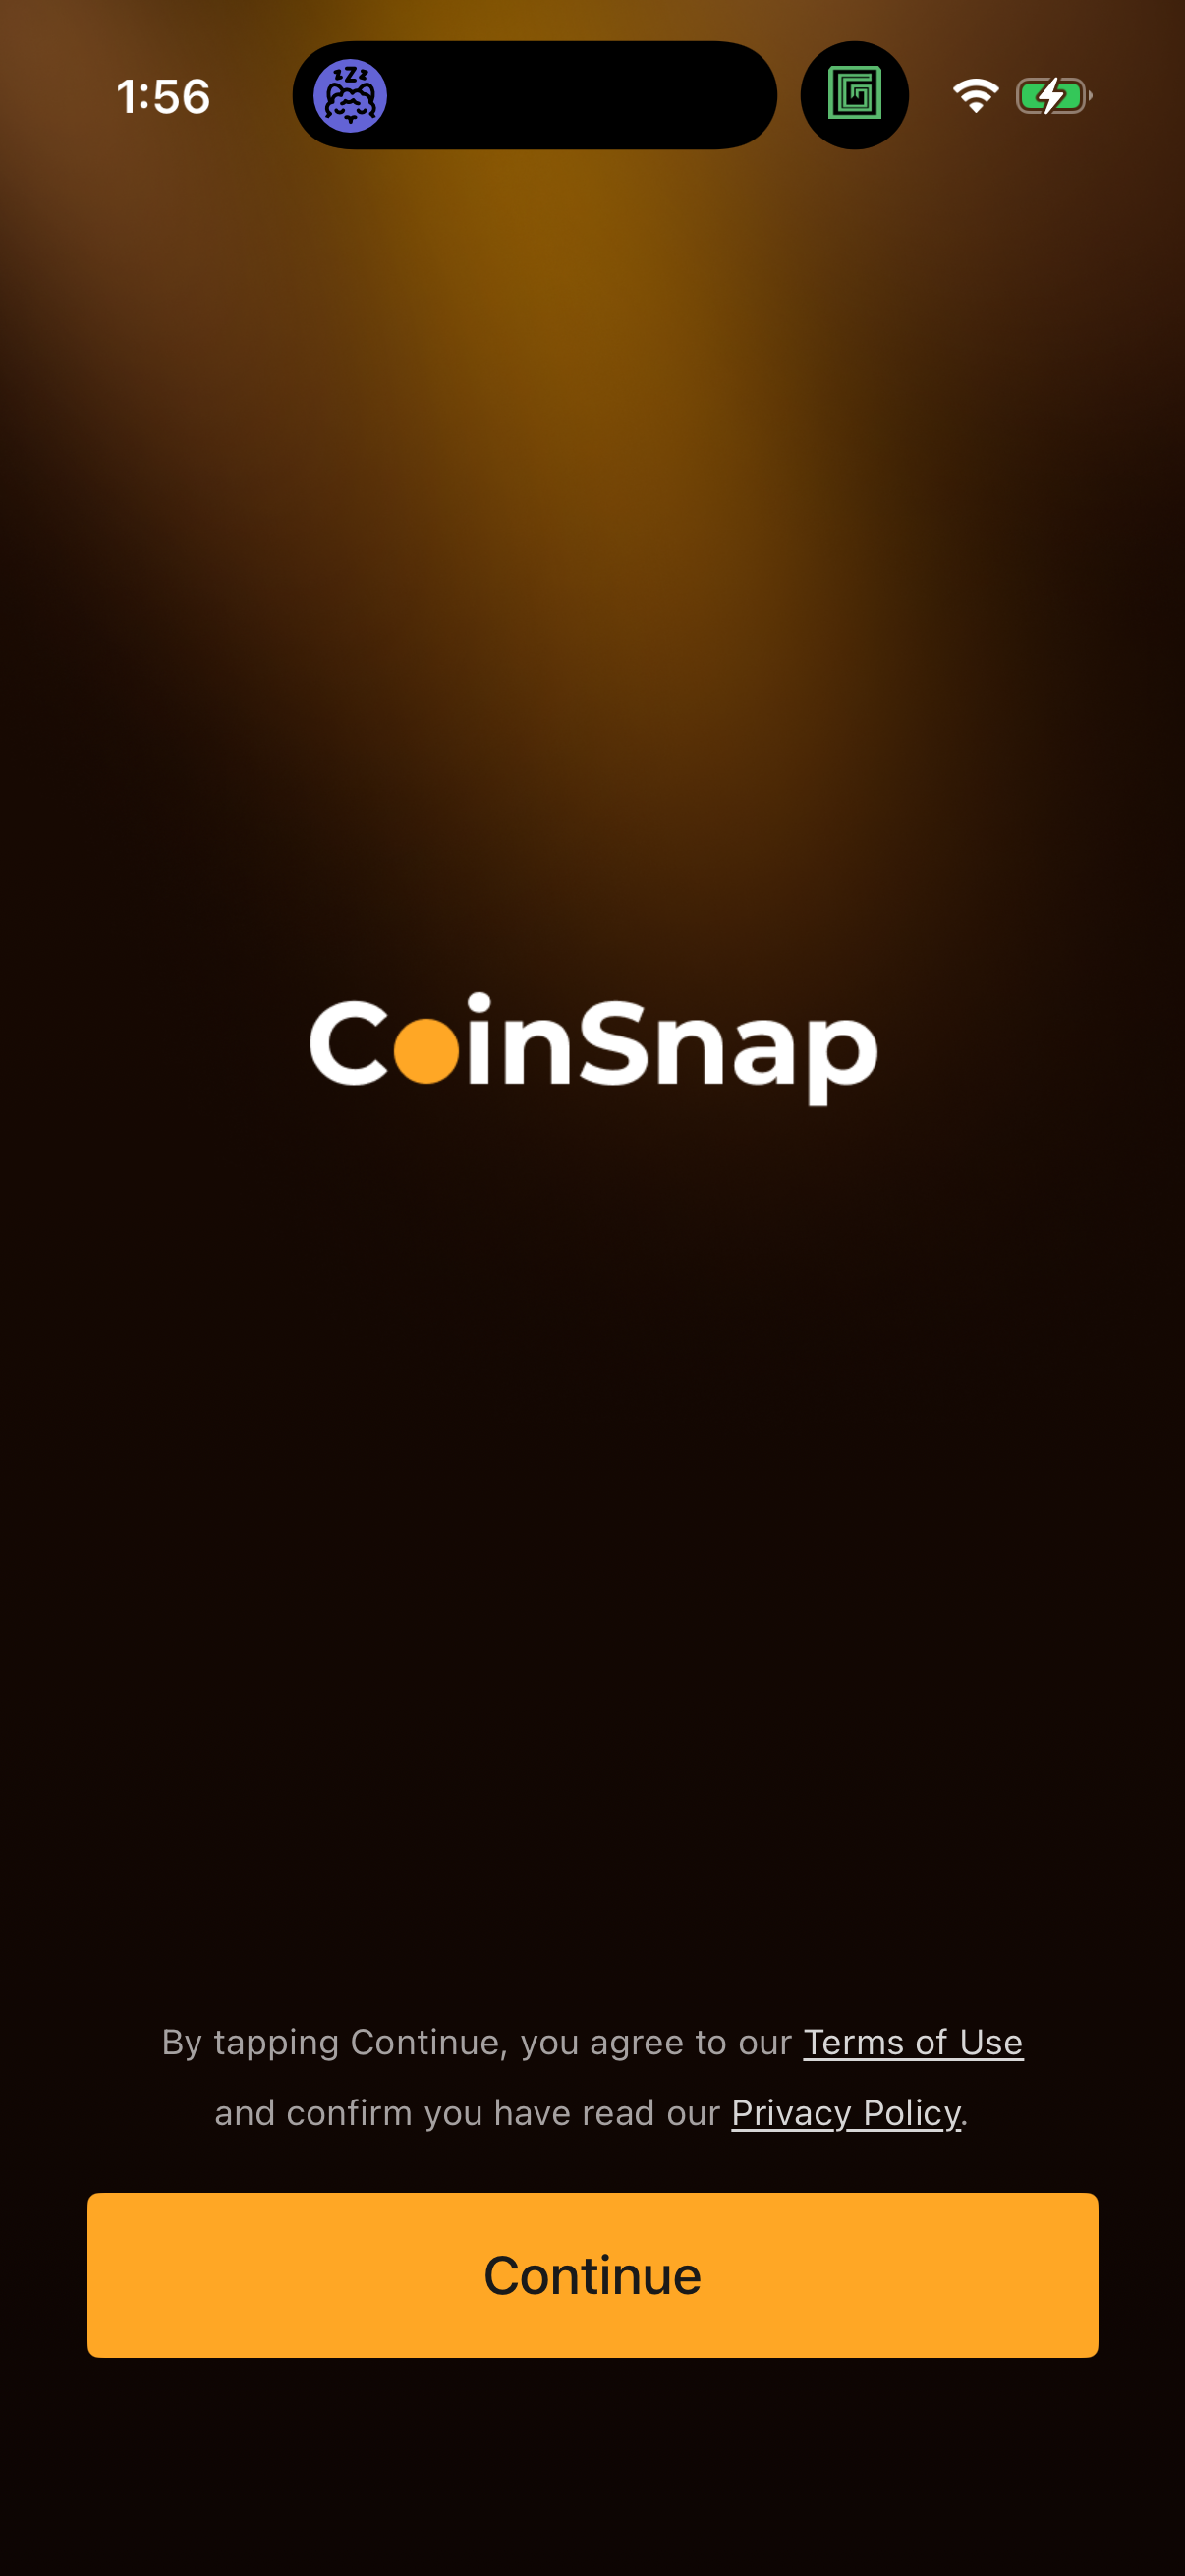
Coinsnap1206 × 2622opens the full image
The numbers
| # | Stat | Computed from |
|---|---|---|
| [1] | 5.1% (2023, 15/293) -> 12.5% (2024, 50/399) -> 10.1% (2025, 74/730) | countdown_timer_prevalence_over_time |
| [2] | 2026 partial reads 0.3% (2 apps) - thin-capture artifact, not a real collapse | countdown_timer_prevalence_over_time / smallSampleWarnings |
| [3] | 'countdown timer' reaches 19 distinct companies; 'countdown timer offer' 14 | tag_vocabulary |
| [4] | Capture cadence uneven; trends normalized to companies captured per year | capture_cadence_note |
Methodology
Universe: 47,578 capture-dated screenshots across 809 tracked mobile apps. Method: for each capture year, share of distinct companies whose screens carry a countdown-timer tag. Reliable window 2023-2025; partial-2026 excluded. Caveat: tag-matched prevalence is a lower bound.
Sources
- [1]
Lazyweb Research analysis of 809 tracked apps (mobile-app corpus, 47,578 capture-dated screenshots), July 2026
Prevalence = share of companies captured each year whose screens carry a `%countdown%` tag, deduped by company_name.
- [2]
Lazyweb Research analysis of 809 tracked apps (mobile-app corpus, 47,578 capture-dated screenshots), July 2026
2026 captures run only through Jul 4 with thin tagging; the 0.3% reading is flagged as an artifact.
Source: Lazyweb Research — proprietary analysis of real, in-market app screens. Cite as Lazyweb Research, 2026-07-07.