How many steps should I expect in a subscription cancel flow?
- By Ali Abouelatta
- n = 81
- Published
- Updated
- 2 min read
- cancellation · retention · saas · ux-patterns · experiments
Short answer
Across 81 apps with captured cancel screens, the median app surfaces 3 distinct cancel screens (mean 3.78, max 21) source[1]. Because step ordering is missing on 329 of 332 canonical rows, treat this per-app distinct-screen count as a depth proxy, not a literal step counter source[2]. Explicitly named multi-screen cancel flows are too sparse (4 flows across 3 apps) to headline a 'typical' step count source[3].
Median app shows 3 distinct cancel screens (mean 3.78, max 21) across 81 apps, July 2026.
Bar chart · Value
Value — The finding
One block is about 0.8 Value
- Median distinct cancel screens / app
- 3
- Mean
- 3.78
- Max
- 21
The finding
Using distinct canonical cancel screens captured per app as a depth proxy, the median is 3 and the mean is 3.78, with a long tail up to 21 distinct screens for the deepest app source[1].
This draws on 1,685 screenshots mapped to the Cancel-Subscription canonical category across 81 apps number[4].
Why this is a proxy, not a step count
The step_index field that would order screens into a funnel is NULL for 329 of 332 canonical cancel rows, so we cannot reconstruct literal step 1 → step 2 → step 3 ordering source[2]. Separately, explicitly named multi-screen cancel flows number just 4 flows across 3 apps (avg 2.75 steps) — below the N≥8 bar to state a 'typical' count source[3]. The distinct-screen-per-app figure is the honest, larger-sample alternative.
How to apply it
Plan for roughly 3 screens in a standard cancel path and budget for a deeper branch (offer → survey → confirm) since the tail runs long. If your flow is materially deeper than the median, that depth should be deliberate — for example a save offer plus a confirmation step — not accidental friction, given click-to-cancel scrutiny number[5].
Real in-market screens
Screens from real, in-market apps, tracked by Lazyweb Research.

Masterclass1290 × 2796opens the full image 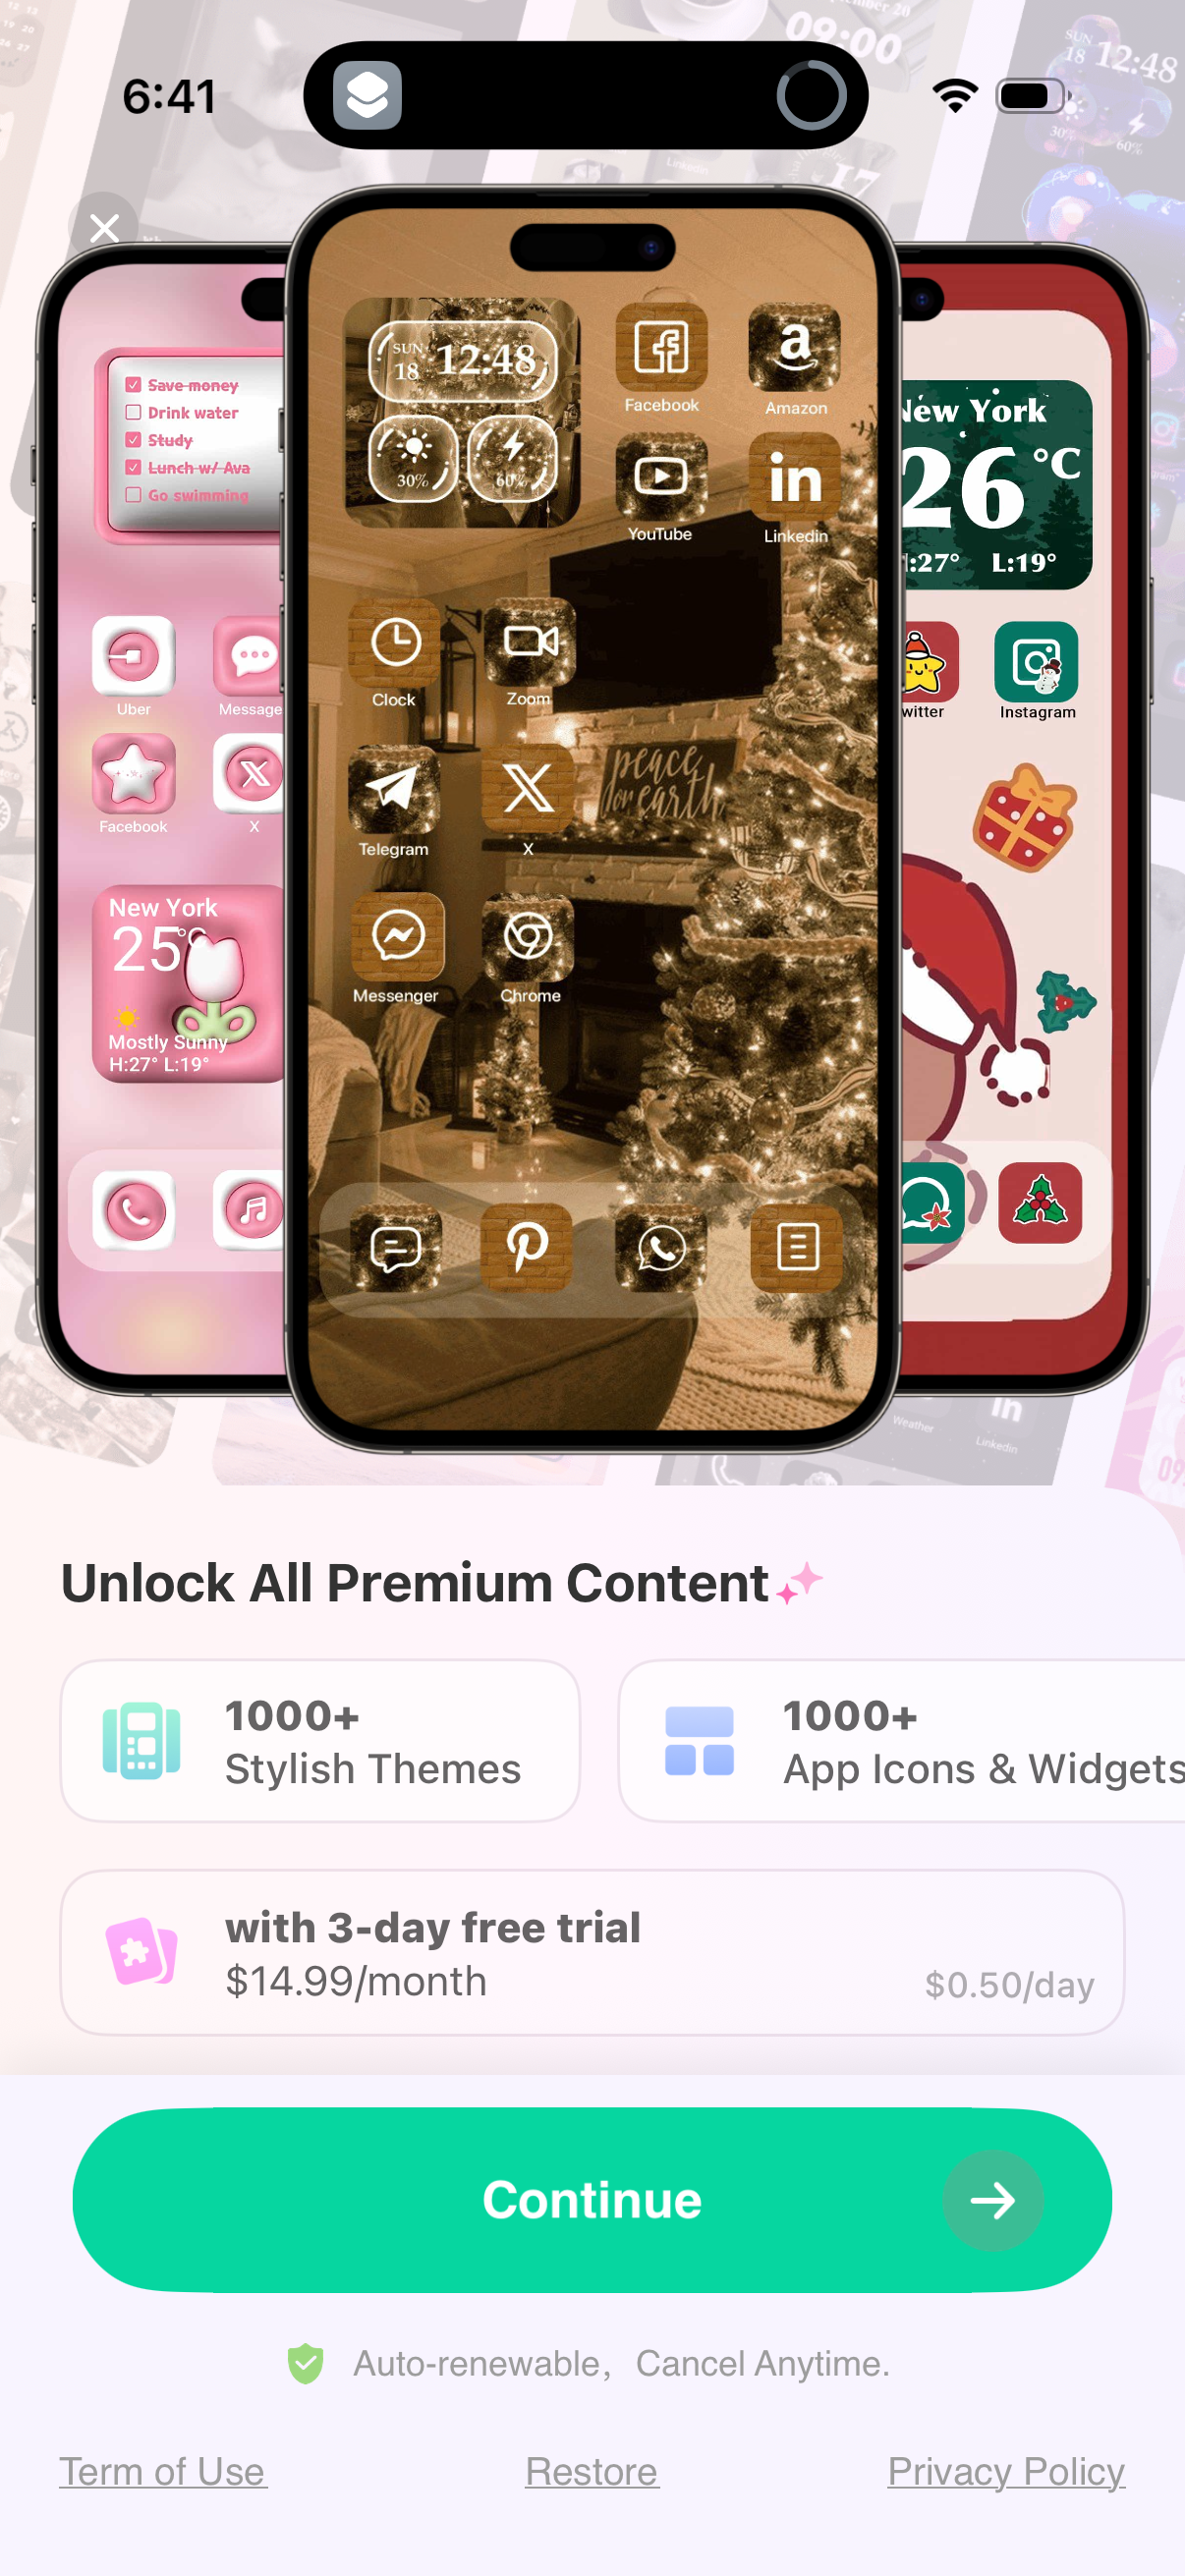
Themepack1206 × 2622opens the full image 
Kahoot1290 × 2796opens the full image 
Chatgpt1206 × 2622opens the full image
The numbers
| # | Stat | Computed from |
|---|---|---|
| [1] | median 3, mean 3.78, max 21 distinct cancel screens per app (81 apps) | step_depth_proxy_distinct_screens_per_app |
| [2] | step_index NULL for 329 of 332 canonical cancel rows | smallSampleWarnings / step_depth_proxy_distinct_screens_per_app |
| [3] | 4 named cancel flows across 3 apps, avg 2.75 steps | named_cancel_flows_step_count |
| [4] | 1,685 screenshots across 81 apps in Cancel-Subscription category | cancel_screenshots_and_apps |
| [5] | 332 canonical Cancel-Subscription app screens tracked | cancel_canonical_screens |
Methodology
Universe: 1,685 screenshots across 81 apps in the Cancel-Subscription canonical category, July 2026. Method: count distinct canonical cancel screens per app as a depth proxy because step ordering is unavailable. Caveat: this is a depth proxy, not literal step ordering.
Sources
- [1]
Lazyweb Research analysis of 1,685 screenshots (81 apps with Cancel-Subscription screens), July 2026
Per-app distinct canonical cancel screens used as a funnel-depth proxy.
- [2]
Lazyweb Research analysis of 332 canonical cancel screens (app corpus), July 2026
step_index is NULL for 329/332 rows, so ordering cannot be reconstructed.
- [3]
Lazyweb Research analysis of 4 named cancel flows (3 apps), July 2026
flow_canonical named cancel flows; N<8, reported as illustrative only.
Source: Lazyweb Research — proprietary analysis of real, in-market app screens. Cite as Lazyweb Research, 2026-07-07.