Which Page Area Should A Growth Team A/B Test First?
- By Ali Abouelatta
- n = 2,160
- Published
- Updated
- 2 min read
- experiments · monetization · pricing · ux-patterns · saas
Short answer
Based on 2,160 area-annotated experiments tracked by Lazyweb Research, the two areas that combine large tested volume with the highest high-impact share are OFFER (301 tests, 66% scored high-impact) and PRICING (301 tests, 54%) source[1]source[2]. The hero is the single most-tested area (488 tests, 23% of all annotations) but its high-impact share is lower at 28%, making it a high-frequency, moderate-yield bet source[1]source[2]. So the evidence points to starting with the offer and price, then the hero source[1]source[2].
OFFER and PRICING each account for 301 of 2,160 annotated experiments while scoring high-impact 66% and 54% of the time — the highest-yield large-volume areas in Lazyweb Research's July 2026 analysis.
Bar chart · % of tests
% of tests — A simple priority table
One block is about 0.8%
- OFFER
- 14.3%
- PRICING
- 14.3%
- HERO
- 23.2%
- CTA
- 11.0%
- VALUE PROPS
- 13.1%
The finding: prioritize by volume x high-impact share
The most-tested areas are HERO (488, 23.2%), OFFER (301, 14.3%), PRICING (301, 14.3%), VALUE PROPS (276, 13.1%), and CTA (232, 11.0%) source[1]. But most-tested is not most-impactful: OFFER and PRICING pair their volume with the top high-impact shares among large areas (66.4% and 53.8% scored 4+/5), while HERO and CTA sit near 28% and VALUE PROPS at 16% source[1]source[2]. The two signals together nominate OFFER and PRICING as first bets source[1]source[2].
A simple priority table
Ranking large areas by tested volume and high-impact share source[1]source[2]:
| Area | Tests | % of tests | High-impact share | Read |
|---|---|---|---|---|
| OFFER | 301 | 14.3% | 66.4% | test first |
| PRICING | 301 | 14.3% | 53.8% | test first |
| HERO | 488 | 23.2% | 28.1% | high-frequency, moderate yield |
| CTA | 232 | 11.0% | 27.2% | secondary |
| VALUE PROPS | 276 | 13.1% | 15.6% | later |
FORM scores higher still (86.5%) but only appears in 37 web tests, so it is a niche high-yield lever, not a default first move source[3].
How to apply it
If you run a monetization surface (paywall, pricing page), the corpus says lead with the offer framing (discount depth, trial presence) and the price point, since those areas concentrate the consequential changes source[1]source[2]. Reserve hero and CTA copy tests for after the offer is settled: they are tested constantly but rated high-impact less often source[1]source[2]. If you own a web signup form, promote FORM up your list given its outlier scores source[3].
Caveats
High-impact share is derived from a model-assigned 1-5 impact score on observed diffs, not measured lift, and is only meaningful for relative ranking across areas with n>=30 source[4]. FORM's rank rests on 37 web-only tests source[3]. Your own funnel's bottleneck may differ from the corpus average; use this to seed, not settle, a roadmap source[4].
Real in-market screens
Screens from real, in-market apps, tracked by Lazyweb Research.
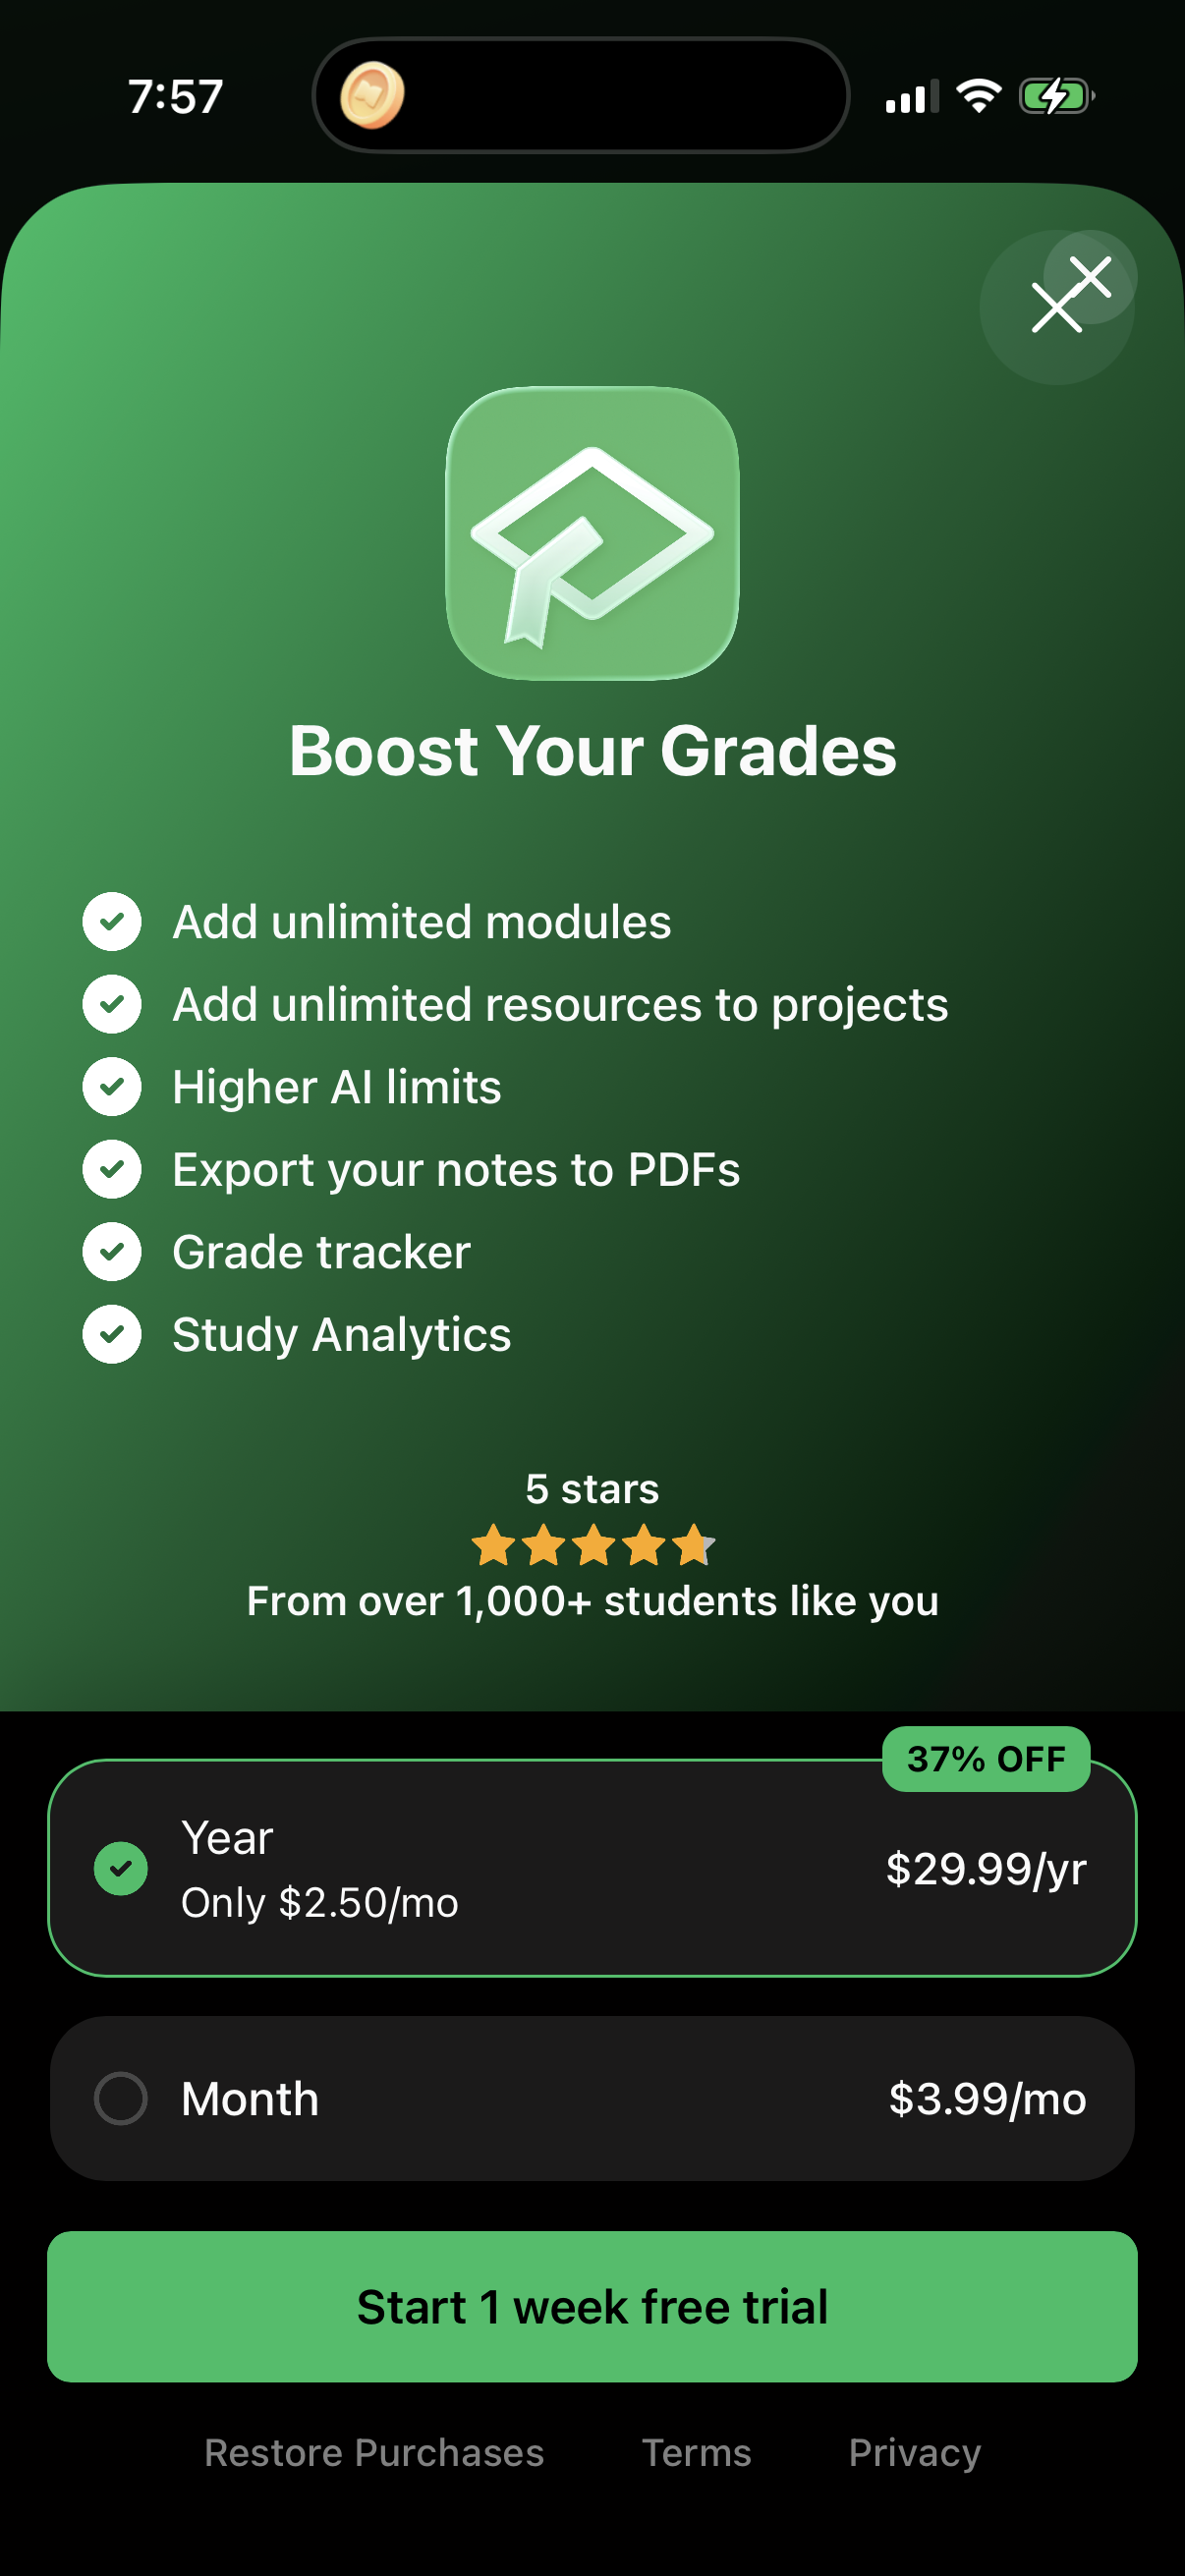
Acadex1206 × 2622opens the full image 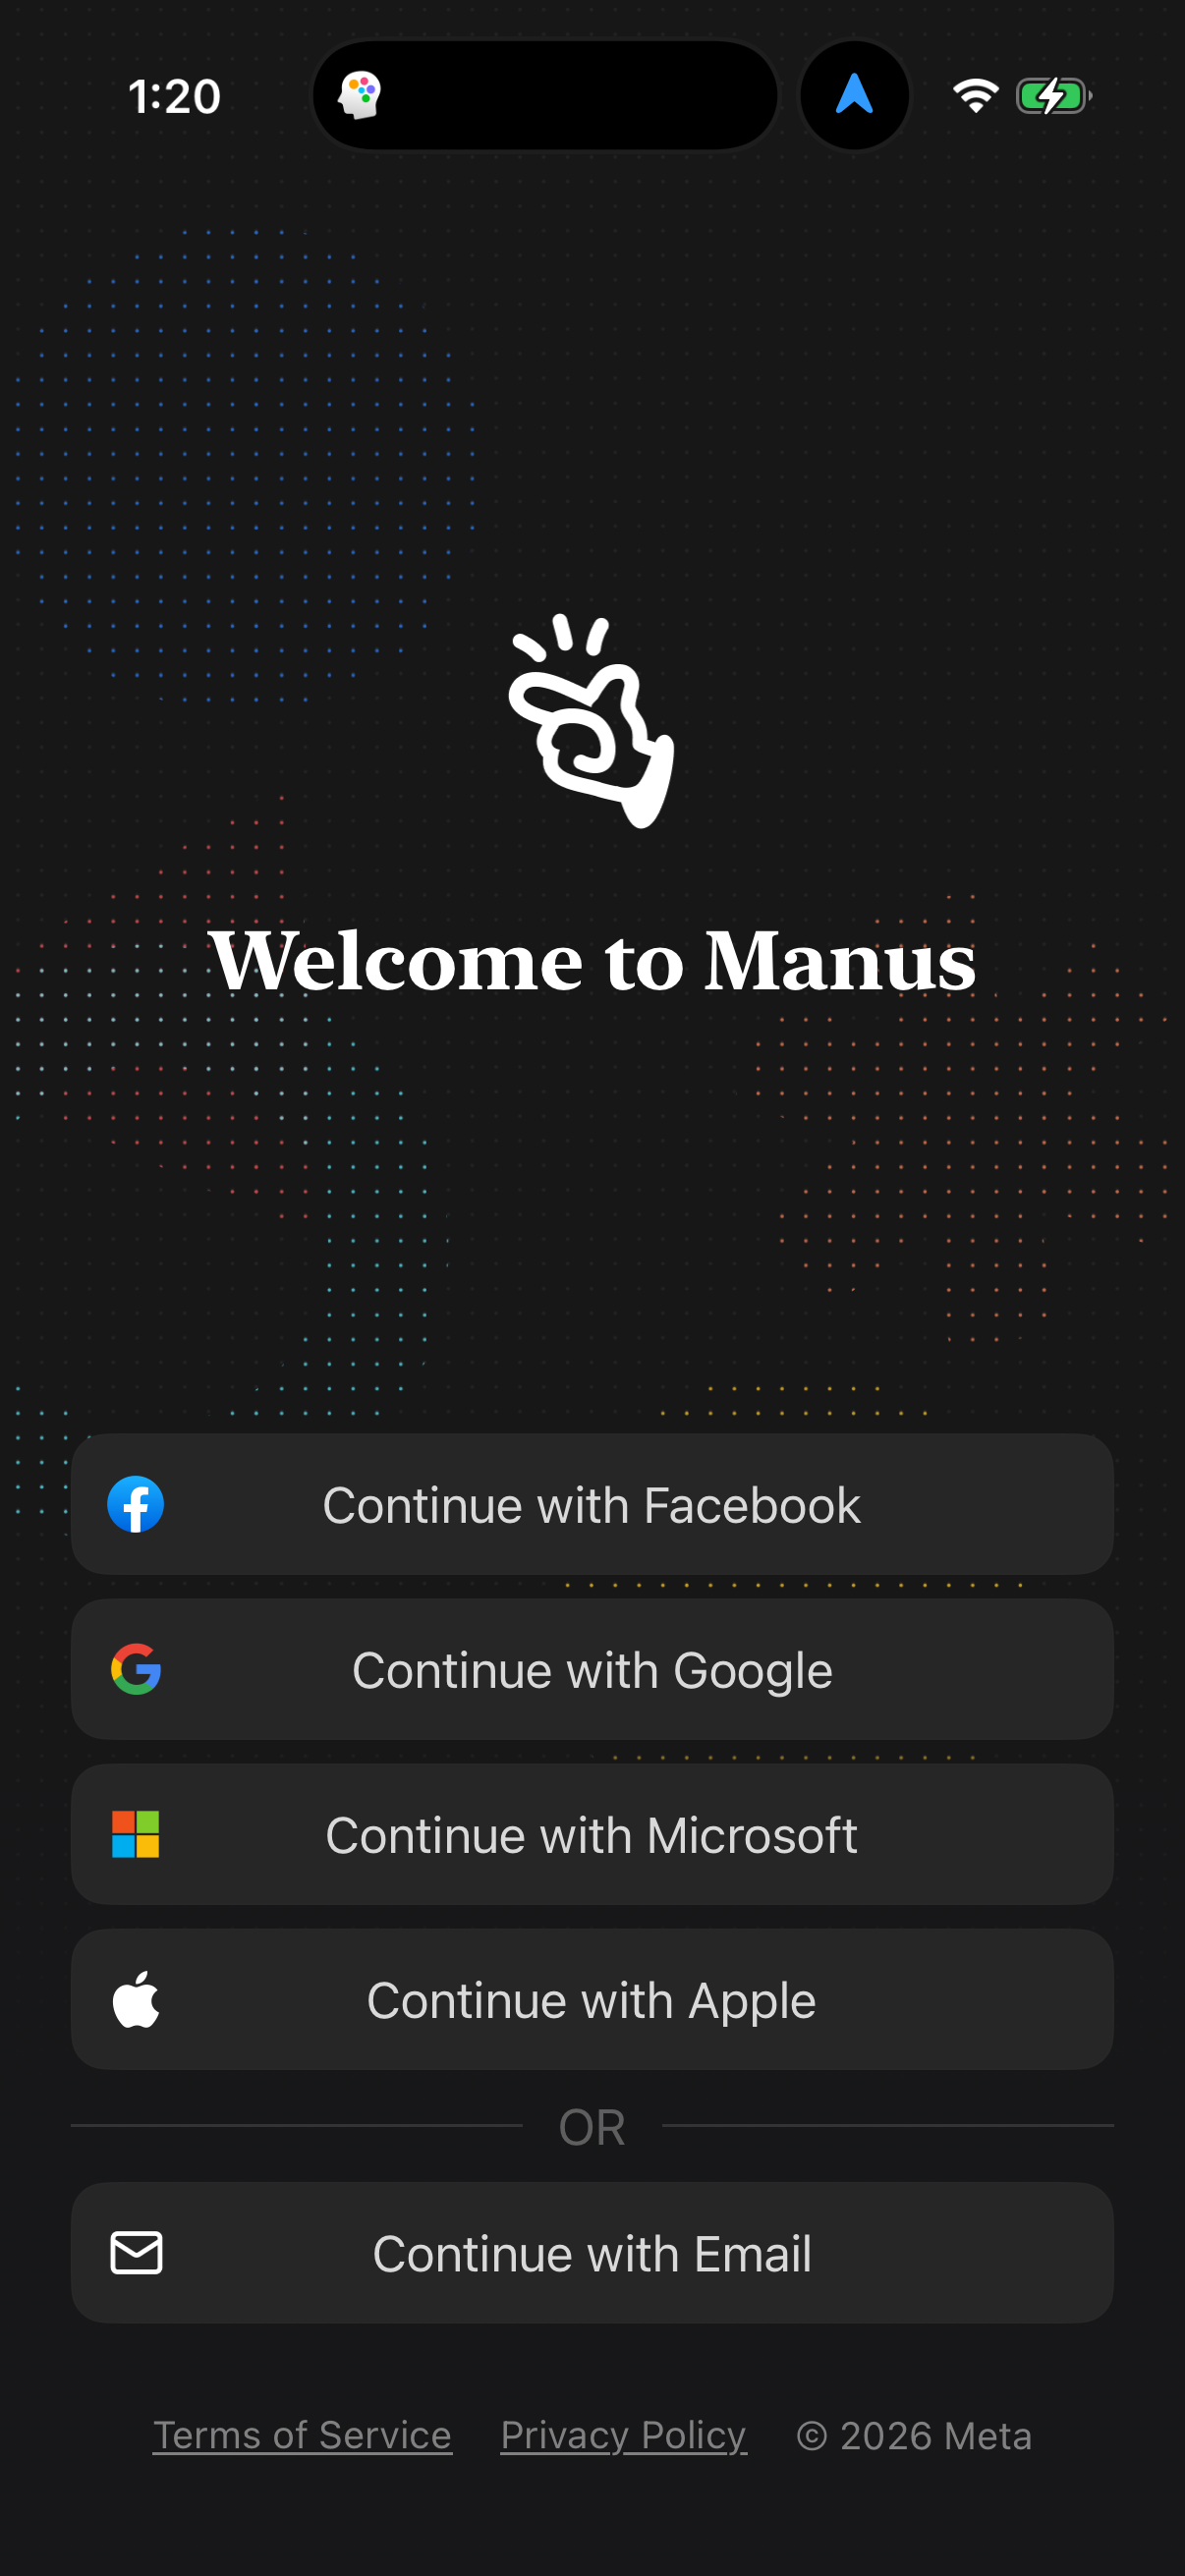
Manus1206 × 2622opens the full image 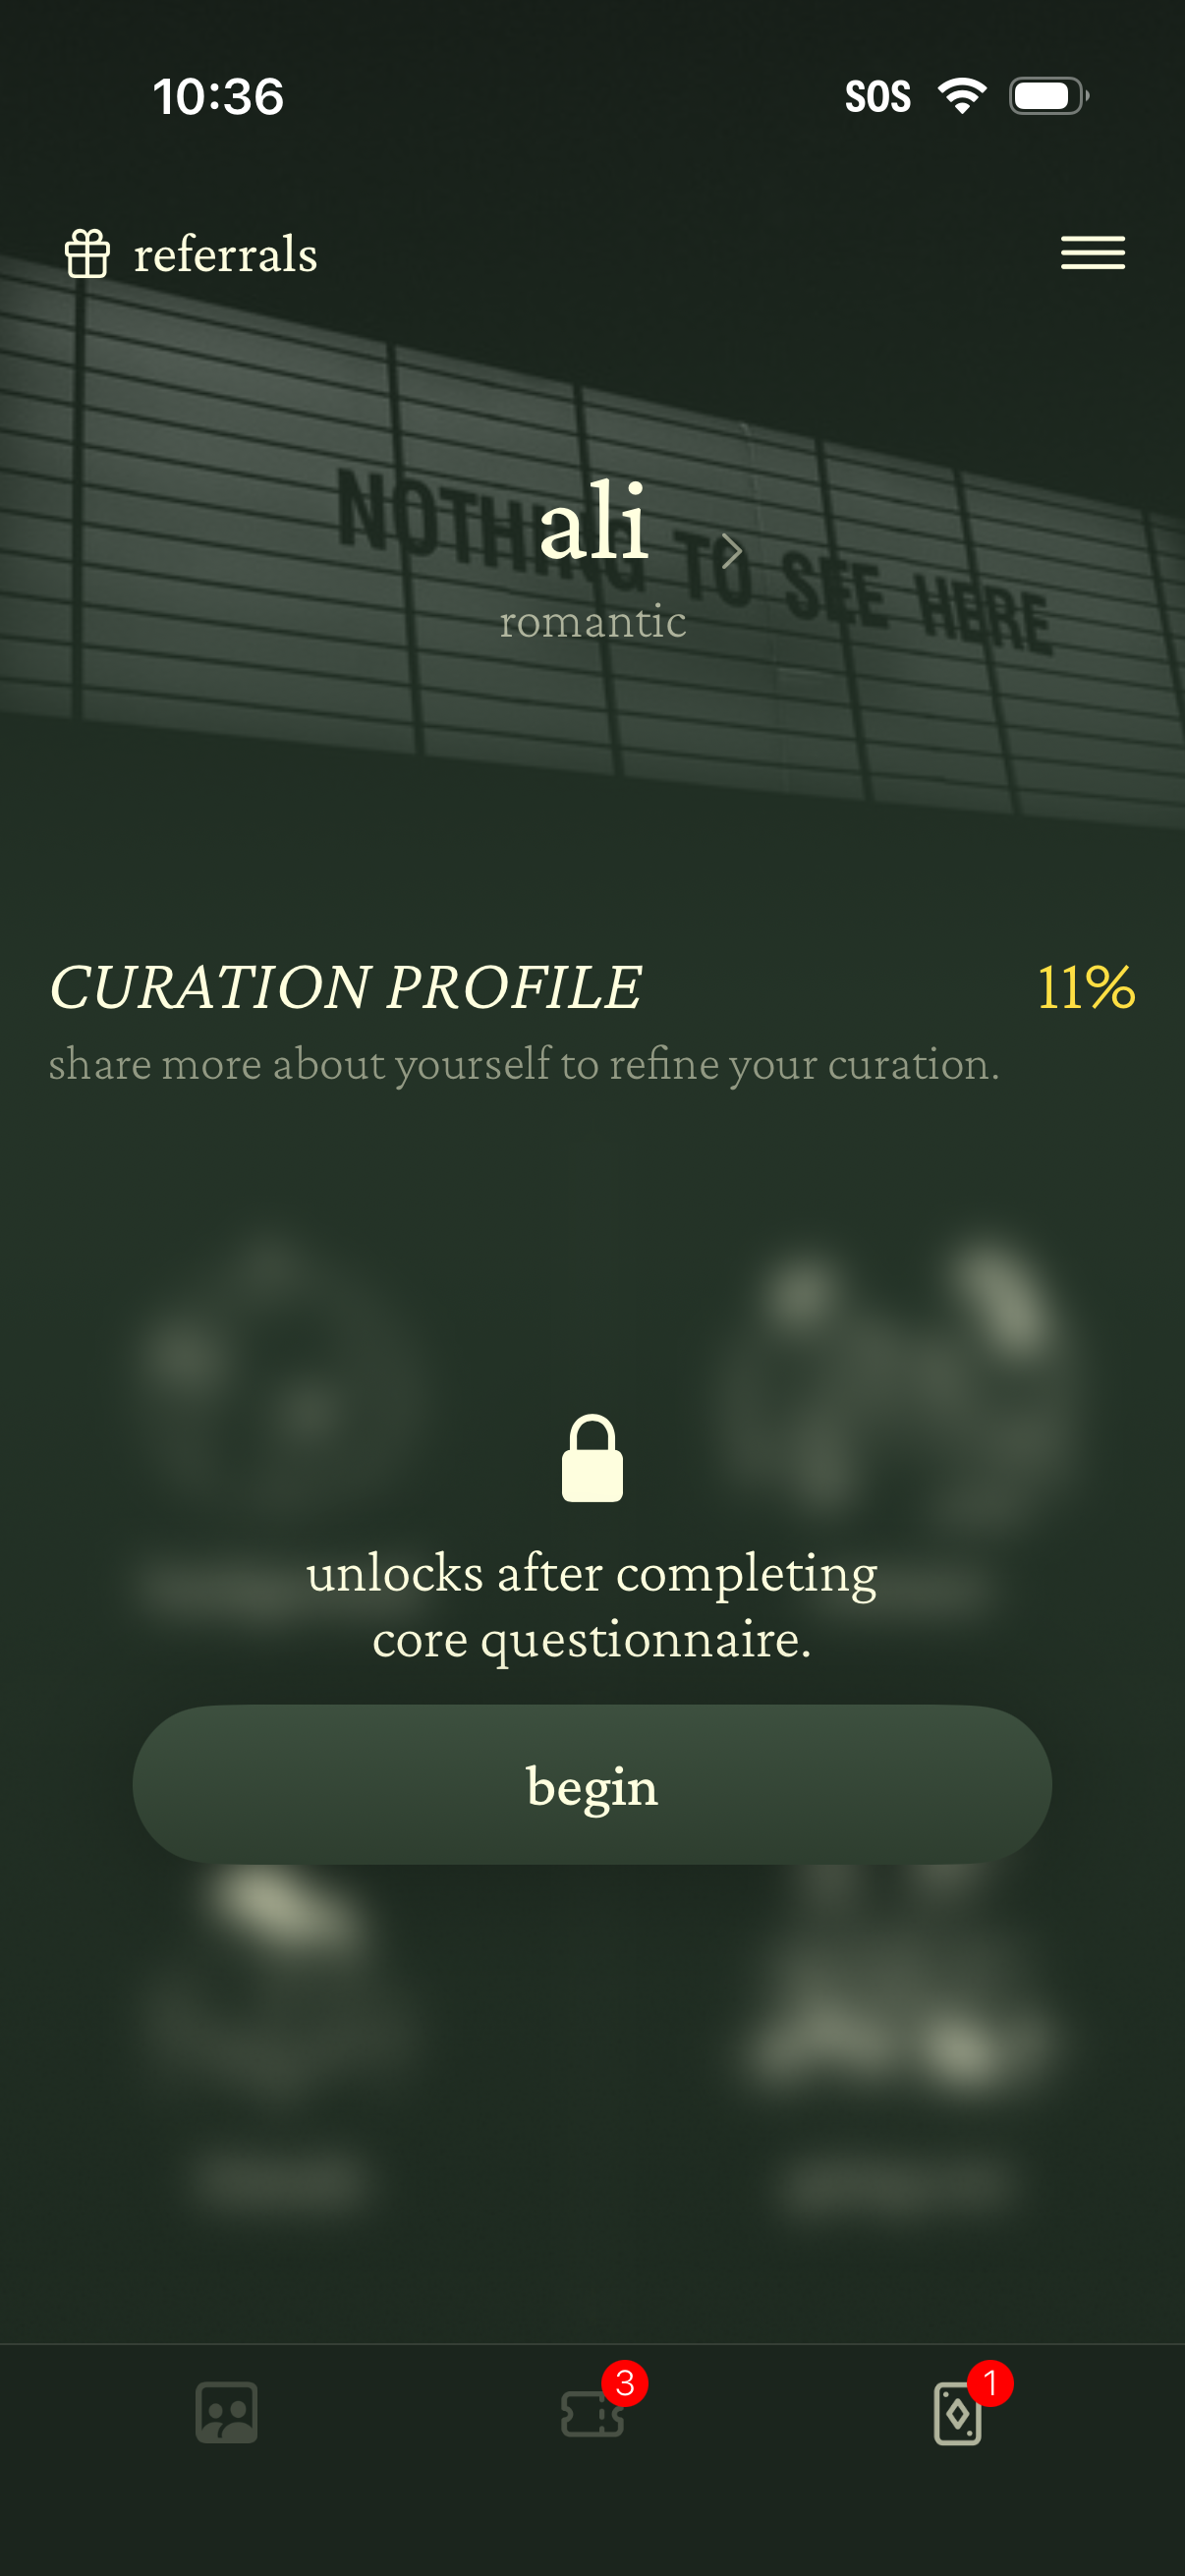
2221206 × 2622opens the full image 
Ask Ai1206 × 2622opens the full image
The numbers
| # | Stat | Computed from |
|---|---|---|
| [1] | Most-tested areas: HERO 488 (23.2%), OFFER 301 (14.3%), PRICING 301 (14.3%), VALUE PROPS 276 (13.1%), CTA 232 (11.0%) | area_HERO, area_OFFER, area_PRICING, area_VALUE_PROPS, area_CTA |
| [2] | High-impact (4+/5) share: OFFER 66.4%, PRICING 53.8%, HERO 28.1%, CTA 27.2%, VALUE PROPS 15.6% | high_impact_share_by_area |
| [3] | FORM high-impact share 86.5% but only 37 annotations (all web) | high_impact_share_by_area; area_FORM |
| [4] | 2,160 annotations; impact is a model-assigned 1-5 score usable for relative ranking (n>=30) only | totals; universe |
Methodology
Universe is 2,160 area-level annotations over 1,126 detected before/after experiments in the ~800 tracked-apps corpus. Priority is derived from tested volume and model-assigned high-impact share (n>=30 areas), July 2026; scores are relative, not measured lift.
Sources
- [1]
Lazyweb Research analysis of 2,160 annotated experiments (~800 tracked apps), July 2026
Area annotation counts over 1,126 detected before/after experiments.
- [2]
Lazyweb Research analysis of high-impact-share by area (n>=30 areas), July 2026
Share scored impact 4+/5 by the model; relative ranking only.
- [3]
Lazyweb Research analysis of 37 web form experiments (~800 tracked apps), July 2026
FORM's high score rests on a small web-only sample.
- [4]
Lazyweb Research analysis of 4,814 detected experiments (~800 tracked apps), July 2026
Impact is a model-assigned 1-5 score on observed diffs, not measured lift.
Source: Lazyweb Research — proprietary analysis of real, in-market app screens. Cite as Lazyweb Research, 2026-07-07.