Which Experiment Areas Look Highest-Impact in Detected A/B Tests?
- By Ali Abouelatta
- n = 2,160
- Published
- Updated
- 2 min read
- experiments · monetization · pricing · ux-patterns · paywall · design
Short answer
Across 2,160 area annotations Lazyweb Research scored in July 2026, offer carries the highest average model-assigned impact among high-volume areas at 3.69/5, followed by pricing at 3.53 and hero at 3.28. When you rank by the share of tests scored 4+/5, form (86.5%) and offer (66.4%) lead — but form rests on just 37 web annotations. The most-tested area, hero, sits mid-pack on impact. These are relative model scores on observed diffs, not measured lift. source[1]
Offer has the highest average model-scored impact of any high-volume area at 3.69/5, with 66.4% of its tests scored 4+/5 — Lazyweb Research, 301 annotations, July 2026.
Bar chart · Share 4+/5
Share 4+/5 — Impact by area
One block is about 3.1%
- Form (web)
- 86.5% [3]
- Offer
- 66.4% [4]
- Pricing
- 53.8% [5]
- Hero
- 28.1% [6]
- CTA
- 27.2% [7]
- Value props
- 15.6% [8]
- Nav
- 8.3% [9]
Impact by area
Ranking the areas with n≥30 annotations by the share scored 4+/5 (model-assigned 1–5, relative ranking only): source[2]
The pattern: money-adjacent surfaces (offer, pricing) score highest; layout/navigation surfaces (nav, announcement bar) score lowest. The most-tested area — hero — is only mid-pack, meaning teams test it heavily but the model rarely flags those changes as high-leverage. source[6]
How to apply it
If you're choosing where to spend a scarce experiment slot, the offer and pricing rows are the field's strongest signal that changes to the deal and the price move the needle most often. Form scores highest of all, but its 37 annotations are all web sign-up flows — treat it as 'when you have a form, the form matters,' not a mandate to add one. Nav and announcement-bar changes are common but rarely high-leverage, so reserve them for polish rather than headline bets.
Caveats
Impact is an LLM-assigned 1–5 score on a detected UI diff, usable only for relative ranking with n≥30 — never read it as a measured conversion lift. source[10] Form (n=37) and the n≥30 threshold mean small-area rankings are noisier than the offer/pricing/hero rows. HEADER (n=29) falls below threshold and is excluded.
Real in-market screens
Screens from real, in-market apps, tracked by Lazyweb Research.

Speechify1206 × 2622opens the full image 
Themify1125 × 2436opens the full image 
Taco Bell1206 × 2622opens the full image 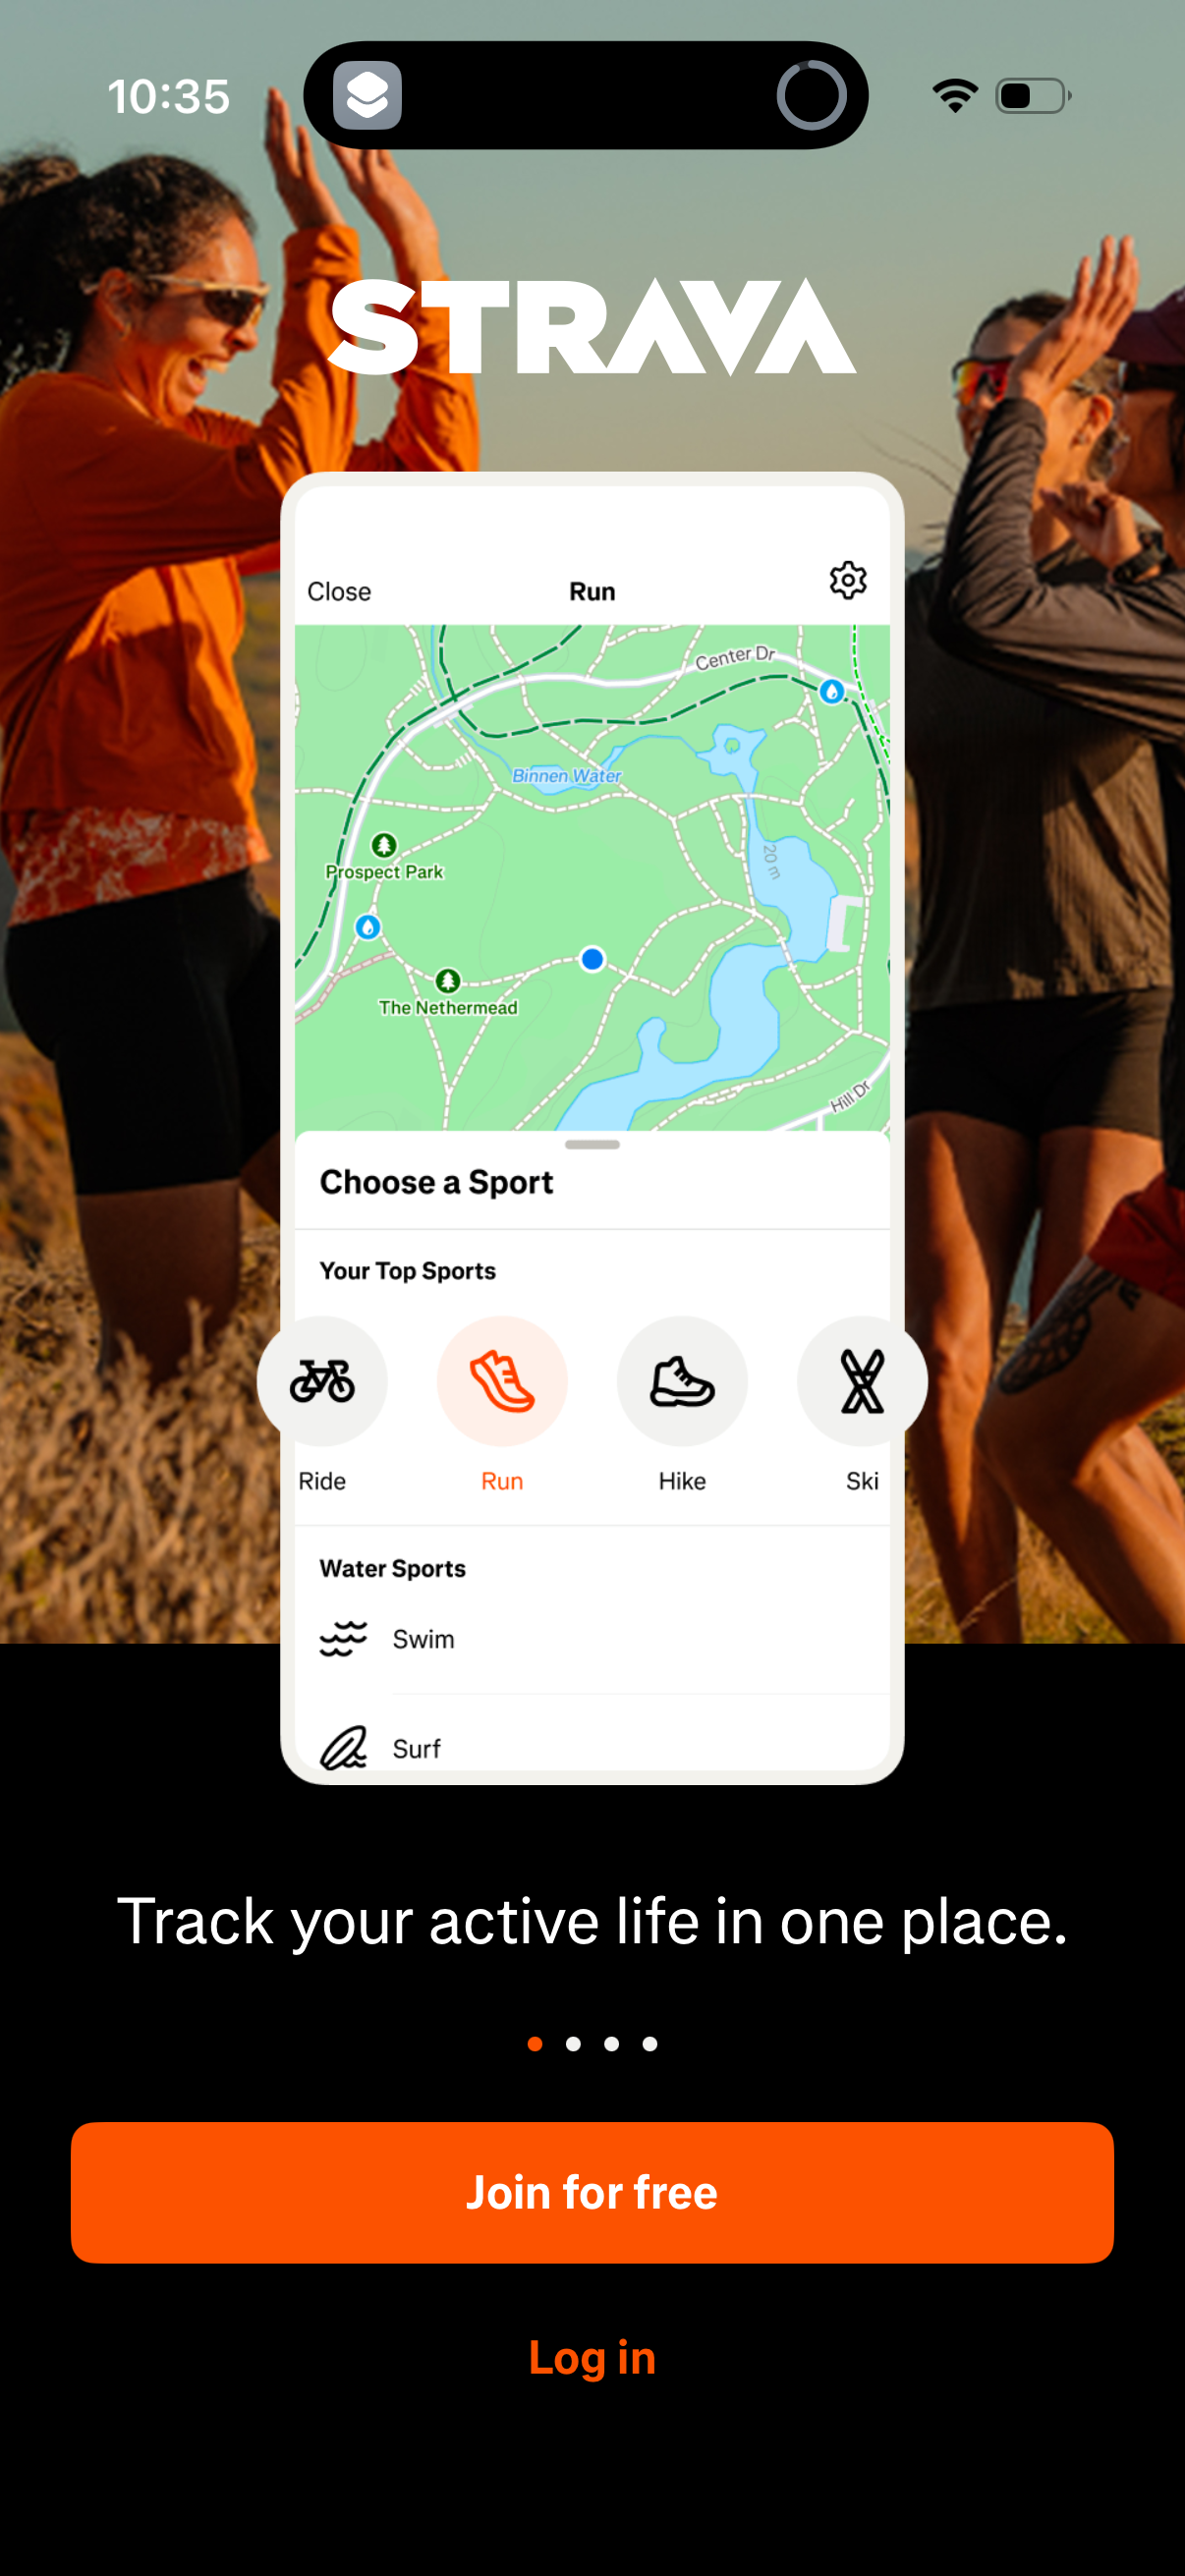
Strava1206 × 2622opens the full image
The numbers
| # | Stat | Computed from |
|---|---|---|
| [1] | 2,160 area annotations scored 1–5 for impact, July 2026 | statpack primaryN + high_impact_share_by_area |
| [2] | Impact-4+ share ranking, n≥30 areas only | statpack high_impact_share_by_area |
| [3] | Form: n=37, avg impact 3.84, 86.5% scored 4+ (32/37) | statpack area_FORM + high_impact_share_by_area |
| [4] | Offer: n=301, avg impact 3.69, 66.4% scored 4+ (200/301) | statpack area_OFFER + high_impact_share_by_area |
| [5] | Pricing: n=301, avg impact 3.53, 53.8% scored 4+ (162/301) | statpack area_PRICING + high_impact_share_by_area |
| [6] | Hero: n=488, avg impact 3.28, 28.1% scored 4+ (137/488) | statpack area_HERO + high_impact_share_by_area |
| [7] | CTA: n=232, avg impact 3.16, 27.2% scored 4+ (63/232) | statpack area_CTA + high_impact_share_by_area |
| [8] | Value props: n=276, avg impact 3.03, 15.6% scored 4+ (43/276) | statpack area_VALUE_PROPS + high_impact_share_by_area |
| [9] | Nav: n=144, avg impact 2.74, 8.3% scored 4+ (12/144) | statpack area_NAV + high_impact_share_by_area |
| [10] | Impact/confidence are LLM-assigned 1–5 scores for relative ranking only (n≥30), not measured lift; HEADER n=29 excluded | statpack smallSampleWarnings |
Methodology
Universe: 2,160 area annotations across 1,126 detected experiments, July 2026, each scored 1–5 for impact by an LLM from the before/after diff. Rankings restricted to areas with n≥30; scores are relative signal, not measured conversion lift.
Sources
- [1]
Lazyweb Research analysis of 2,160 area annotations (1,126 experiments), July 2026
Impact is a model-assigned 1–5 score on detected UI diffs; rankings use the n≥30 filter.
- [2]
Lazyweb Research analysis of 2,160 area annotations, July 2026
Share of annotations scored impact ≥4/5 per area, n≥30 only.
- [3]
Lazyweb Research analysis of 37 form annotations (web), July 2026
Form: 32 of 37 scored 4+; smallest of the ranked areas, all web.
- [4]
Lazyweb Research analysis of 301 offer annotations, July 2026
Offer: 200 of 301 scored 4+.
- [5]
Lazyweb Research analysis of 301 pricing annotations, July 2026
Pricing: 162 of 301 scored 4+.
- [6]
Lazyweb Research analysis of 488 hero annotations, July 2026
Hero: 137 of 488 scored 4+.
- [7]
- [8]
Lazyweb Research analysis of 276 value-props annotations, July 2026
Value props: 43 of 276 scored 4+.
- [9]
- [10]
Lazyweb Research methodology note, July 2026
Impact/confidence/differentiation are LLM-assigned 1–5 scores usable only for relative rankings with n≥30.
Source: Lazyweb Research — proprietary analysis of real, in-market app screens. Cite as Lazyweb Research, 2026-07-07.