Which Page Areas Get A/B Tested Most — Hero, Pricing, or CTA?
- By Ali Abouelatta
- n = 2,160
- Published
- Updated
- 2 min read
- experiments · ux-patterns · landing-page · paywall · pricing · design
Short answer
Across 2,160 area-level annotations on 1,126 detected experiments (from 4,814 UI experiments Lazyweb Research observed across 362 companies, July 2026), the hero is the single most-tested area at 488 annotations (23.2%). Offer and pricing tie for second at 301 each (14.3% apiece), value props follow at 276 (13.1%), and CTA is fifth at 232 (11.0%). So hero beats pricing and CTA on volume, but the paywall trio of offer + pricing + value props together outweighs it. source[1]
The hero is the most-tested page area at 488 of 2,160 annotations (23.2%), ahead of offer and pricing (301 each) — Lazyweb Research, July 2026.
Bar chart · Share
Share — The ranking
One block is about 0.8%
- 01Hero
- 23.2% [2]
- 02Offer
- 14.3% [3]
- 02Pricing
- 14.3% [4]
- 04Value props
- 13.1% [5]
- 05CTA
- 11.0% [6]
- 06Nav
- 6.9% [7]
The ranking
Of 2,160 area annotations across 1,126 annotated experiments, the top five areas account for the bulk of all testing activity: source[1]
The hero wins on raw volume, but notice that offer, pricing, and value props are all paywall-driven surfaces. Added together they reach 878 annotations — nearly twice the hero — so the monetization screen collectively absorbs more experimentation than any single area. source[1]source[3]source[4]source[5]
How to apply it
If you have one test slot, the field is telling you the hero and the paywall are where teams place their bets. The hero is the highest-traffic surface and gets the most attention (405 distinct experiments touched it). source[2] But if you sell a subscription, the offer/pricing/value-props cluster is where competitors are iterating hardest — and, as the impact rankings show separately, where model-scored impact runs highest. Don't spend your one slot on nav (6.9%) or announcement bars unless you have a specific hypothesis there.
Caveats
These are counts of observed before/after UI diffs with LLM-inferred rationale, not measured win rates — a heavily tested area means the field iterates there often, not that those tests all won. source[8] Web is thin (365 experiments / 880 annotations), so nav and form volumes reflect a smaller web corpus. source[9] Shares are of the 2,160-annotation base.
Real in-market screens
Screens from real, in-market apps, tracked by Lazyweb Research.
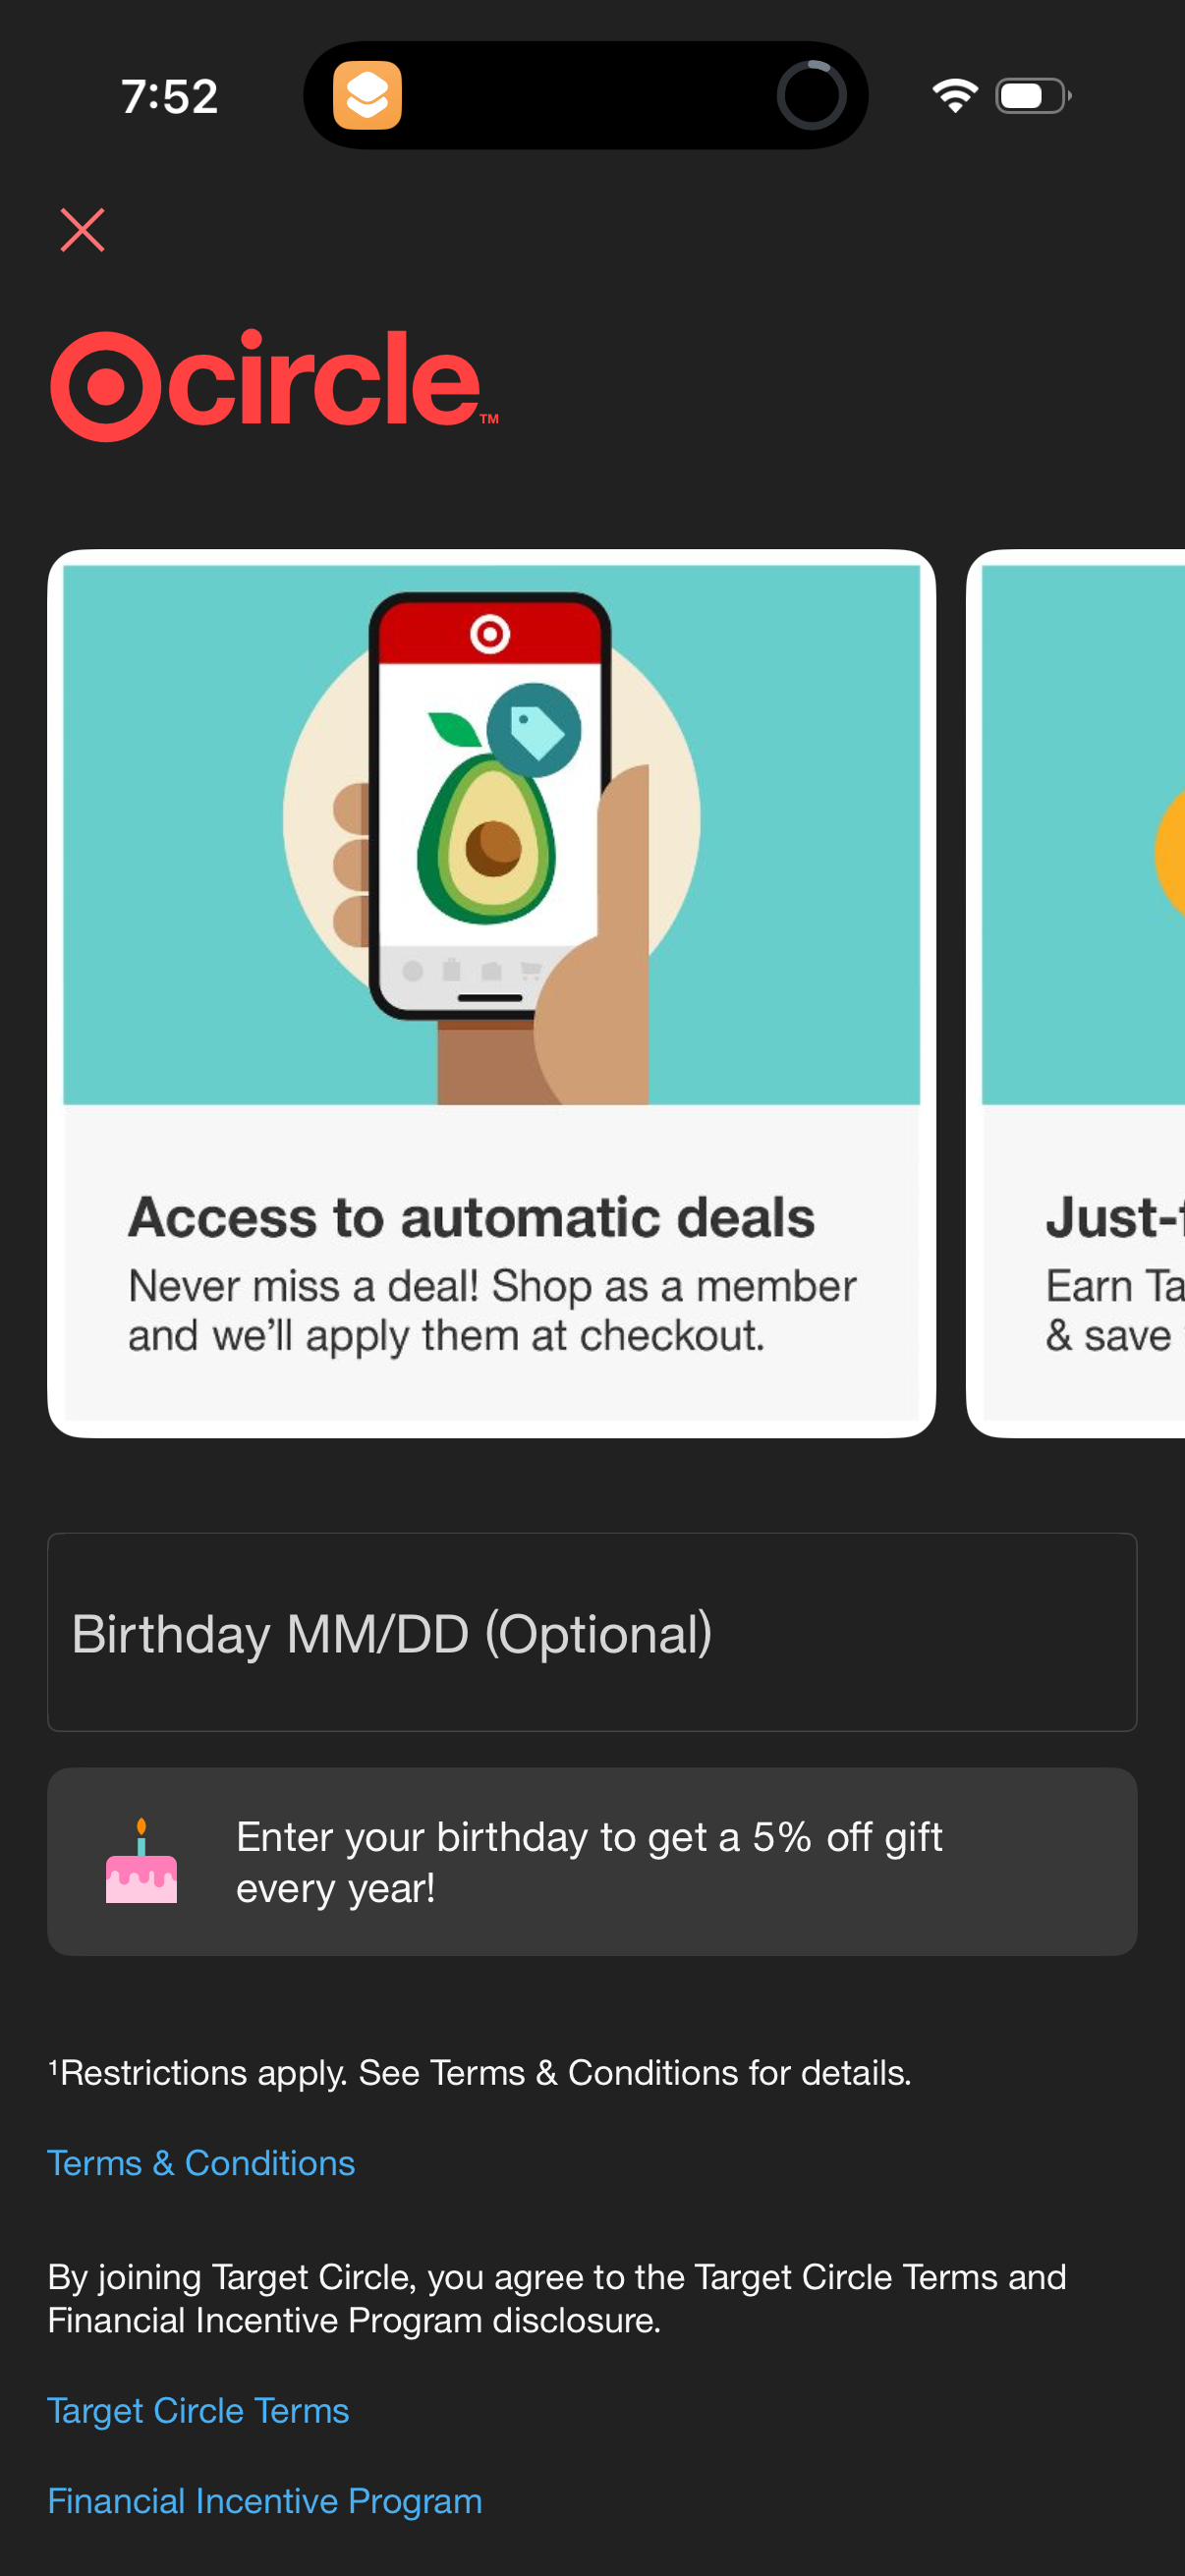
Target1206 × 2622opens the full image 
The Realreal1179 × 2556opens the full image 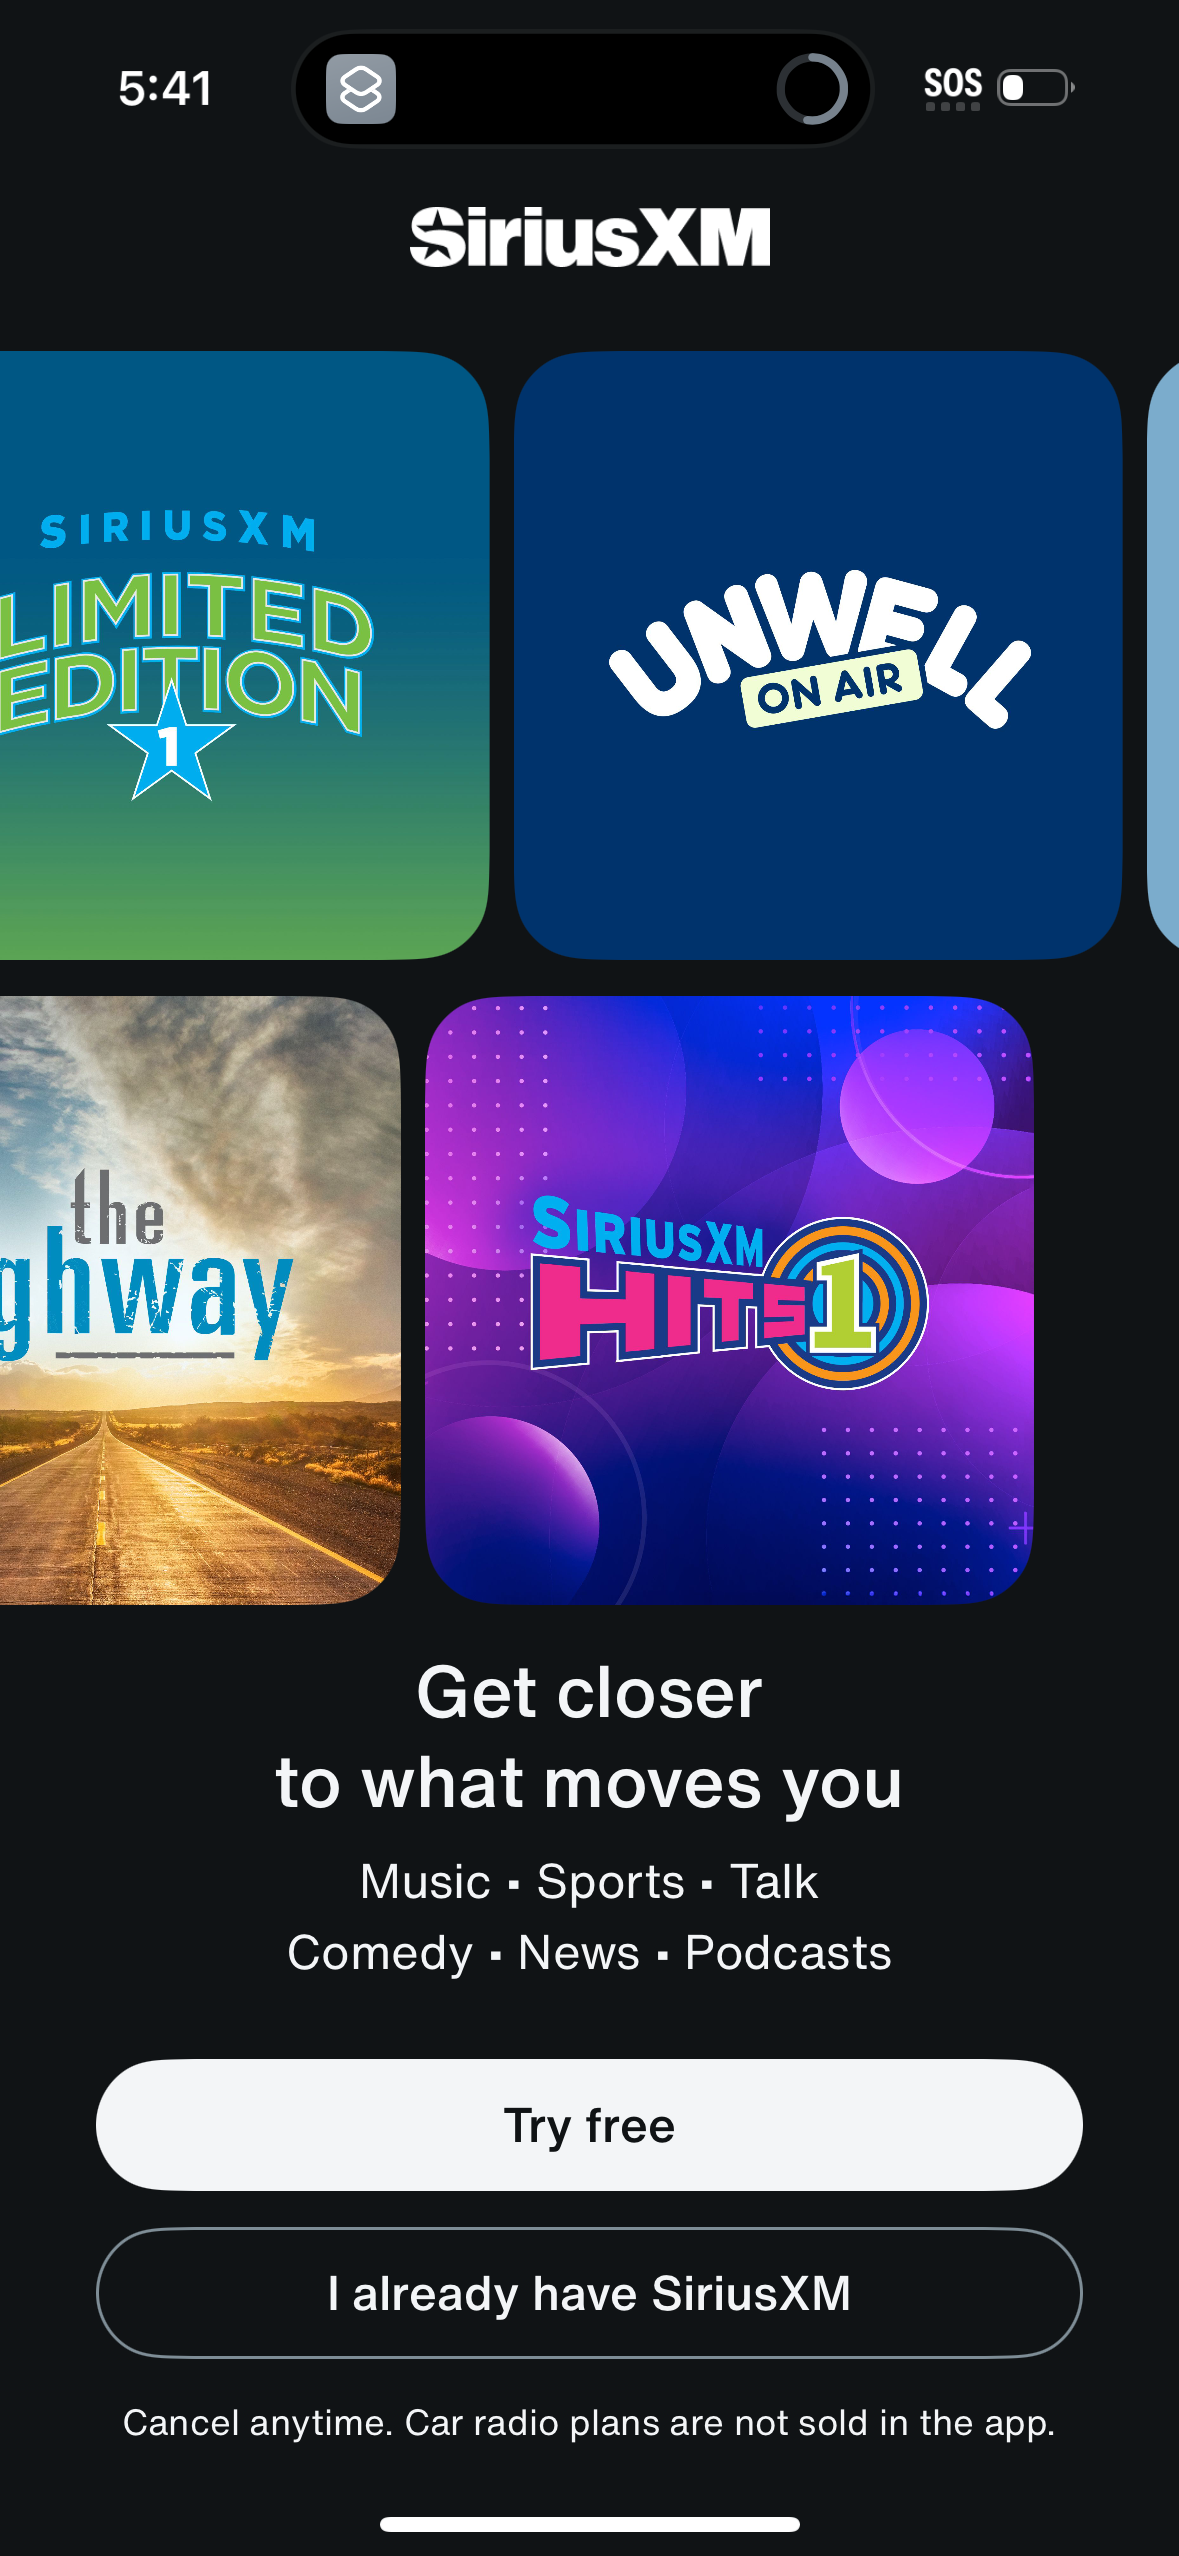
Siriusxm1179 × 2556opens the full image 
Reelshort1206 × 2622opens the full image
The numbers
| # | Stat | Computed from |
|---|---|---|
| [1] | 2,160 annotations across 1,126 annotated experiments (of 4,814 detected, 362 companies) | statpack totals + companies_with_experiments |
| [2] | Hero 488 annotations (23.2%), 405 experiments | statpack area_HERO |
| [3] | Offer 301 annotations (14.3%) | statpack area_OFFER |
| [4] | Pricing 301 annotations (14.3%) | statpack area_PRICING |
| [5] | Value props 276 annotations (13.1%) | statpack area_VALUE_PROPS |
| [6] | CTA 232 annotations (11.0%) | statpack area_CTA |
| [7] | Nav 144 annotations (6.9%) | statpack area_NAV |
| [8] | Experiments are observed UI diffs with LLM-inferred rationale, not measured A/B results | statpack universe + smallSampleWarnings |
| [9] | Web corpus is 365 experiments / 880 annotations | statpack platform_split_annotations + smallSampleWarnings |
Methodology
Universe: 2,160 area annotations across 1,126 of 4,814 detected before/after UI experiments (362 companies) in the ~800 tracked-apps corpus, area-labelled by LLM from paired screenshots, July 2026. Shares are of the 2,160-annotation base; all counts are observed UI diffs, not measured A/B outcomes.
Sources
- [1]
Lazyweb Research analysis of 2,160 area annotations (1,126 experiments across 362 companies in the ~800 tracked-apps corpus), July 2026
Area-level annotations of detected before/after UI experiments; PRICING TABLE merged into PRICING, VALUE PROPS/FEATURES into VALUE PROPS.
- [2]
Lazyweb Research analysis of 2,160 area annotations, July 2026
HERO area: 488 annotations, 405 distinct experiments.
- [3]
Lazyweb Research analysis of 2,160 area annotations, July 2026
OFFER area: 301 annotations.
- [4]
Lazyweb Research analysis of 2,160 area annotations, July 2026
PRICING area (merged with PRICING TABLE): 301 annotations.
- [5]
Lazyweb Research analysis of 2,160 area annotations, July 2026
VALUE PROPS area (merged with VALUE PROPS/FEATURES): 276 annotations.
- [6]
Lazyweb Research analysis of 2,160 area annotations, July 2026
CTA area: 232 annotations.
- [7]
Lazyweb Research analysis of 2,160 area annotations, July 2026
NAV area: 144 annotations, effectively web-only.
- [8]
Lazyweb Research methodology note, July 2026
All experiments are observations (before/after screenshots + inferred rationale), not measured lift.
- [9]
Lazyweb Research analysis of 2,160 area annotations, July 2026
Platform split: mobile 1,280 annotations / web 880 annotations.
Source: Lazyweb Research — proprietary analysis of real, in-market app screens. Cite as Lazyweb Research, 2026-07-07.