What Are Companies A/B Testing on Pricing Right Now?
- By Ali Abouelatta
- n = 301
- Published
- Updated
- 2 min read
- pricing · paywall · monetization · experiments · mobile · saas
Short answer
Pricing is a top-three test area: 301 of 2,160 annotations (14.3%) across 260 experiments Lazyweb Research observed by July 2026, with an average model impact of 3.53/5 — second only to offer among high-volume areas. It is 84% mobile (254 of 301 annotations). Just over half (53.8%) of pricing tests are scored 4+/5. The cleanest observed experiments change only the number while holding layout and anchors constant. source[1]
Pricing is tested in 301 of 2,160 annotations (14.3%) at 3.53/5 average impact, 84% of it on mobile paywalls — Lazyweb Research, July 2026.
Bar chart · Value
Value — How much, and where
One block is about 19.3%
- Annotations
- 301 (14.3% of 2,160)
- Distinct experiments
- 260
- Mobile / web split
- 254 / 47
- Avg impact (1–5)
- 3.53
- Share scored 4+/5
- 53.8% (162/301)
How much, and where
Pricing testing at a glance (PRICING merged with PRICING TABLE): source[2]
| Metric | Value |
|---|---|
| Annotations | 301 (14.3% of 2,160) |
| Distinct experiments | 260 |
| Mobile / web split | 254 / 47 |
| Avg impact (1–5) | 3.53 |
| Share scored 4+/5 | 53.8% (162/301) |
Like offer, pricing is a mostly-mobile paywall surface (84% mobile), so most of this iteration happens on in-app subscription screens rather than web pricing pages. source[3]
Observed patterns
From pricing experiments Lazyweb Research scored impact 5: source[4]
- Change only the price point. Dawn raised its weekly price from $4.99 to $7.99 with layout and CTA unchanged — a clean price-elasticity read, because users attribute the decision to cost, not new persuasion.
- Raise prices behind the same anchor. CapCut lifted discounted prices ($7.99→$9.99 monthly, $74.99→$89.99 yearly) while keeping the same strikethrough MSRP and urgency badge — a price test disguised as the same deal.
- Collapse the tier menu. Dribbble replaced a three-tier comparison (Lite $4 / Standard $8 / Plus $99) with a single '$8/mo' headline and one CTA, removing the cheap-tier escape hatch and the plan-evaluation step.
The pattern: isolate the number (or remove the menu) so the test reads cleanly. source[4]
How to apply it and caveats
To get an interpretable pricing result, change one thing: the price point, or the number of tiers — and keep anchors, layout, and CTA fixed, as Dawn and CapCut did. Holding a crossed-out MSRP constant lets users keep anchoring on it while you move the real price. Caveat: impact is a model-assigned 1–5 relative score on observed diffs, not measured lift or elasticity. source[5] The named examples are single observations; a price raise that scored high impact is not evidence it won revenue net of churn.
Real in-market screens
Screens from real, in-market apps, tracked by Lazyweb Research.
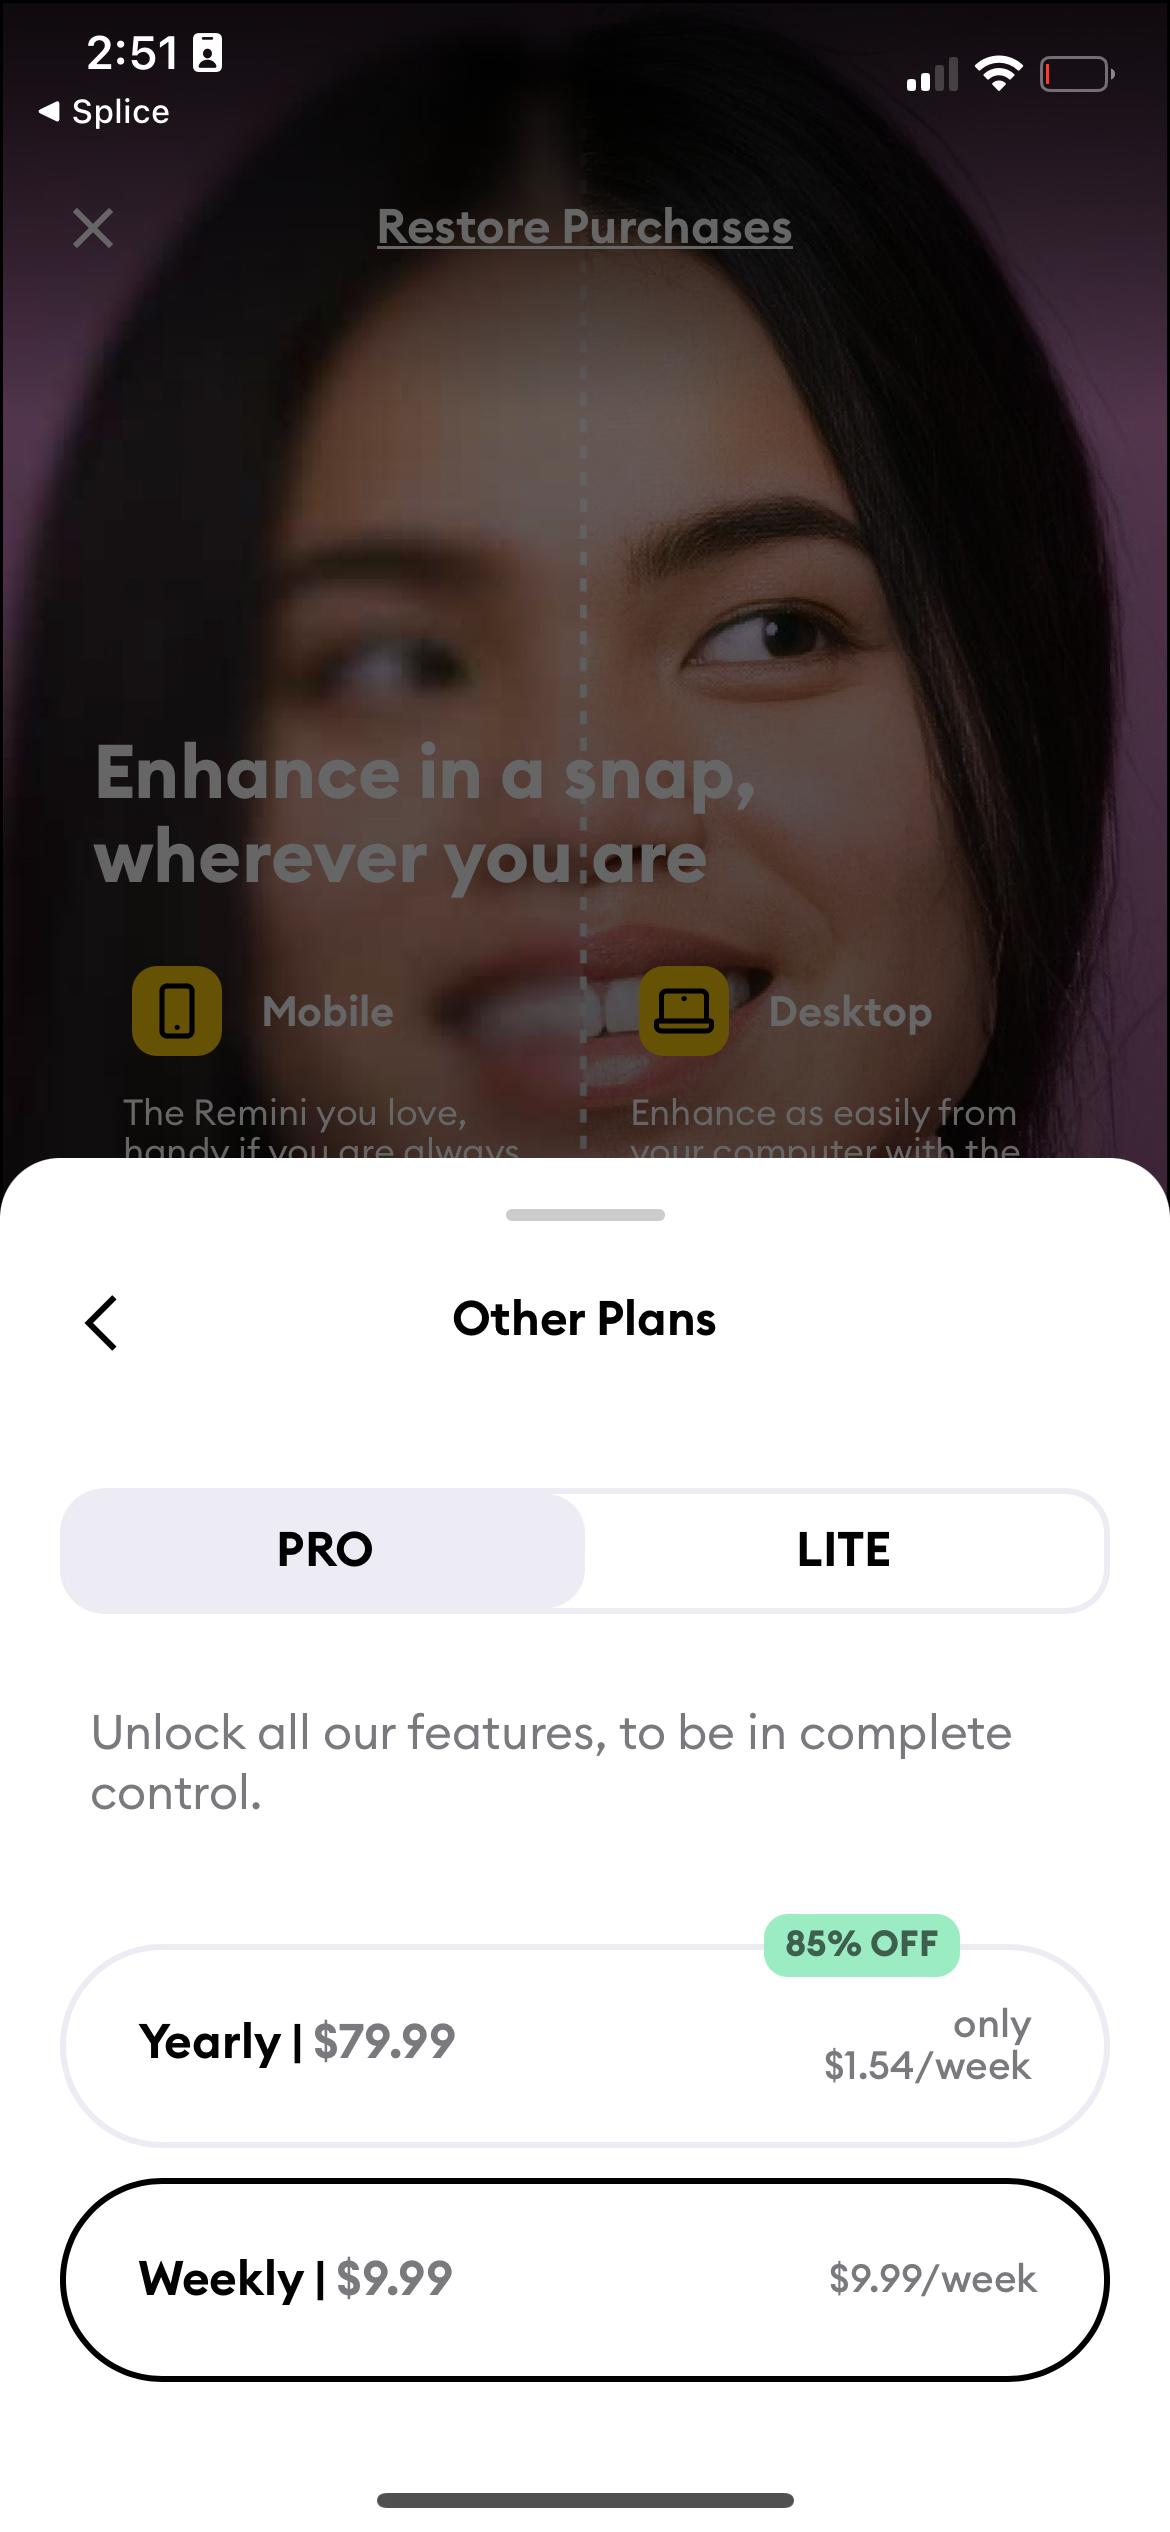
Remini1170 × 2532opens the full image 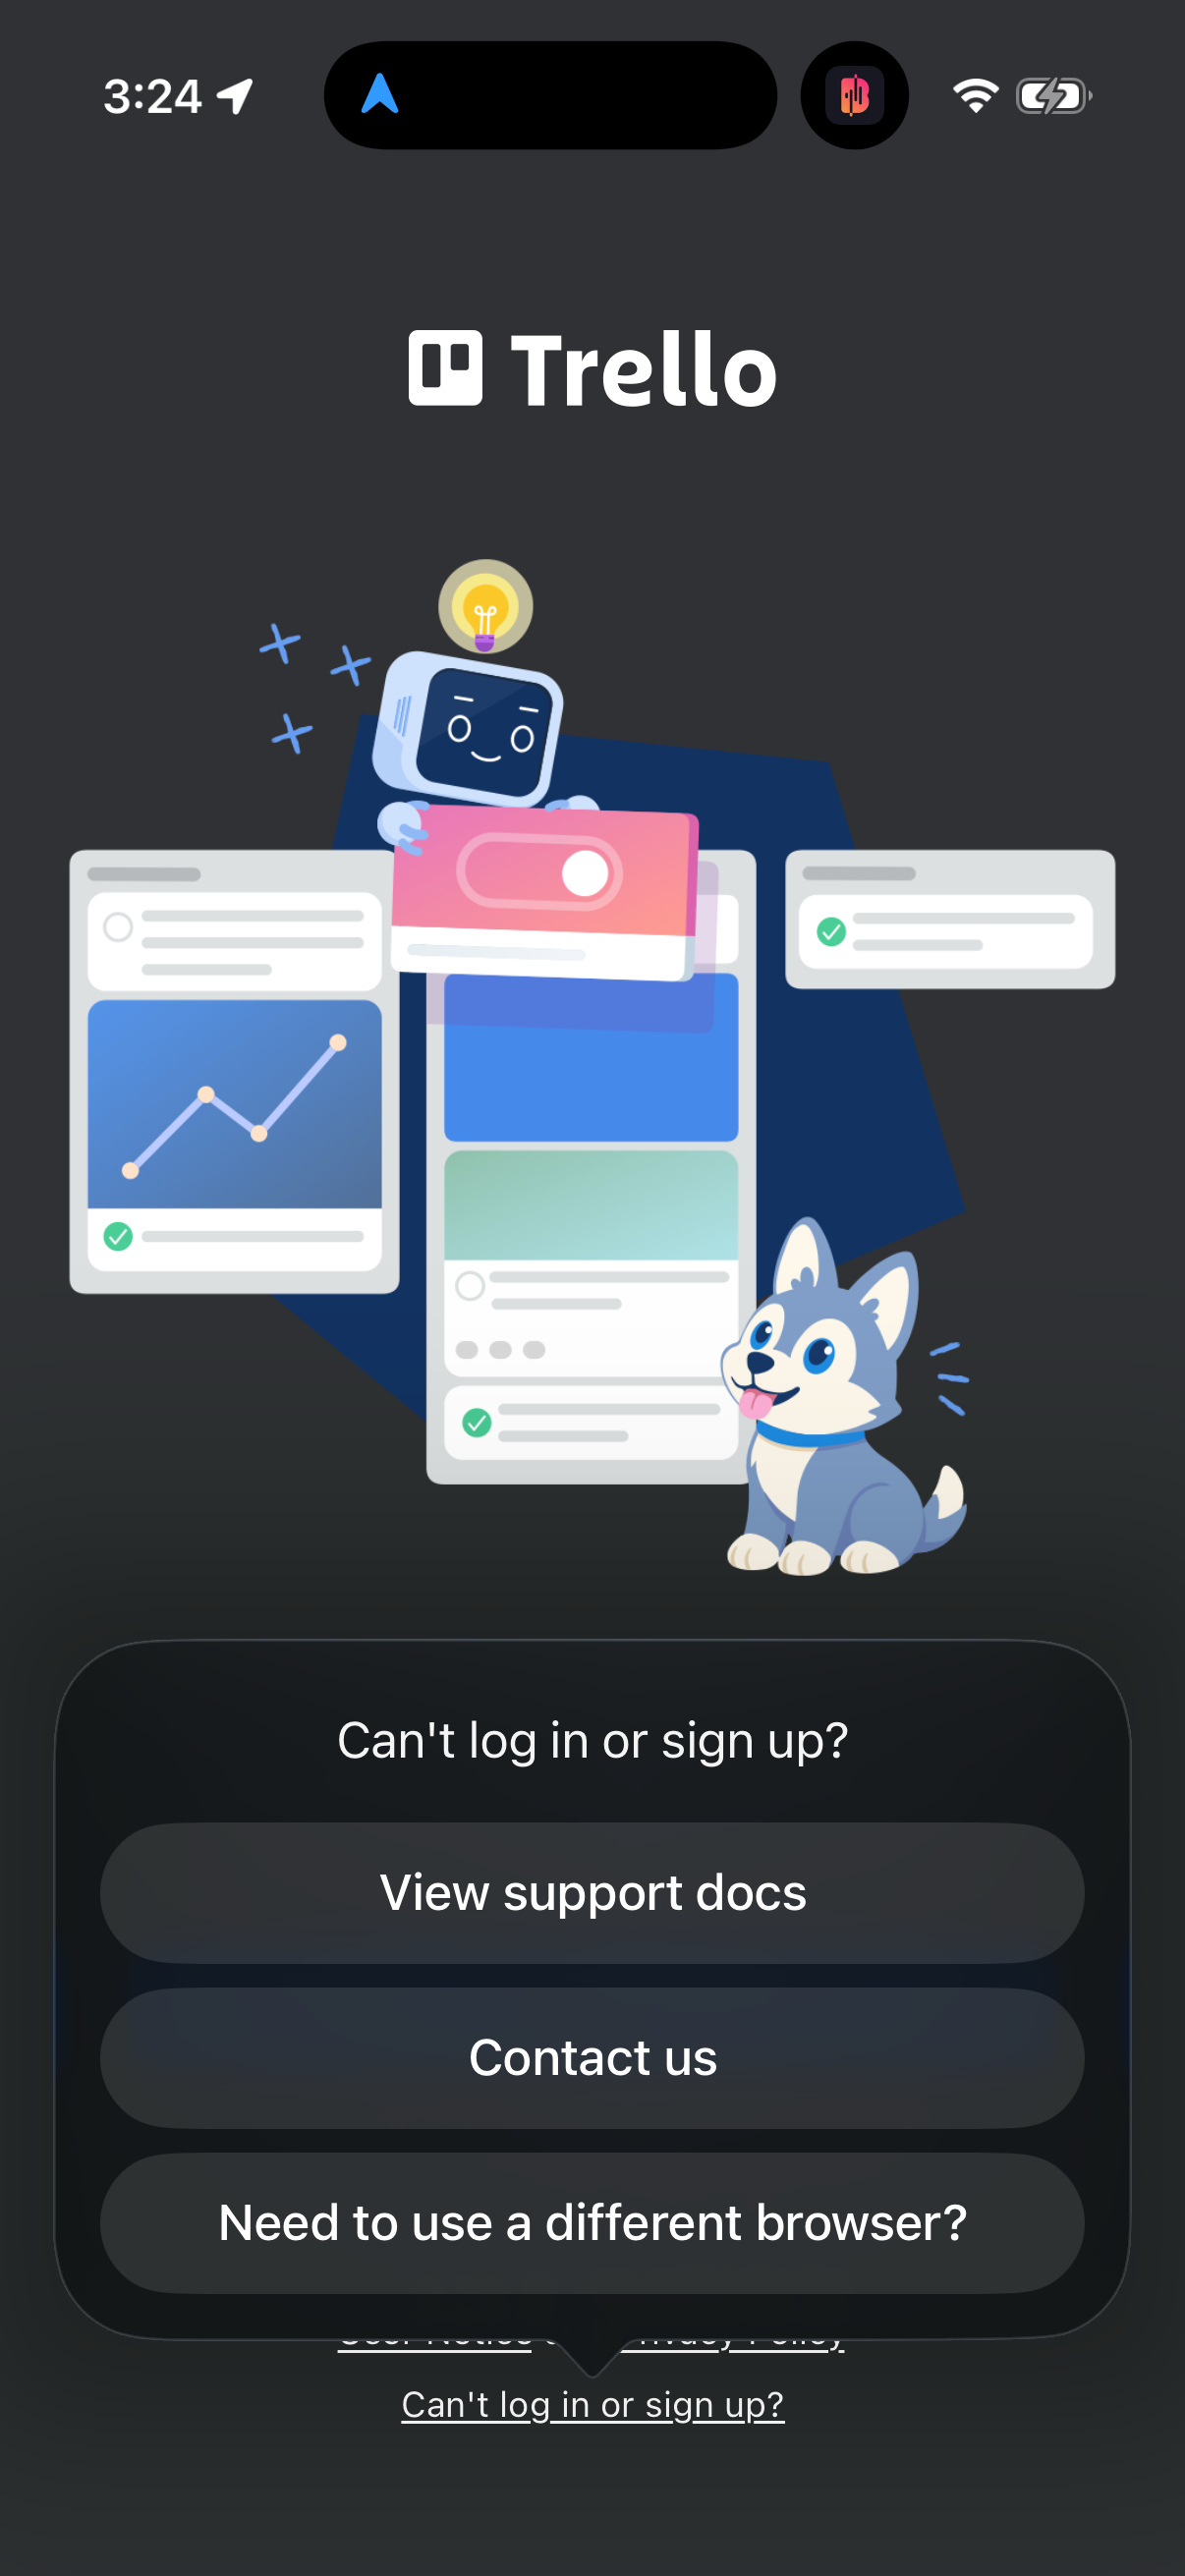
Trello1206 × 2622opens the full image 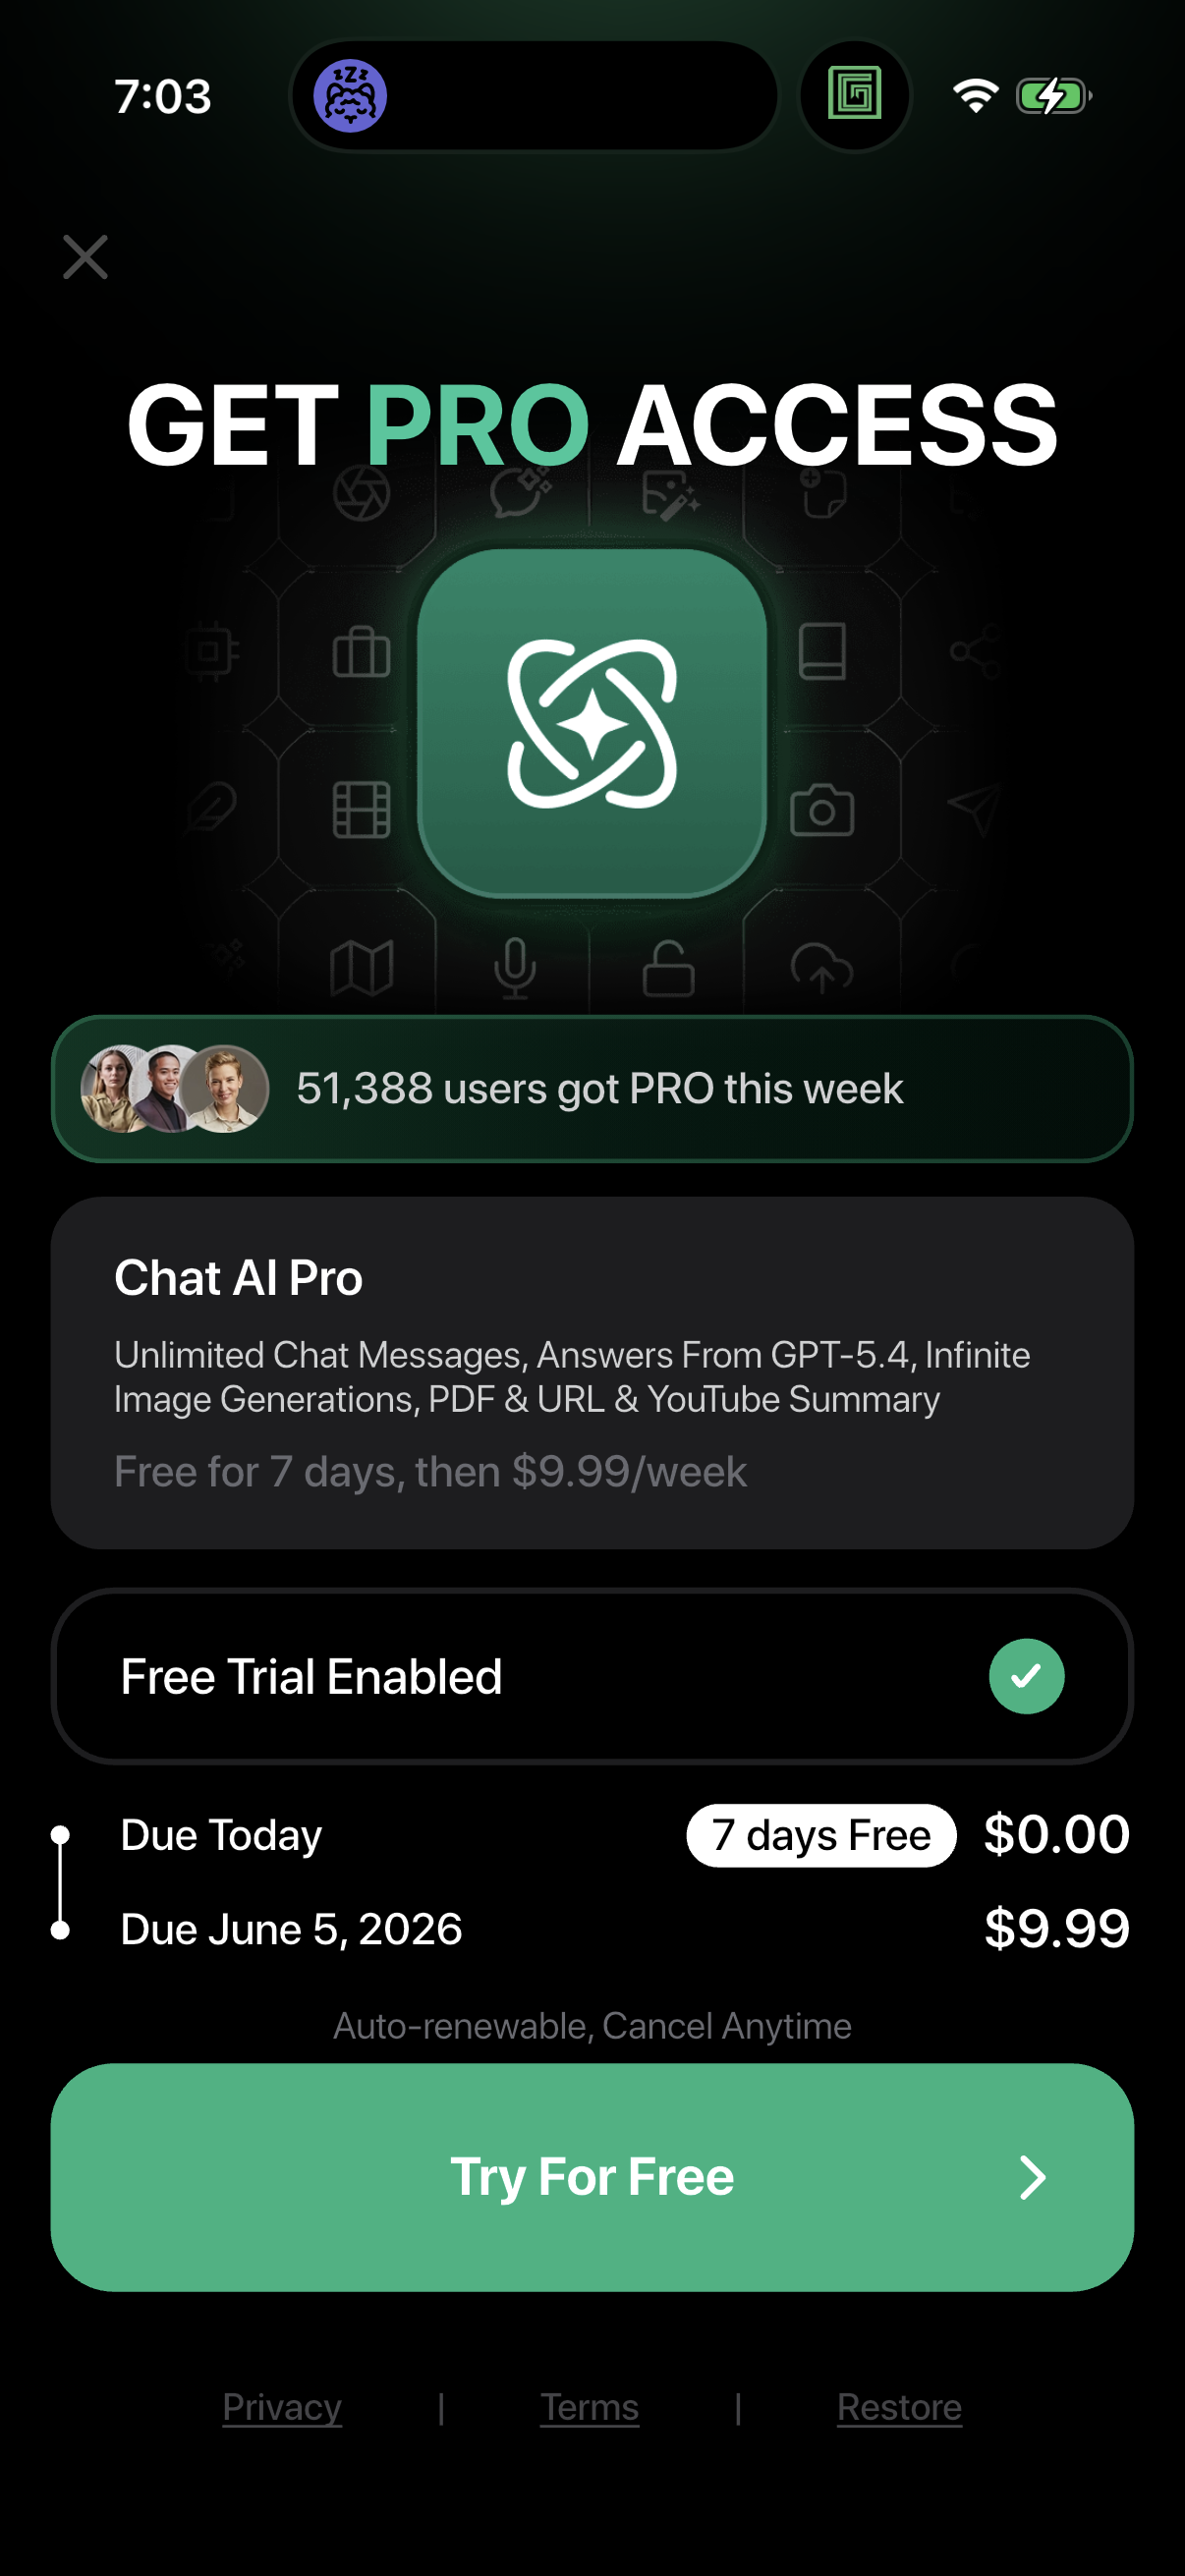
Ask Ai1206 × 2622opens the full image 
Prime Video1206 × 2622opens the full image
The numbers
| # | Stat | Computed from |
|---|---|---|
| [1] | Pricing 301 annotations (14.3%), 260 experiments, avg impact 3.53, 254 mobile / 47 web, 53.8% scored 4+ | statpack area_PRICING + high_impact_share_by_area |
| [2] | Pricing (merged): 301 annotations, 260 experiments, avg impact 3.53, 162/301 scored 4+ | statpack area_PRICING + high_impact_share_by_area |
| [3] | Pricing is 84% mobile (254/301) | statpack area_PRICING + platform_area_split |
| [4] | Pricing impact-5 examples: Dawn ($4.99→$7.99/wk), CapCut (price raise behind anchor), Dribbble (tiers→single price) | statpack qualitative PRICING entries |
| [5] | Impact is a model-assigned 1–5 relative score, not measured lift or elasticity | statpack methodology note |
Methodology
Universe: 301 pricing annotations (PRICING + PRICING TABLE merged) across 260 detected experiments (subset of 2,160), July 2026, LLM-labelled and impact-scored from paired screenshots. Named companies are single observations; impact is relative signal, not measured elasticity.
Sources
- [1]
Lazyweb Research analysis of 301 pricing annotations (260 experiments) within 2,160 total, July 2026
PRICING merged with PRICING TABLE; 254 mobile / 47 web; avg impact 3.53.
- [2]
- [3]
Lazyweb Research analysis of 2,160 area annotations, July 2026
Pricing is 84% mobile — a paywall-native surface.
- [4]
Lazyweb Research qualitative review of top-impact pricing experiments, July 2026
Dawn, CapCut, Dribbble — single observations scored impact 5 by the model.
- [5]
Lazyweb Research methodology note, July 2026
Impact is a relative model score on before/after diffs, not measured lift.
Source: Lazyweb Research — proprietary analysis of real, in-market app screens. Cite as Lazyweb Research, 2026-07-07.