What Are Companies A/B Testing on Value Props and Feature Lists?
- By Ali Abouelatta
- n = 276
- Published
- Updated
- 2 min read
- paywall · monetization · ux-patterns · experiments · mobile · upsell
Short answer
Value props — benefit bullets and feature lists — is the fourth most-tested area: 276 of 2,160 annotations (13.1%) across 254 experiments Lazyweb Research observed by July 2026. It is heavily tested (194 mobile / 82 web) but rarely flagged as high-leverage: average model impact is 3.03/5 and only 15.6% of tests score 4+/5, the second-lowest of major areas. Observed moves focus on quantifying entitlements and dropping tier comparisons. source[1]
Value props is the 4th most-tested area (276 of 2,160 annotations, 13.1%) but among the lowest-impact — only 15.6% of its tests score 4+/5 — Lazyweb Research, July 2026.
Bar chart · Value
Value — How much, and where
One block is about 9.1%
- Annotations
- 276 (13.1% of 2,160)
- Distinct experiments
- 254
- Mobile / web split
- 194 / 82
- Avg impact (1–5)
- 3.03
- Share scored 4+/5
- 15.6% (43/276)
How much, and where
Value-props testing at a glance (VALUE PROPS merged with VALUE PROPS/FEATURES): source[2]
| Metric | Value |
|---|---|
| Annotations | 276 (13.1% of 2,160) |
| Distinct experiments | 254 |
| Mobile / web split | 194 / 82 |
| Avg impact (1–5) | 3.03 |
| Share scored 4+/5 | 15.6% (43/276) |
Teams test value props often, but the model rarely rates the change high-impact — a heavily-iterated, modestly-scored surface. source[3]
Observed patterns
From value-props experiments Lazyweb Research scored impact 4: source[4]
- Quantify the entitlement. Canva rewrote benefit bullets from capability framing ('what you can do') to concrete numbers ('100 million+ premium photos', '1 TB storage'), turning vague promises into inventory and scale cues.
- Drop the tier comparison. Geocaching replaced a Basic-vs-Premium checklist with a Premium-only, icon-led benefit list — reframing the decision from 'compare tiers' to 'do I want these outcomes,' and avoiding a reminder of what's already free.
The recurring move: make benefits concrete and stop inviting a comparison. source[4]
How to apply it and caveats
If you test value props, the field's stronger plays are quantifying entitlements (numbers, not adjectives) and removing side-by-side tier comparisons that anchor users on the free plan. But temper expectations: value-props changes are frequently tested yet seldom high-impact (15.6% scored 4+), so treat them as supporting moves behind offer and pricing rather than headline bets. Caveat: impact is a relative model score on observed diffs, not measured lift. source[5] Named examples are single observations scored 4/5.
Real in-market screens
Screens from real, in-market apps, tracked by Lazyweb Research.
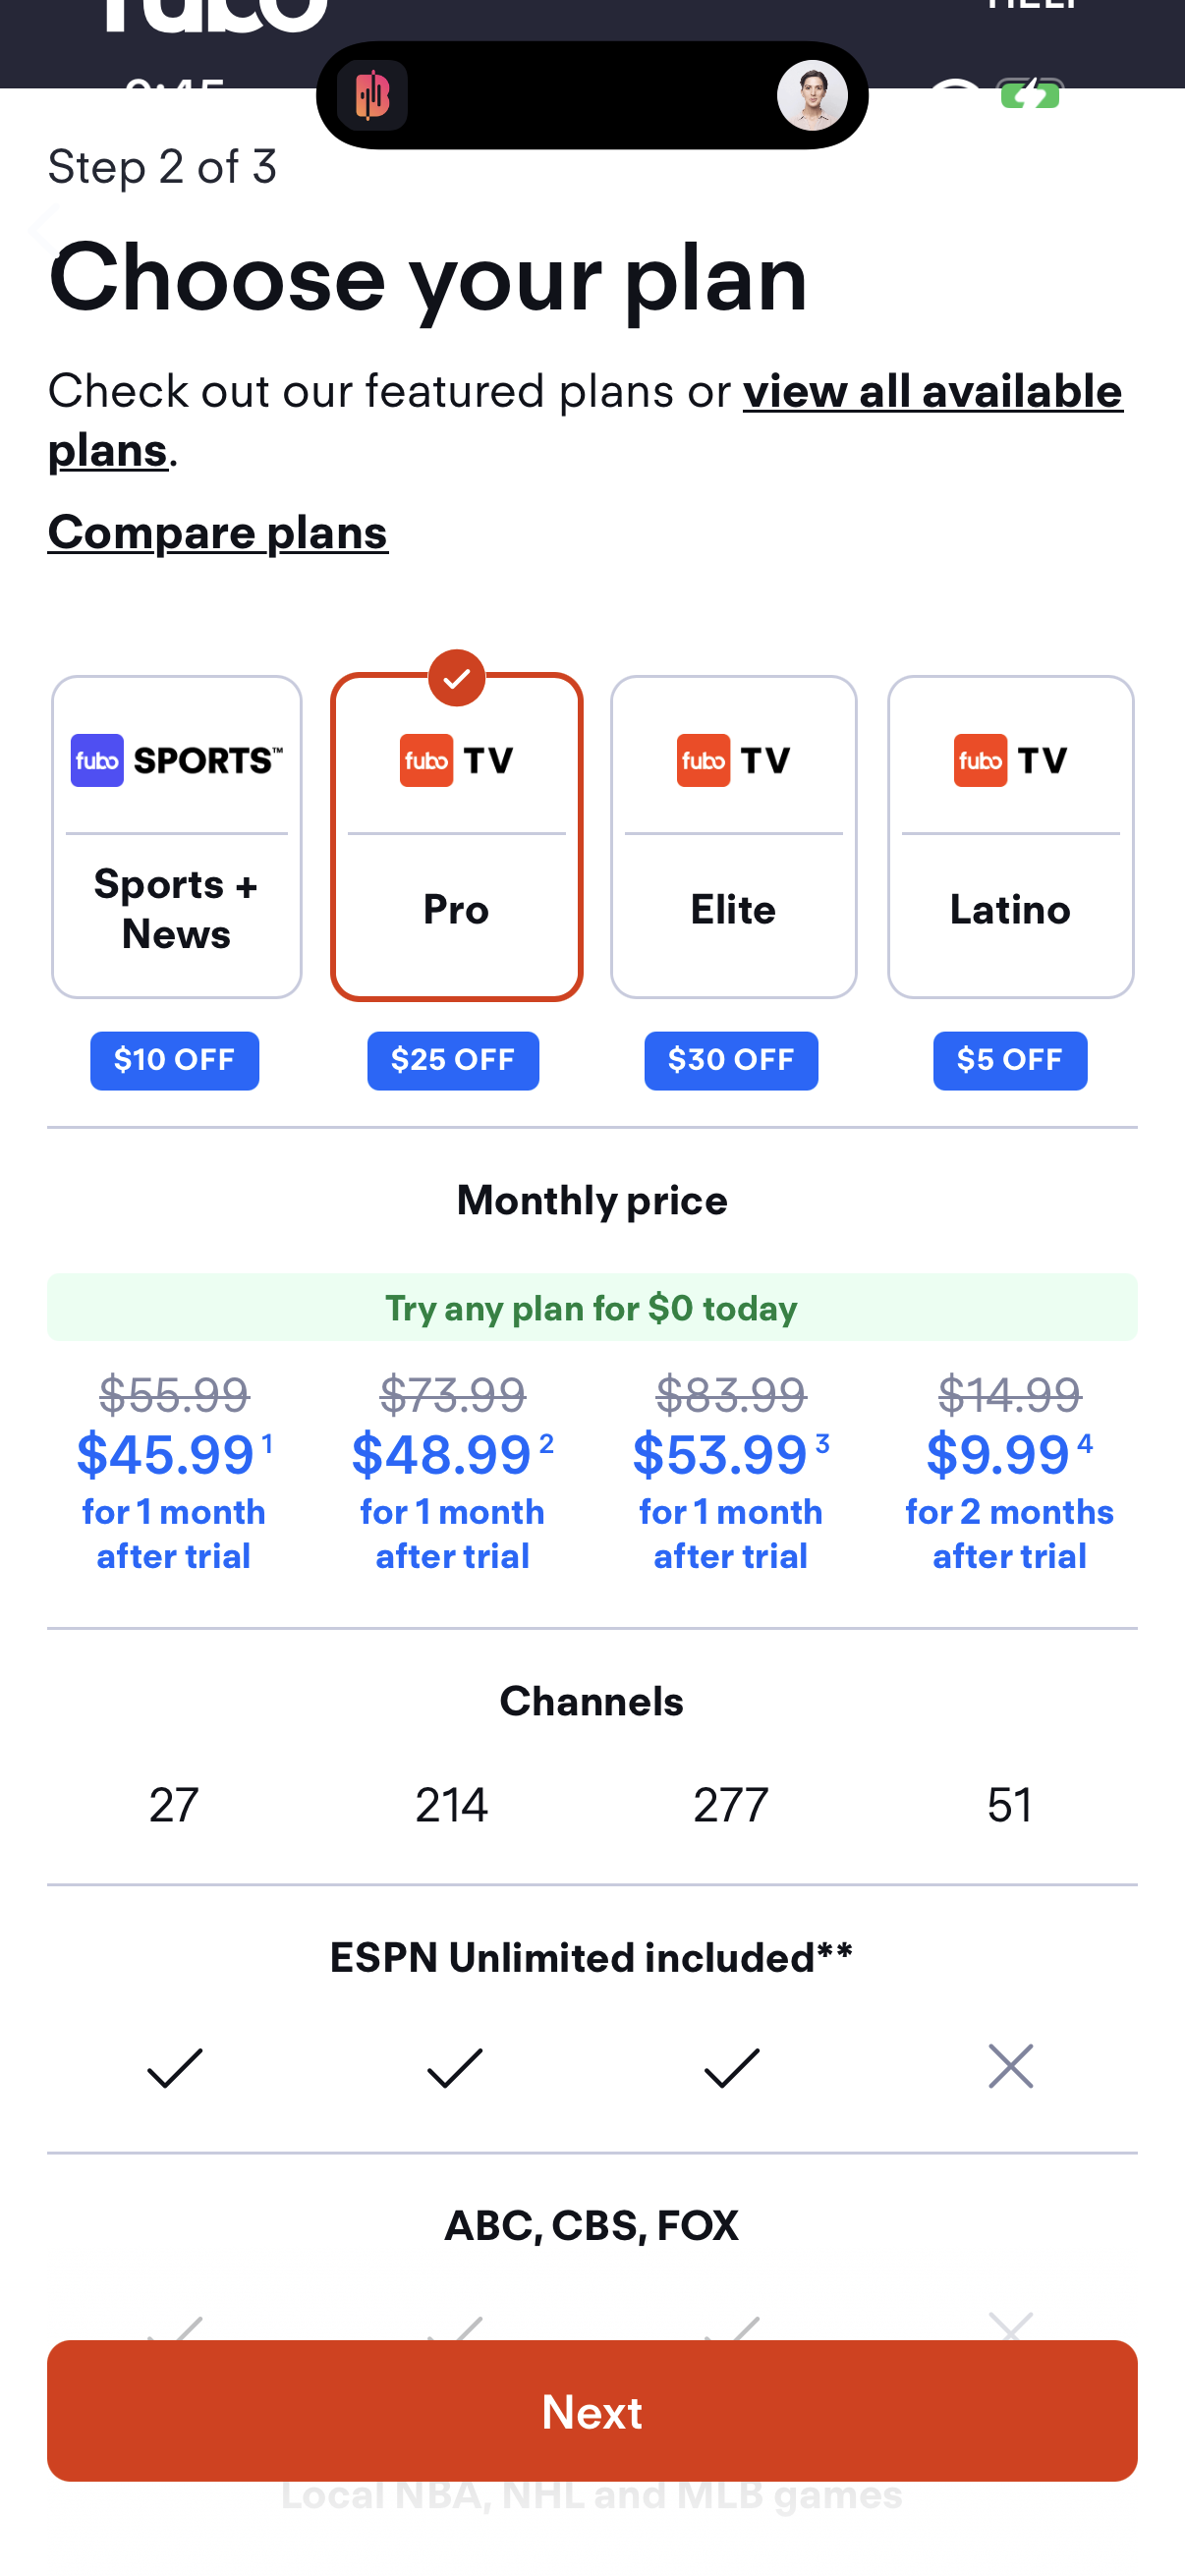
Fubo1206 × 2622opens the full image 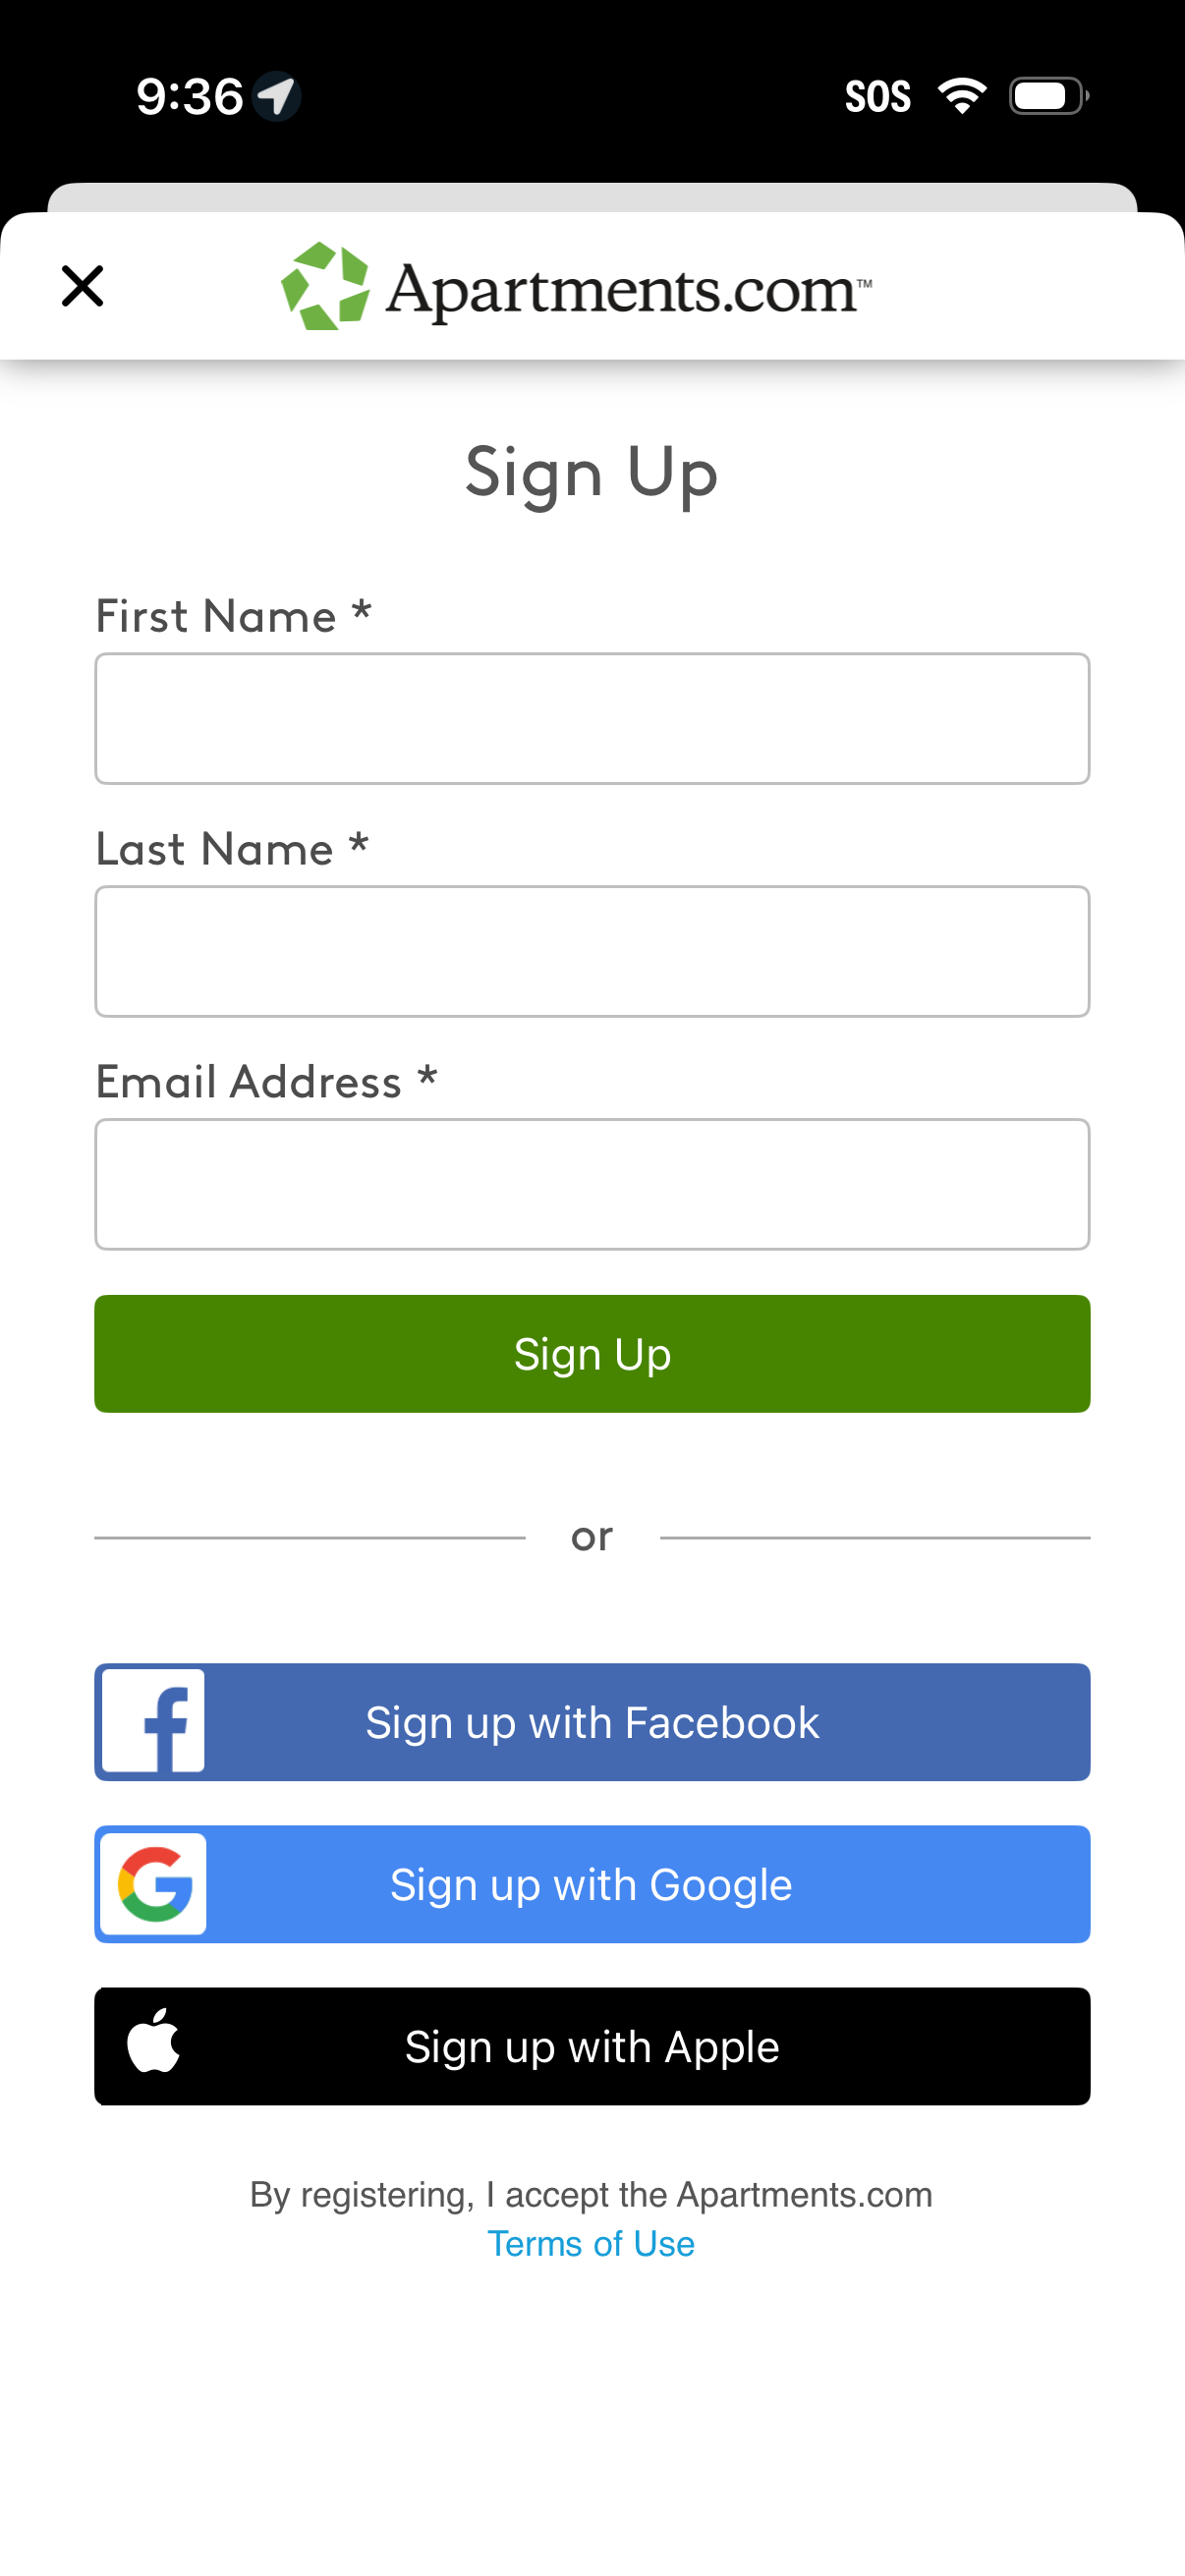
Apartmentscom1206 × 2622opens the full image 
Gauth1206 × 2622opens the full image 
Stupido1206 × 2622opens the full image
The numbers
| # | Stat | Computed from |
|---|---|---|
| [1] | Value props 276 annotations (13.1%), 254 experiments, 194 mobile / 82 web, avg impact 3.03, 15.6% scored 4+ | statpack area_VALUE_PROPS + high_impact_share_by_area |
| [2] | Value props (merged): 276 annotations, 254 experiments, avg impact 3.03, 43/276 scored 4+ | statpack area_VALUE_PROPS + high_impact_share_by_area |
| [3] | Value props: 194 mobile / 82 web; 15.6% scored 4+ (second-lowest of major areas) | statpack area_VALUE_PROPS + high_impact_share_by_area |
| [4] | Value-props impact-4 examples: Canva (quantified entitlements), Geocaching (dropped tier comparison) | statpack qualitative VALUE PROPS entries |
| [5] | Impact is a relative model score on observed diffs, not measured lift | statpack methodology note |
Methodology
Universe: 276 value-props annotations (merged variants) across 254 detected experiments (subset of 2,160), July 2026, LLM-labelled and impact-scored from paired screenshots. Named companies are single observations; impact is relative signal, not measured lift.
Sources
- [1]
Lazyweb Research analysis of 276 value-props annotations (254 experiments) within 2,160 total, July 2026
VALUE PROPS merged with VALUE PROPS/FEATURES; 194 mobile / 82 web.
- [2]
Lazyweb Research analysis of 276 value-props annotations, July 2026
43 of 276 scored 4+/5; avg impact 3.03.
- [3]
Lazyweb Research analysis of 2,160 area annotations, July 2026
Value props has the second-lowest 4+ share of the major areas.
- [4]
Lazyweb Research qualitative review of value-props experiments, July 2026
Canva and Geocaching — single observations scored impact 4 by the model.
- [5]
Lazyweb Research methodology note, July 2026
Impact is a relative model score on before/after diffs, not measured lift.
Source: Lazyweb Research — proprietary analysis of real, in-market app screens. Cite as Lazyweb Research, 2026-07-07.