What Page Areas Are Education Companies A/B Testing?
- By Ali Abouelatta
- n = 259
- Published
- Updated
- 2 min read
- experiments · monetization · trials · pricing · mobile · saas
Short answer
Across 259 area-annotated experiments from education companies tracked by Lazyweb Research (159 experiments, 17 companies), the offer is the most-tested area by a wide margin: 67 OFFER annotations, ahead of VALUE PROPS (45) and PRICING (42) source[1]. That makes education the one large category where the offer, not the hero, leads the test mix source[1]source[2]. It is the second most-annotated category overall, behind only productivity source[2].
Education companies test OFFER most (67 of 259 area annotations), ahead of value props (45) and pricing (42) — Lazyweb Research analysis of 17 education apps, July 2026.
Bar chart · Annotations
Annotations — Education's top tested areas
One block is about 2.4 Annotations
- OFFER
- 67
- VALUE PROPS
- 45
- PRICING
- 42
The finding: education leads with the offer
Education is one of the largest category cuts at 259 annotations across 159 experiments and 17 companies source[1]. Its most-tested area is OFFER at 67 annotations, followed by VALUE PROPS (45) and PRICING (42) source[1]. That ordering is distinctive: in most large categories the hero leads, but in education the discount/trial/deal-framing area is on top, consistent with subscription-heavy learning apps competing hard on offer strength source[1]source[2].
Education's top tested areas
Cells with n>=8 for education source[1]:
| Area | Annotations |
|---|---|
| OFFER | 67 |
| VALUE PROPS | 45 |
| PRICING | 42 |
And across the whole corpus, OFFER carries a 66.4% high-impact share and PRICING 53.8% — so education is concentrating its tests on two of the highest-yield areas source[3]. A representative offer move in the broader corpus: strengthening a paywall deal from 50% off to 75% off with identical urgency framing source[4].
How to apply it
If you run an education/subscription learning product, the peer pattern is to test offer framing first — trial presence, discount depth, deal urgency — then value props and price source[1]. The corpus-wide impact scores back this ordering, since offer and pricing are the highest high-impact areas source[3]. Use value-prop tests (quantified entitlements, benefit reframing) as the supporting lever, not the lead source[1].
Caveats
The 259 annotations come from just 17 companies, so a few heavy testers (e.g. Memrise, Mimo appear among top testers) can shape the mix source[5]. Only cells with n>=8 are shown source[1]. Category percentages use the company-category-matched subset; 44 annotations corpus-wide have no category match source[5].
Real in-market screens
Screens from real, in-market apps, tracked by Lazyweb Research.
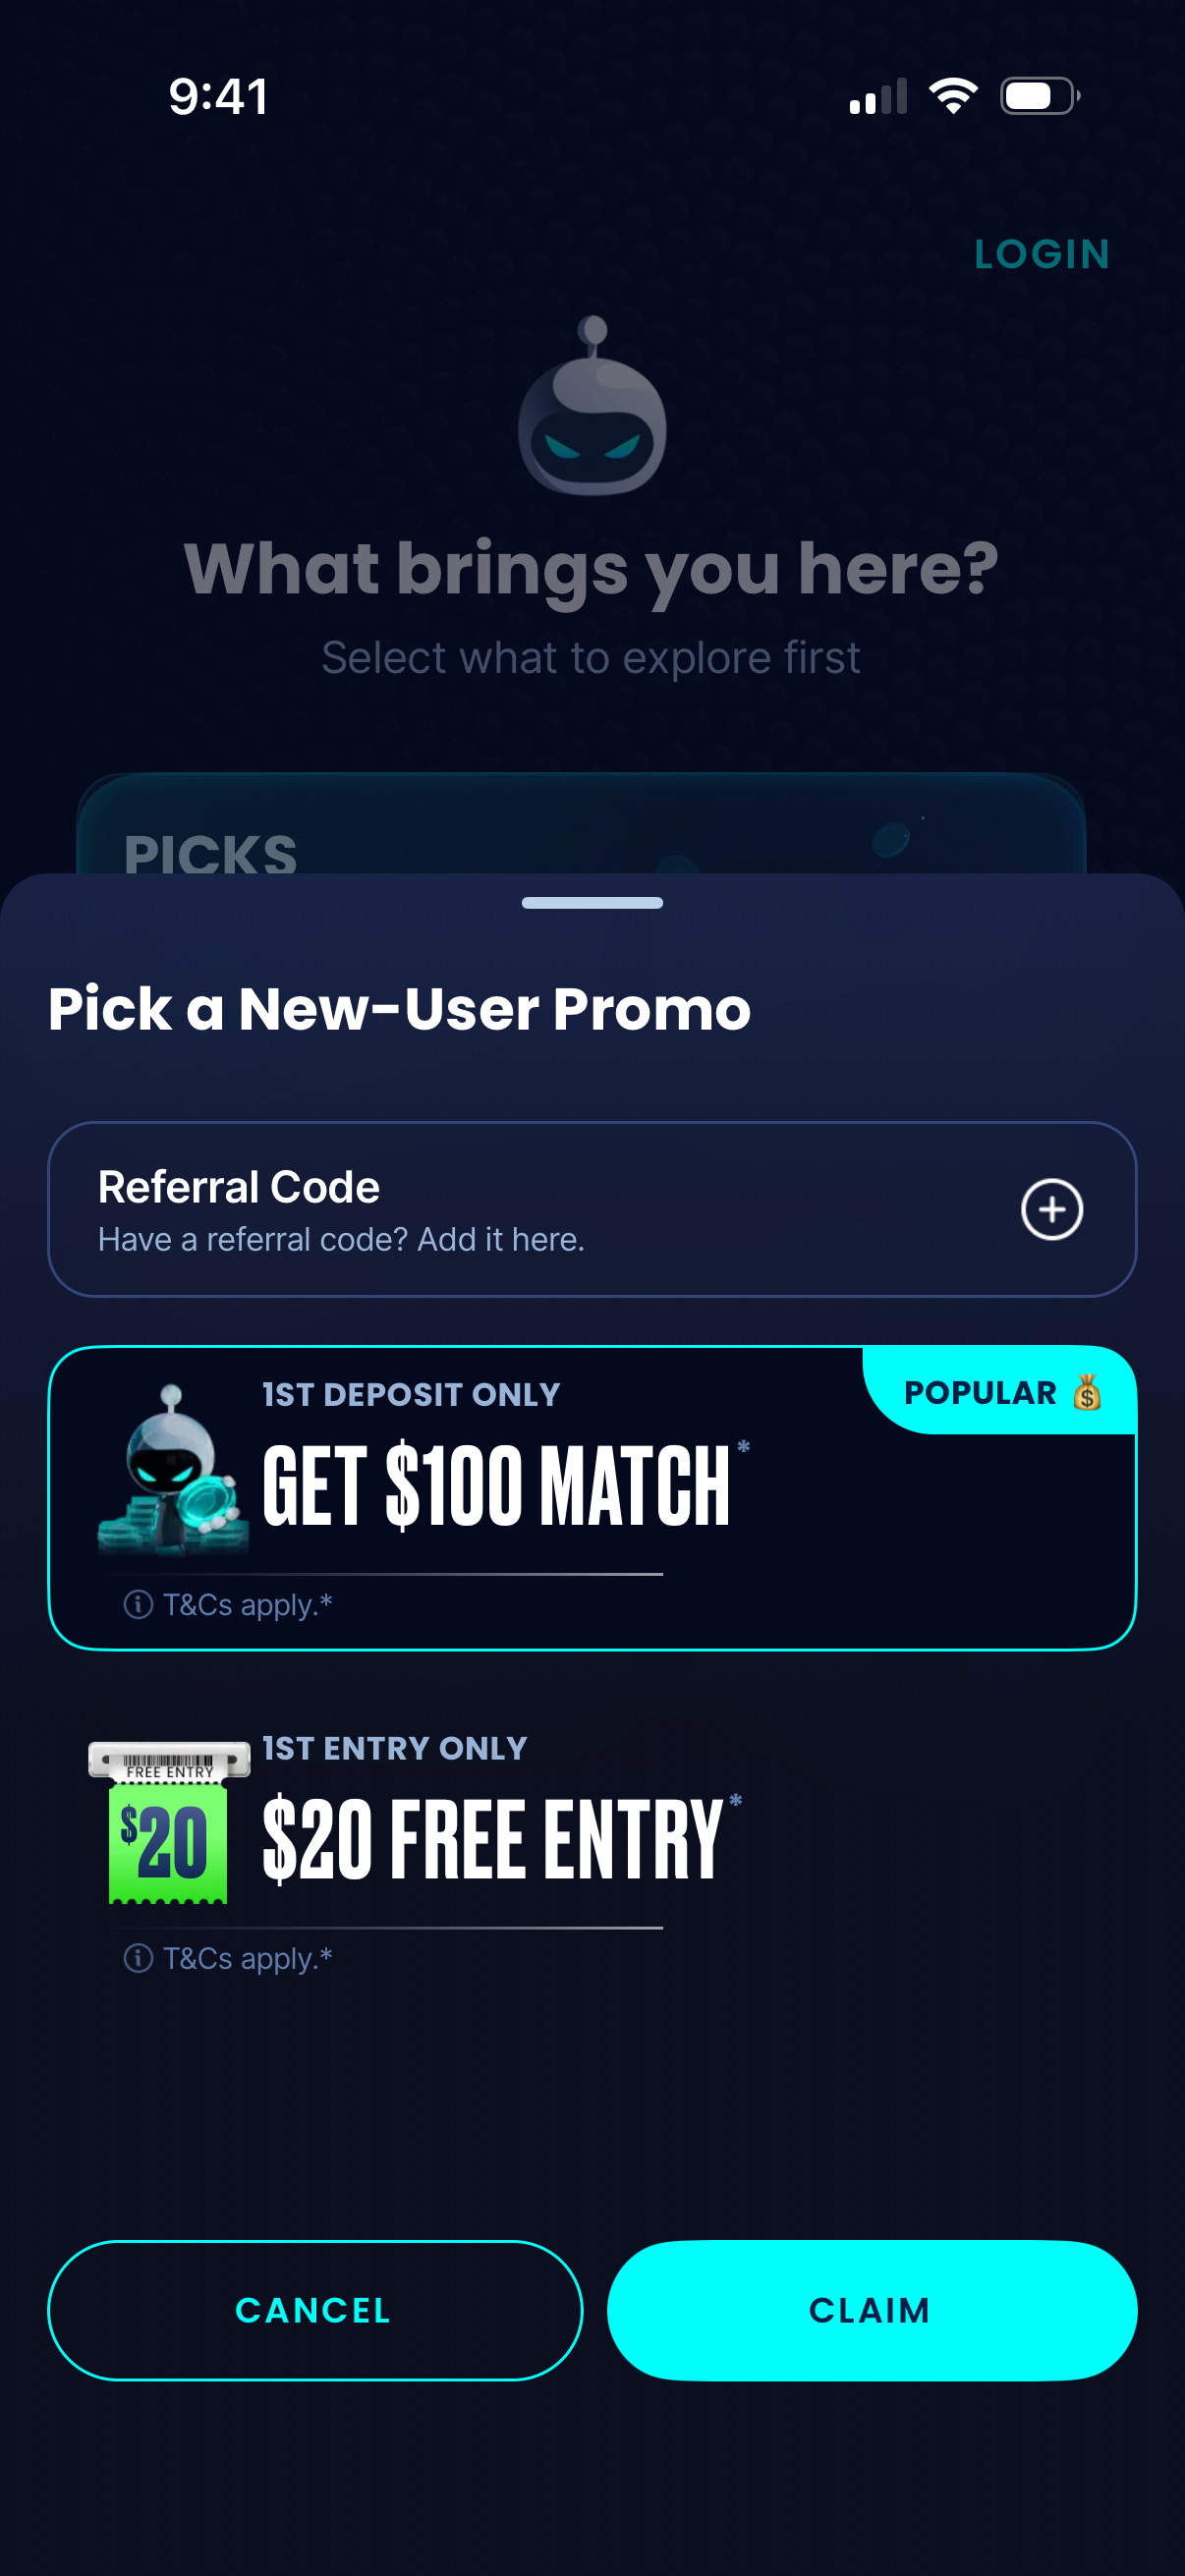
Sleeper1206 × 2622opens the full image 
The Weather Channel1206 × 2622opens the full image 
Halo Habits1206 × 2622opens the full image 
Citibike1206 × 2622opens the full image
The numbers
| # | Stat | Computed from |
|---|---|---|
| [1] | Education: 259 annotations, 159 experiments, 17 companies; top areas OFFER 67, VALUE PROPS 45, PRICING 42 | category_totals; category_top_area |
| [2] | Education is the 2nd most-annotated category (259), behind productivity (263) | category_totals |
| [3] | OFFER high-impact share 66.4%, PRICING 53.8% corpus-wide | high_impact_share_by_area |
| [4] | Example offer move: Blinkist strengthened paywall deal from 50% OFF ($49.99/yr) to 75% OFF ($24.99/yr) | qualitative OFFER blinkist |
| [5] | Memrise (22) and Mimo (14) among top testers; 44 corpus annotations have no category match | top_testing_companies; smallSampleWarnings |
Methodology
Universe is 259 area annotations from 17 education-categorized companies within 2,160 annotations over 1,126 detected experiments in the ~800 tracked-apps corpus. Areas are LLM-annotated from observed before/after screenshots, July 2026; only cells with n>=8 are reported.
Sources
- [1]
Lazyweb Research analysis of 259 education-company experiments (17 apps), July 2026
Area annotations for education-categorized companies within 2,160 annotations.
- [2]
Lazyweb Research analysis of category annotation totals (~800 tracked apps), July 2026
Annotations by app-store category; n>=70 categories qualify for cuts.
- [3]
Lazyweb Research analysis of per-area high-impact share (n>=30 areas), July 2026
Model-assigned impact 4+/5 shares.
- [4]
Lazyweb Research analysis of 2,160 annotated experiments (~800 tracked apps), July 2026
Named example is a single observed diff with inferred rationale.
- [5]
Lazyweb Research analysis of top testing companies (~800 tracked apps), July 2026
Concentration and unmatched-category caveats.
Source: Lazyweb Research — proprietary analysis of real, in-market app screens. Cite as Lazyweb Research, 2026-07-07.