What Page Areas Are Graphics And Design Companies A/B Testing?
- By Ali Abouelatta
- n = 115
- Published
- Updated
- 2 min read
- experiments · pricing · monetization · saas · ux-patterns · web
Short answer
Across 115 area-annotated experiments from graphics & design companies tracked by Lazyweb Research (57 experiments, 11 companies), pricing leads (35 annotations) ahead of offer (20) — one of the few large categories where pricing, not the hero, is the top tested area source[1]. That points to design-tool subscriptions competing primarily on price and plan structure source[1]source[2].
Graphics & design companies test PRICING most (35 of 115 area annotations), ahead of offer (20) — one of the few categories where pricing leads — Lazyweb Research, July 2026.
The finding: pricing-first
Graphics & design contributes 115 annotations across 57 experiments and 11 companies source[1]. Its most-tested area is PRICING (35), followed by OFFER (20) source[1]. This is unusual: HERO tops most large categories, but here pricing leads, suggesting design-tool teams treat the price and plan structure as their primary experiment surface source[1]source[2]. Pixelcut appears among the corpus's top testers source[3].
Graphics & design top tested areas
Cells with n>=8 source[1]:
| Area | Annotations |
|---|---|
| PRICING | 35 |
| OFFER | 20 |
Pricing and offer are the two highest high-impact areas corpus-wide (53.8% and 66.4% scored 4+/5), so this category is concentrated on the highest-yield real estate source[4]. A representative pricing move on the web side: collapsing a three-tier plan comparison to a single headline price with one CTA above the fold source[5].
How to apply it
If you run a design or creative-tools subscription, the peer pattern is to lead with price and plan-structure tests, then offer framing source[1]. Test whether a single decisive price beats a tiered menu (the observed 'collapse the tiers' move) versus whether a cheaper entry tier expands the top of funnel source[5]. Because both areas score high-impact, isolate one price variable per test for a clean read source[4].
Caveats
115 annotations from 11 companies is a concentrated cut; treat the pricing-lead as suggestive of a few heavy testers, not a law source[3]. Only n>=8 cells shown source[1]. The named web pricing example is a single observed diff source[5].
Real in-market screens
Screens from real, in-market apps, tracked by Lazyweb Research.
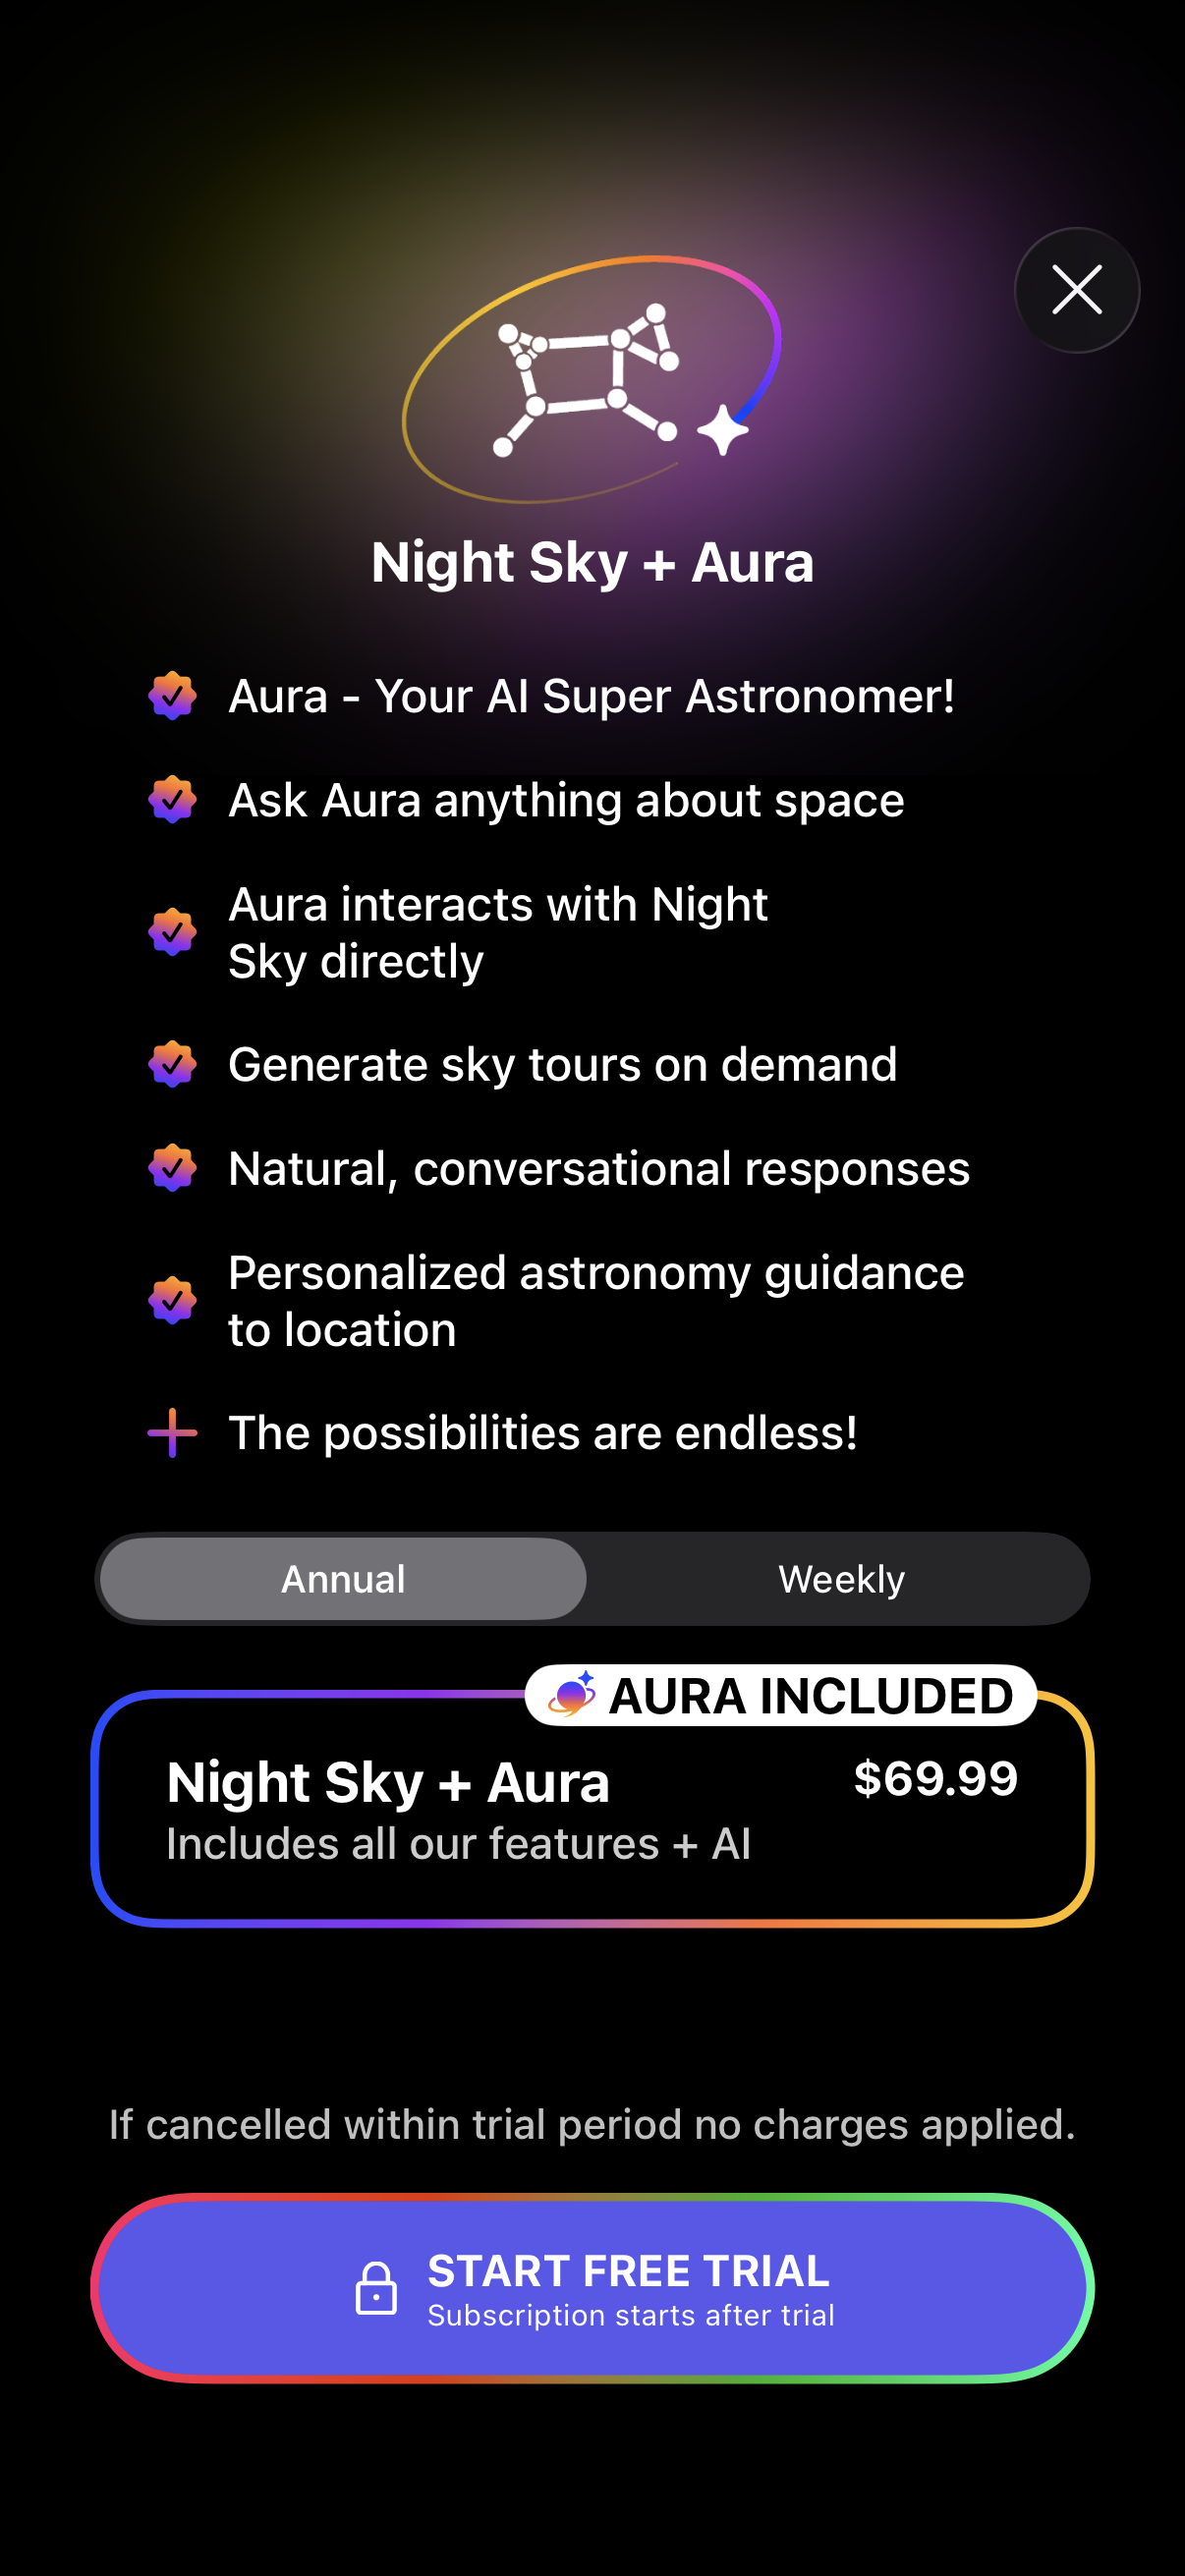
Night Sky1206 × 2622opens the full image 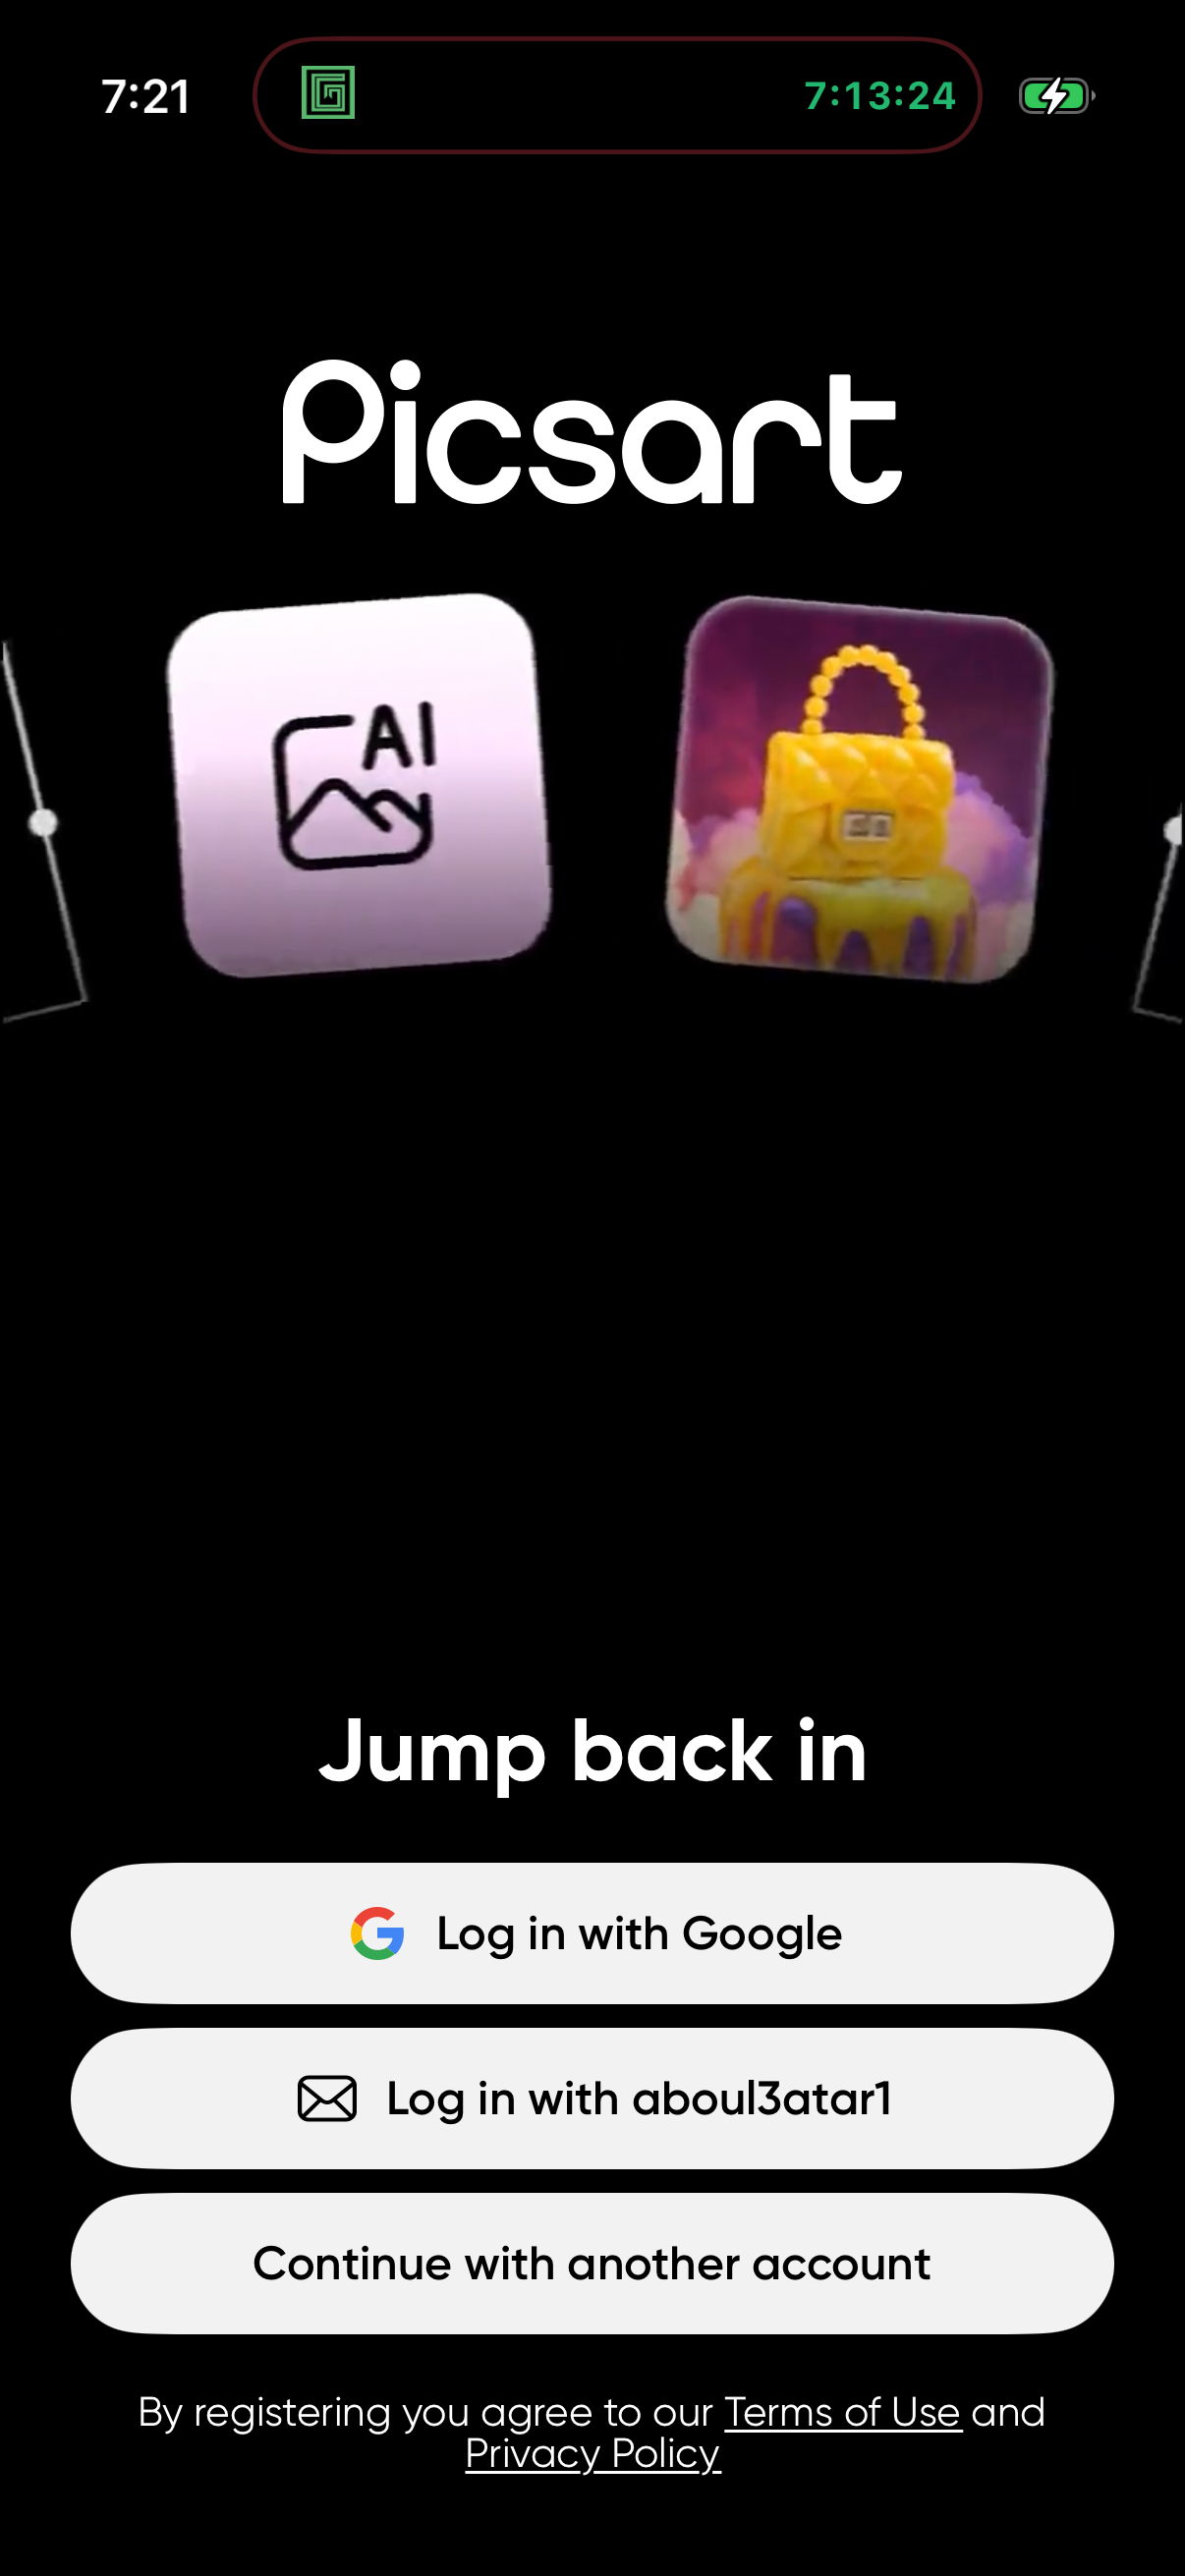
Picsart1206 × 2622opens the full image 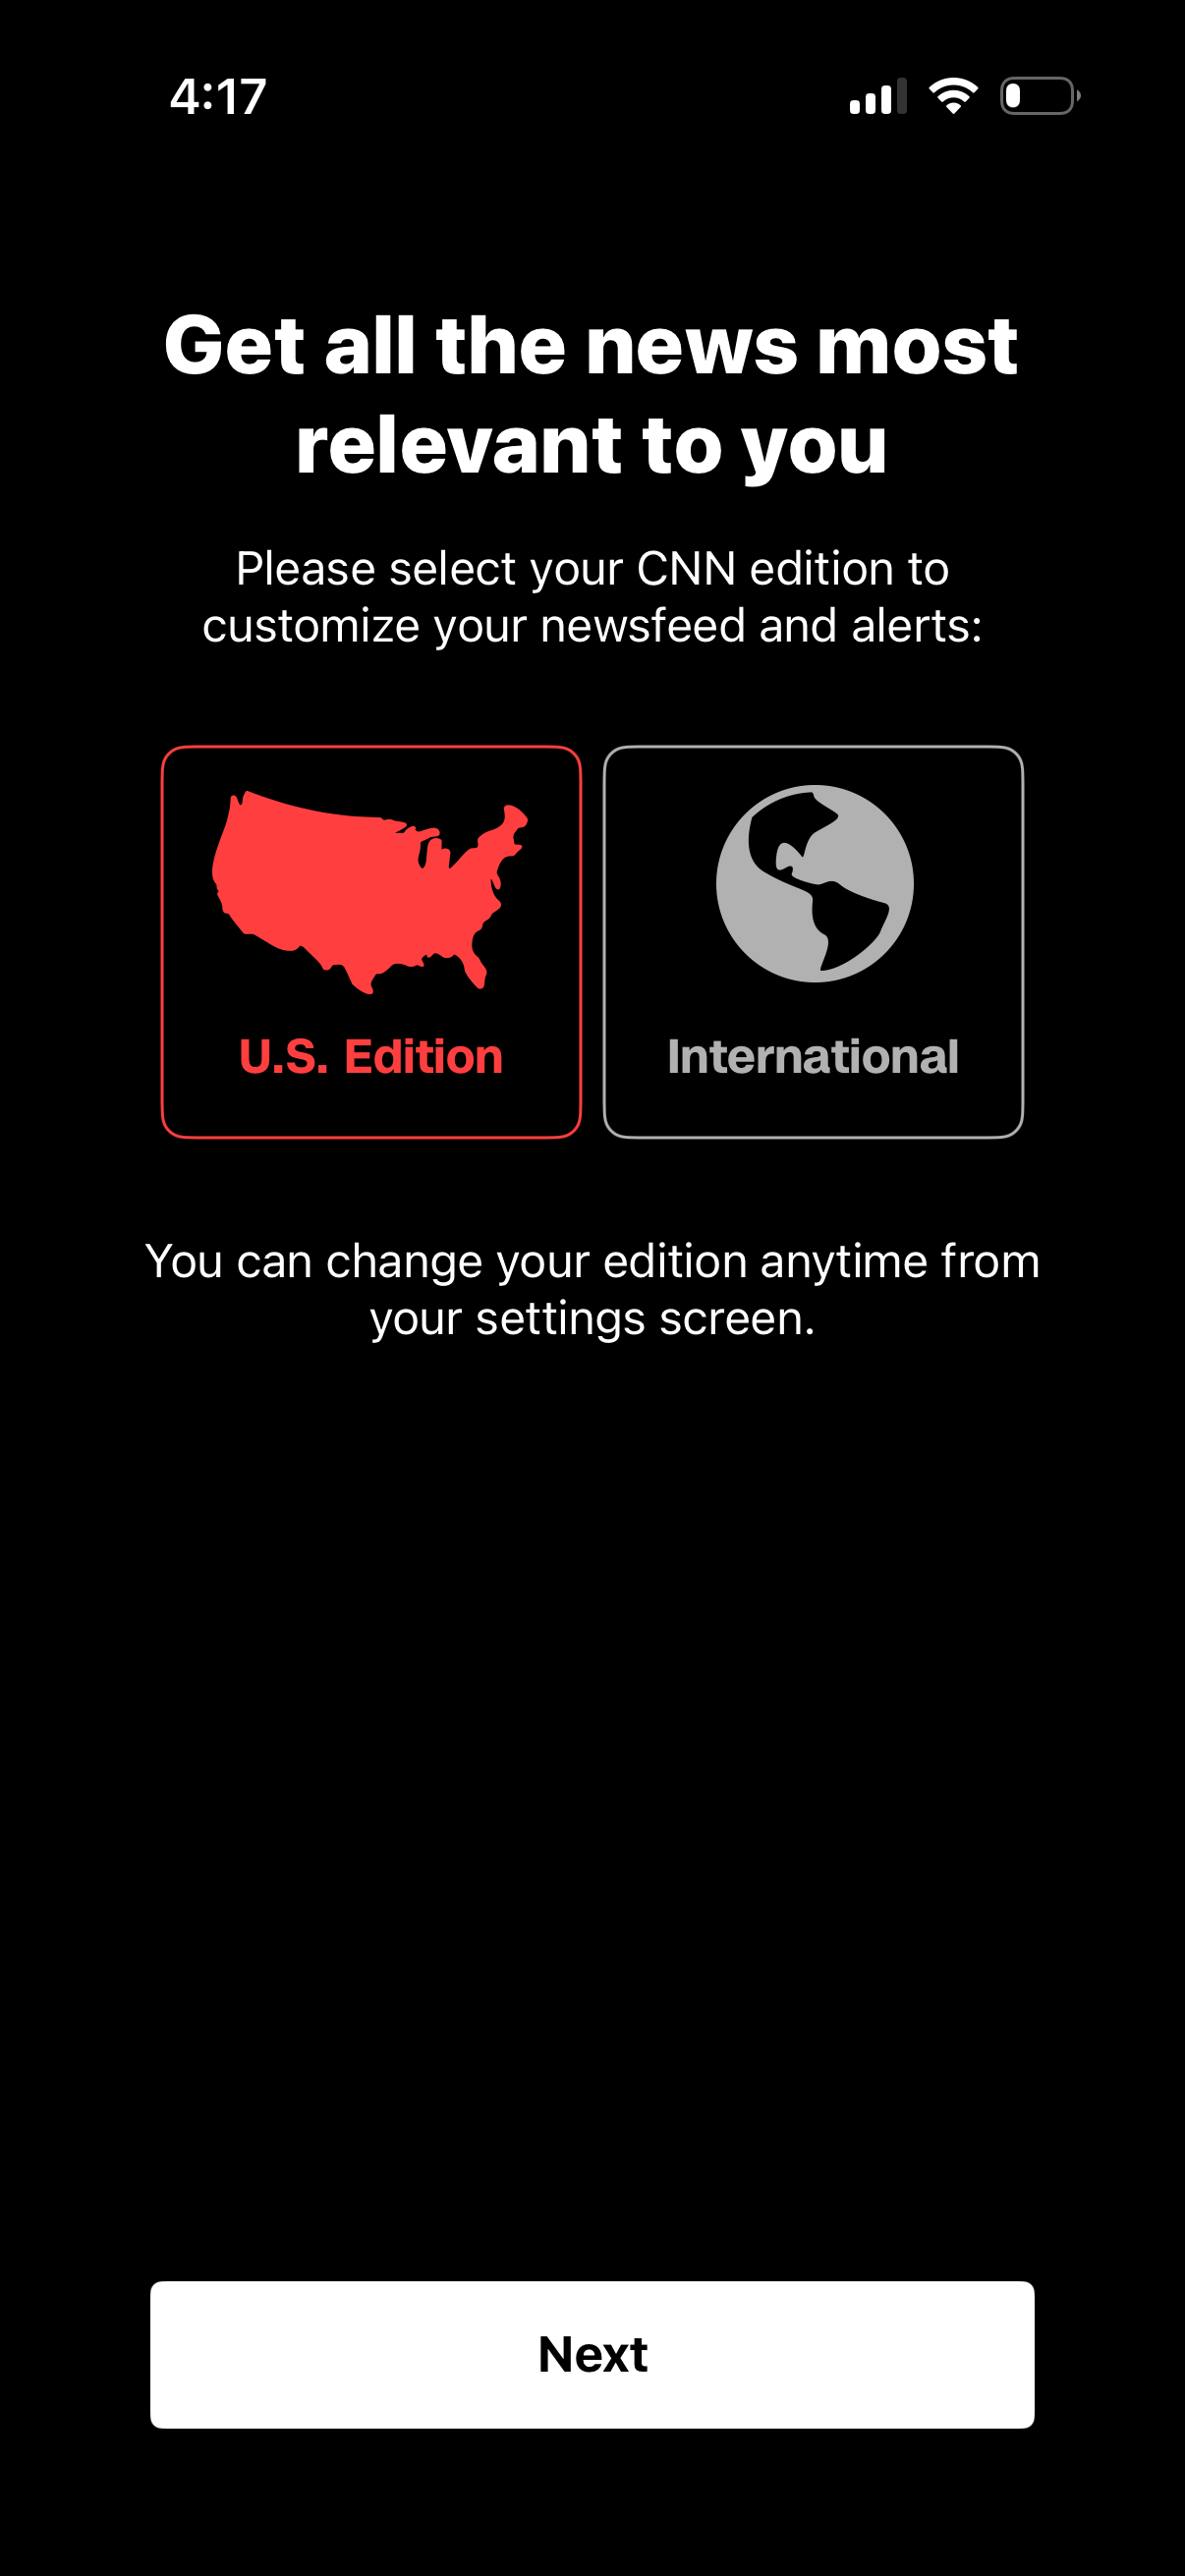
Cnn1206 × 2622opens the full image 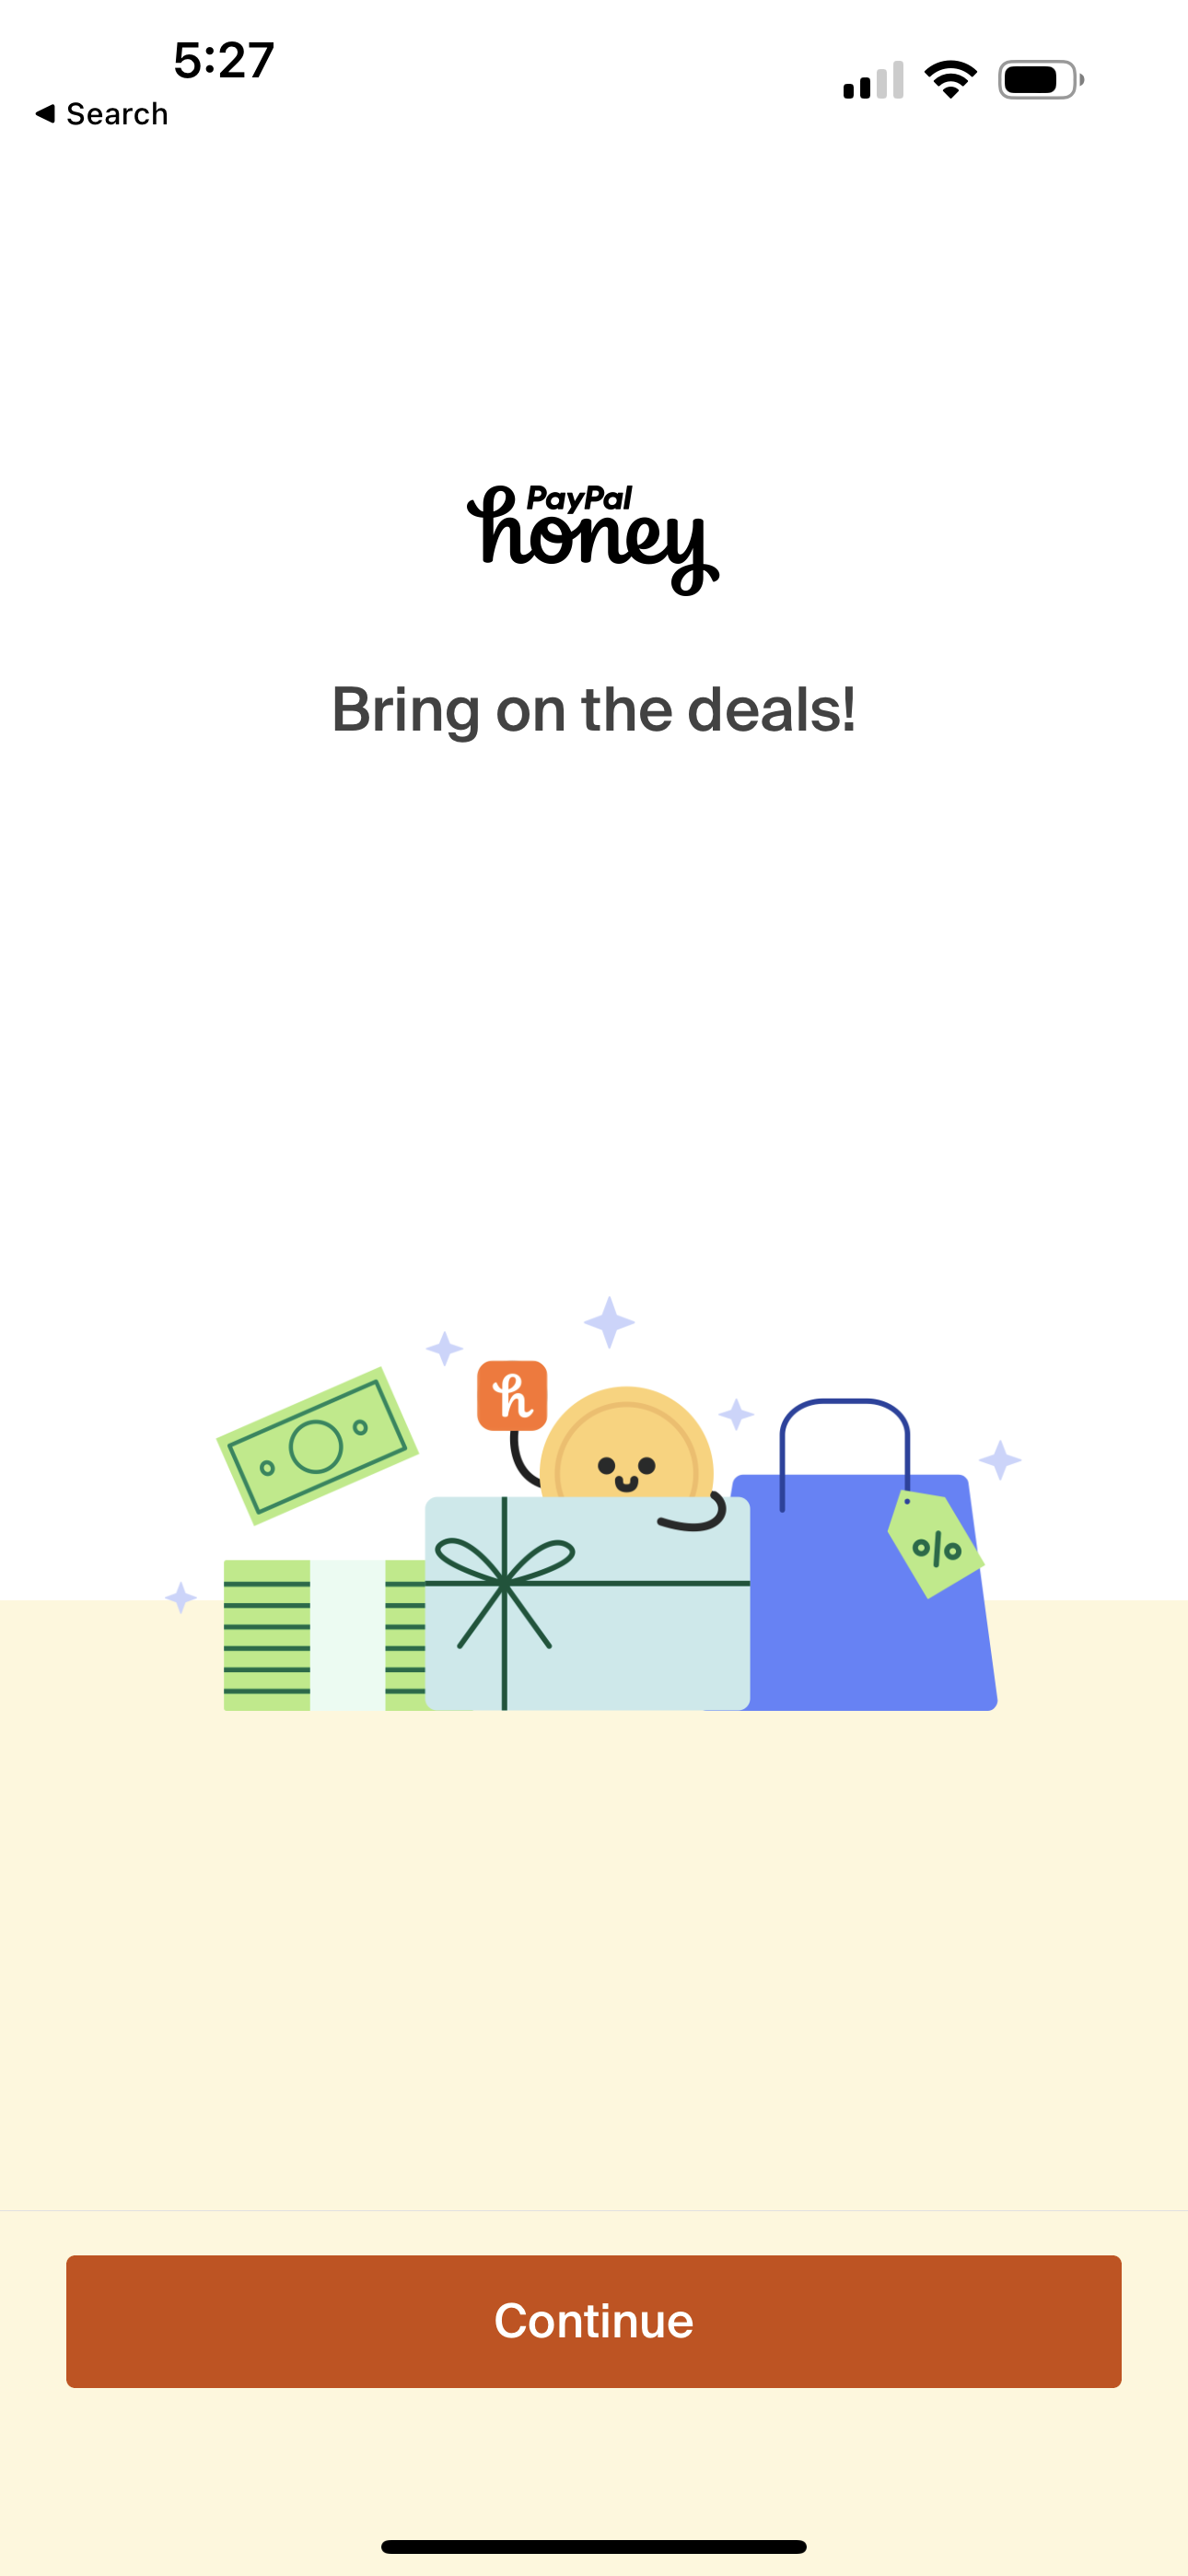
Honey1290 × 2796opens the full image
The numbers
| # | Stat | Computed from |
|---|---|---|
| [1] | Graphics & design: 115 annotations, 57 experiments, 11 companies; top areas PRICING 35, OFFER 20 | category_totals; category_top_area |
| [2] | Graphics & design is a n>=70 qualifying category (115 annotations) | category_totals |
| [3] | Pixelcut has 11 annotated experiments among top testers | top_testing_companies |
| [4] | PRICING high-impact share 53.8%, OFFER 66.4% corpus-wide | high_impact_share_by_area |
| [5] | Example pricing move: Dribbble collapsed three tiers ($4/$8/$99) to a single '$8/mo' headline with one CTA | qualitative PRICING dribbble |
Methodology
Universe is 115 area annotations from 11 graphics & design companies within 2,160 annotations over 1,126 detected experiments in the ~800 tracked-apps corpus. Concentrated sample; areas LLM-annotated from observed before/after screenshots, July 2026; only n>=8 cells reported.
Sources
- [1]
Lazyweb Research analysis of 115 graphics & design experiments (11 apps), July 2026
Area annotations for graphics & design companies within 2,160 annotations.
- [2]
Lazyweb Research analysis of category annotation totals (~800 tracked apps), July 2026
Annotations by app-store category.
- [3]
Lazyweb Research analysis of top testing companies (~800 tracked apps), July 2026
Concentration caveat: 11 companies.
- [4]
Lazyweb Research analysis of per-area high-impact share (n>=30 areas), July 2026
Model-assigned impact 4+/5 shares.
- [5]
Lazyweb Research analysis of 2,160 annotated experiments (~800 tracked apps), July 2026
Named example is a single observed diff with inferred rationale.
Source: Lazyweb Research — proprietary analysis of real, in-market app screens. Cite as Lazyweb Research, 2026-07-07.