What Page Areas Are Photo And Video Companies A/B Testing?
- By Ali Abouelatta
- n = 159
- Published
- Updated
- 2 min read
- experiments · pricing · mobile · paywall · monetization · ux-patterns
Short answer
Across 159 area-annotated experiments from photo & video companies tracked by Lazyweb Research (67 experiments, 11 companies), the hero leads (34 annotations), then pricing (27) and CTA (22) source[1]. Photo & video is a comparatively concentrated category — 159 annotations from just 11 companies — so read the mix as a handful of heavy testers source[1]source[2]. The hero-then-pricing shape mirrors the corpus norm source[1].
Photo & video companies test HERO most (34 of 159 area annotations), then pricing (27) and CTA (22) — Lazyweb Research analysis of 11 apps, July 2026.
Bar chart · Annotations
Annotations — Photo & video top tested areas
One block is about 1.2 Annotations
- HERO
- 34
- PRICING
- 27
- CTA
- 22
The finding: hero, then pricing, then CTA
Photo & video contributes 159 annotations across 67 experiments and 11 companies source[1]. Its top areas are HERO (34), PRICING (27), and CTA (22) source[1]. This is the classic top-of-funnel-plus-paywall shape: test the hero promise, the price, and the button source[1]. Because only 11 companies are involved, a few prolific testers (CapCut, VEED, Pixelcut, PictureThis appear among top testers) drive much of this source[2].
Photo & video top tested areas
Cells with n>=8 source[1]:
| Area | Annotations |
|---|---|
| HERO | 34 |
| PRICING | 27 |
| CTA | 22 |
A representative pricing move from this category: raising discounted prices ($7.99->$9.99 monthly, $74.99->$89.99 yearly) while keeping the same strikethrough anchors and urgency badge — a price test disguised as the same deal source[3].
How to apply it
For an AI-photo or video-editing app, the peer pattern is hero + paywall pricing + CTA source[1]. The disguised-price-raise pattern (hold the crossed-out anchor, raise the actual charge) is worth testing if your paywall already leans on strikethrough pricing source[3]. Since CTA-area edits are rated high-impact only ~27% of the time corpus-wide, prioritize the pricing test over pure button-copy tweaks source[4].
Caveats
159 annotations from only 11 companies means this is a concentrated cut — treat it as illustrative of a few heavy testers, not the whole vertical source[2]. Only n>=8 cells shown source[1]. Named examples are single observed diffs source[3].
Real in-market screens
Screens from real, in-market apps, tracked by Lazyweb Research.
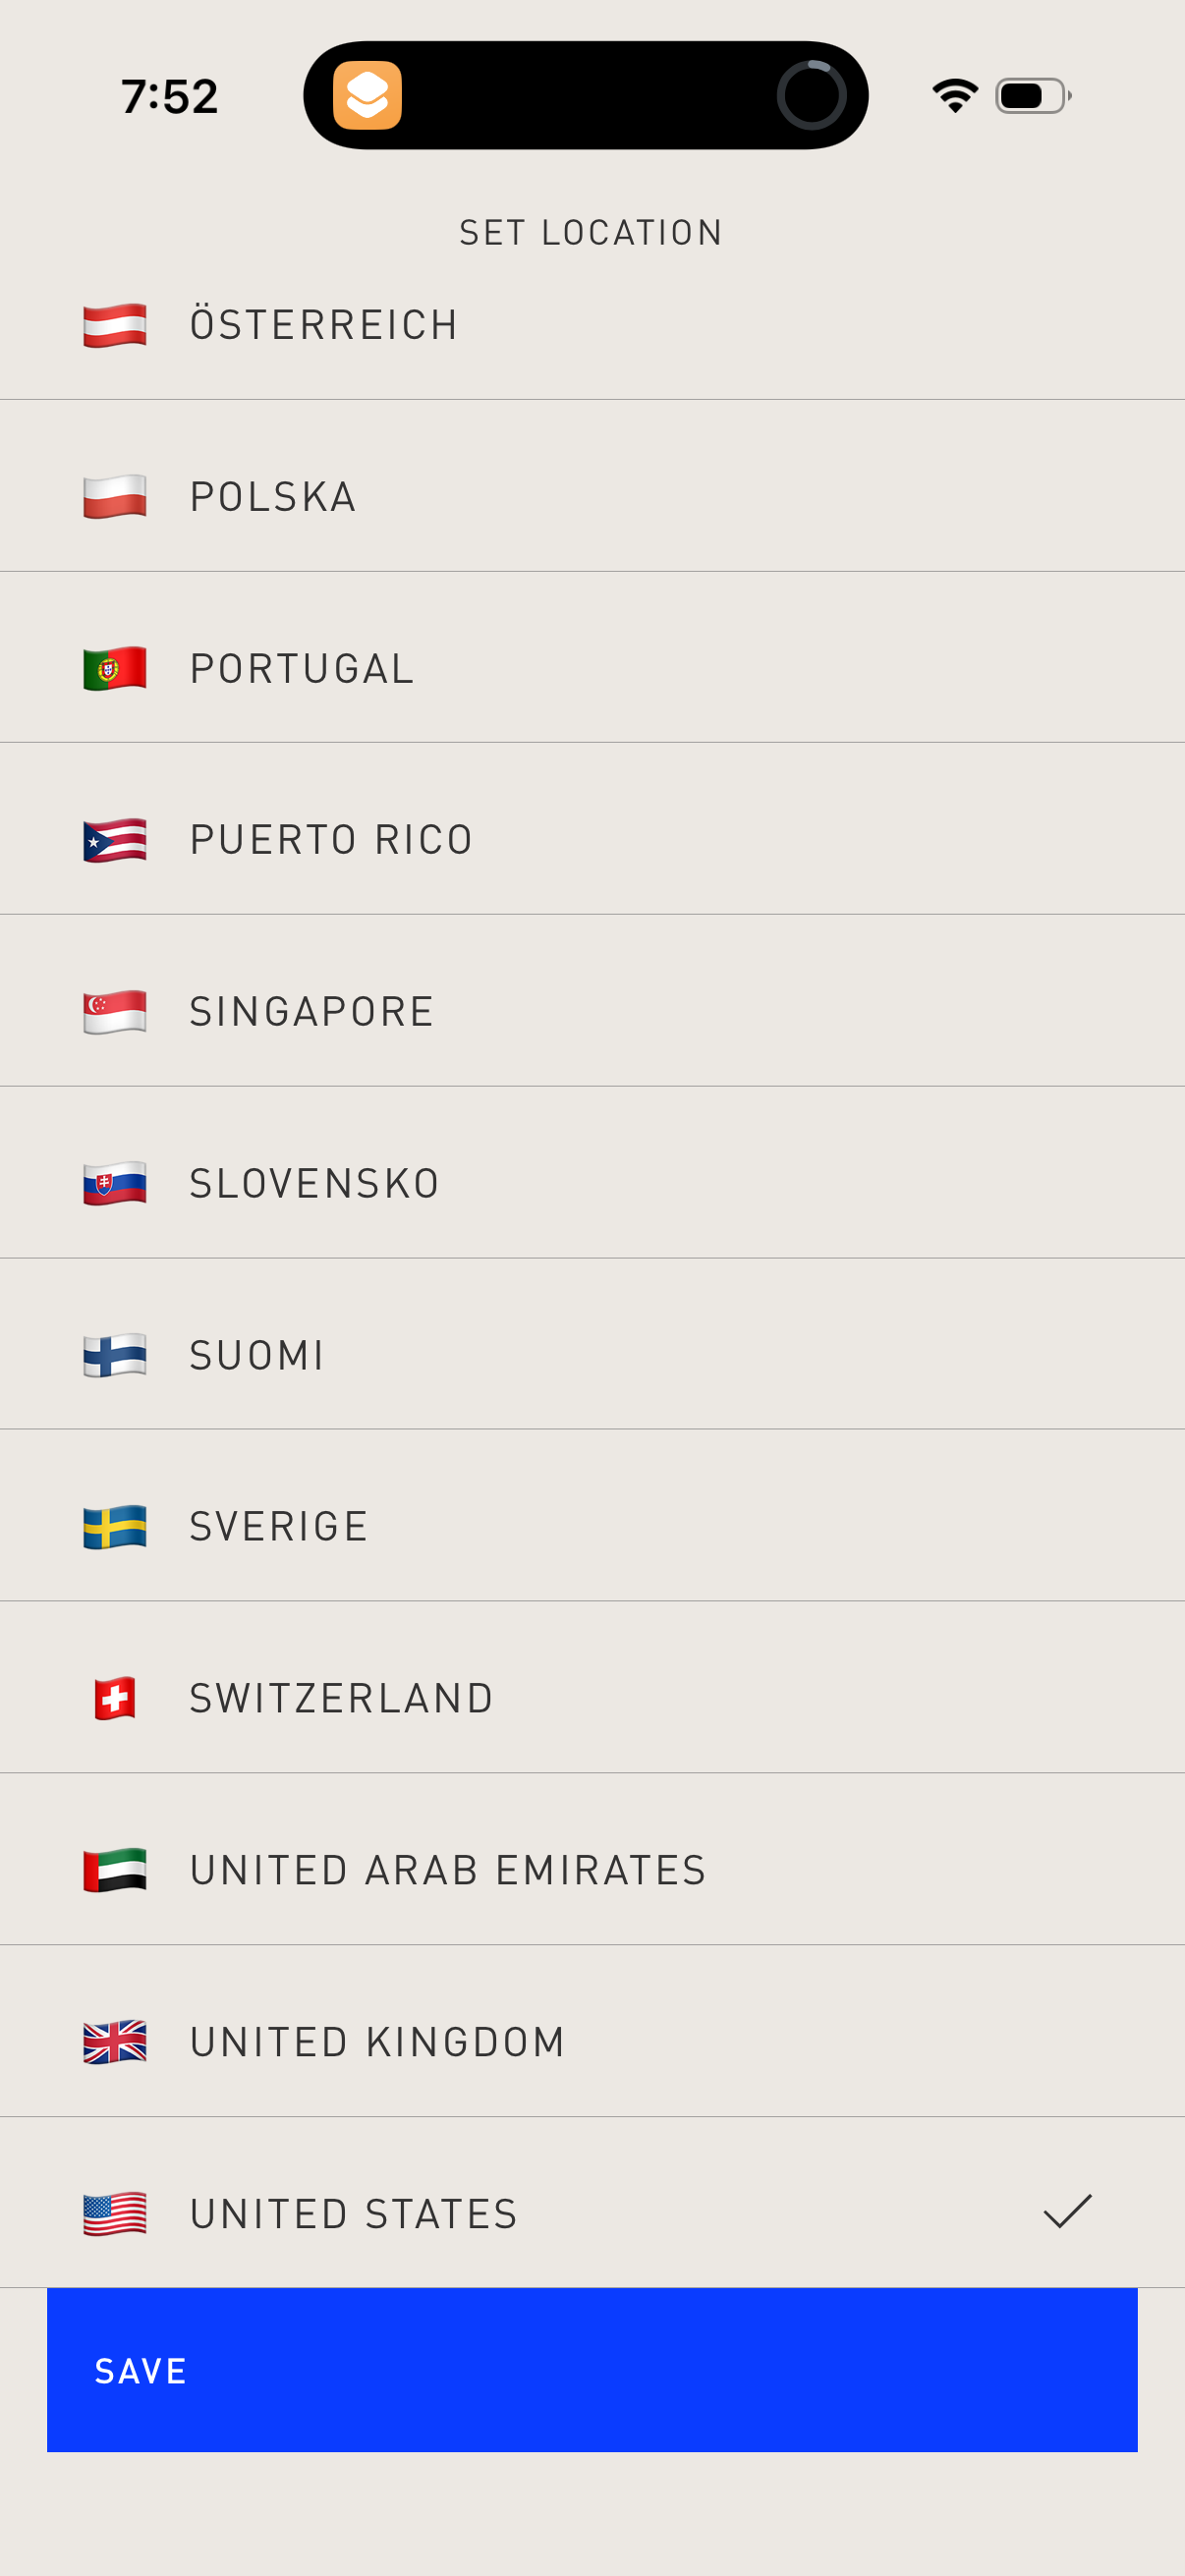
Confirmed1206 × 2622opens the full image 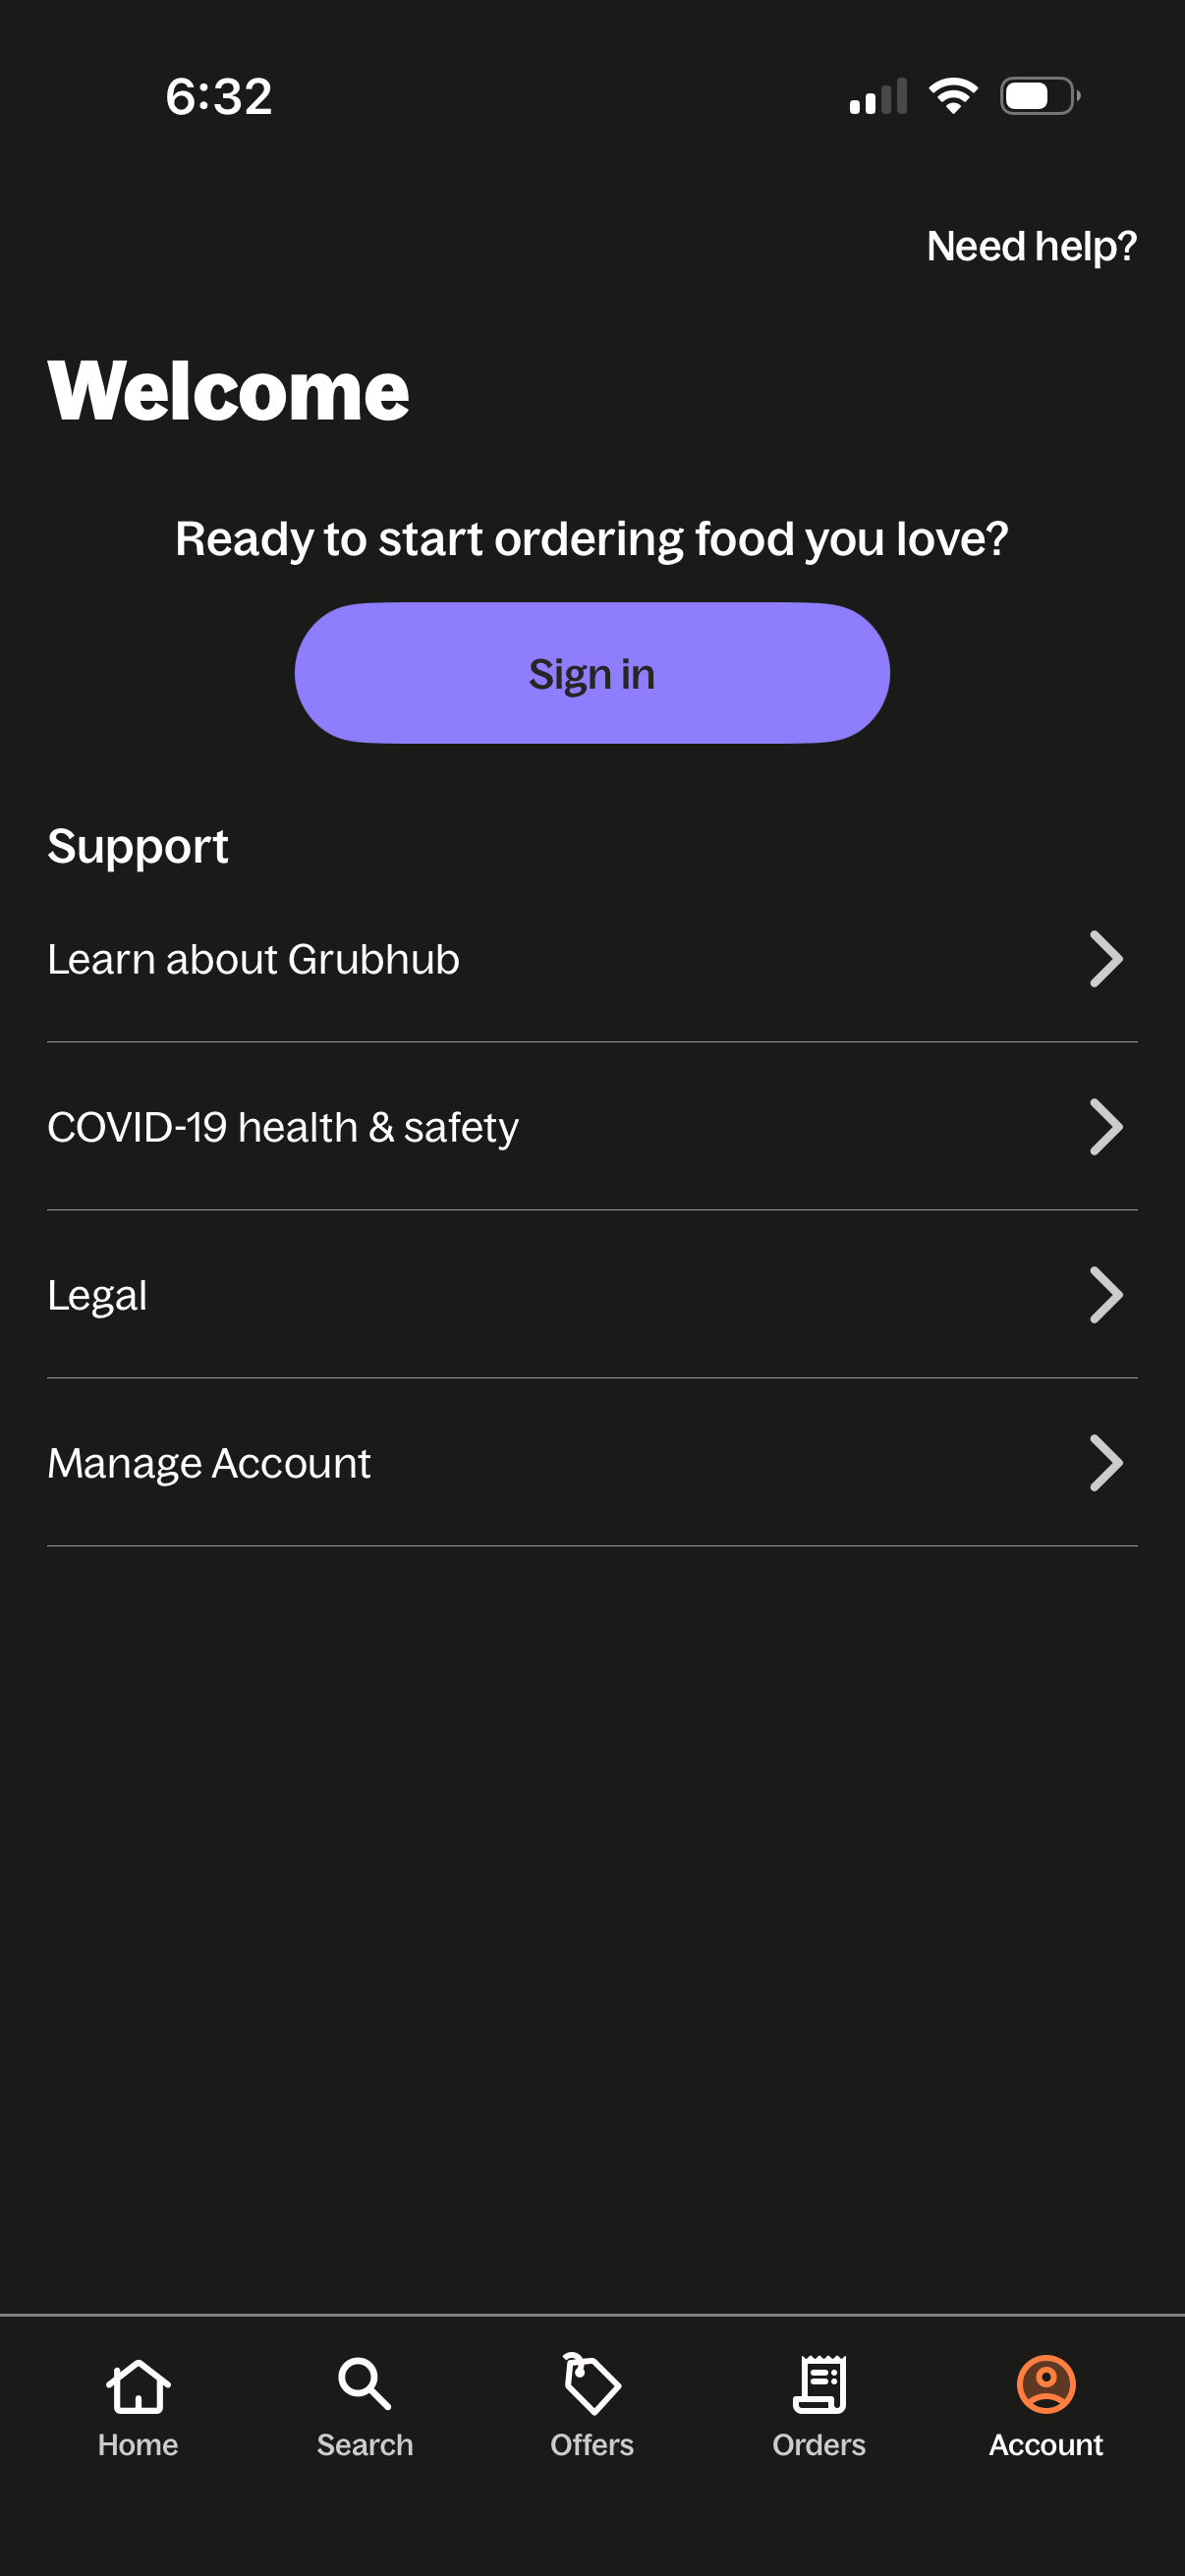
Grubhub1206 × 2622opens the full image 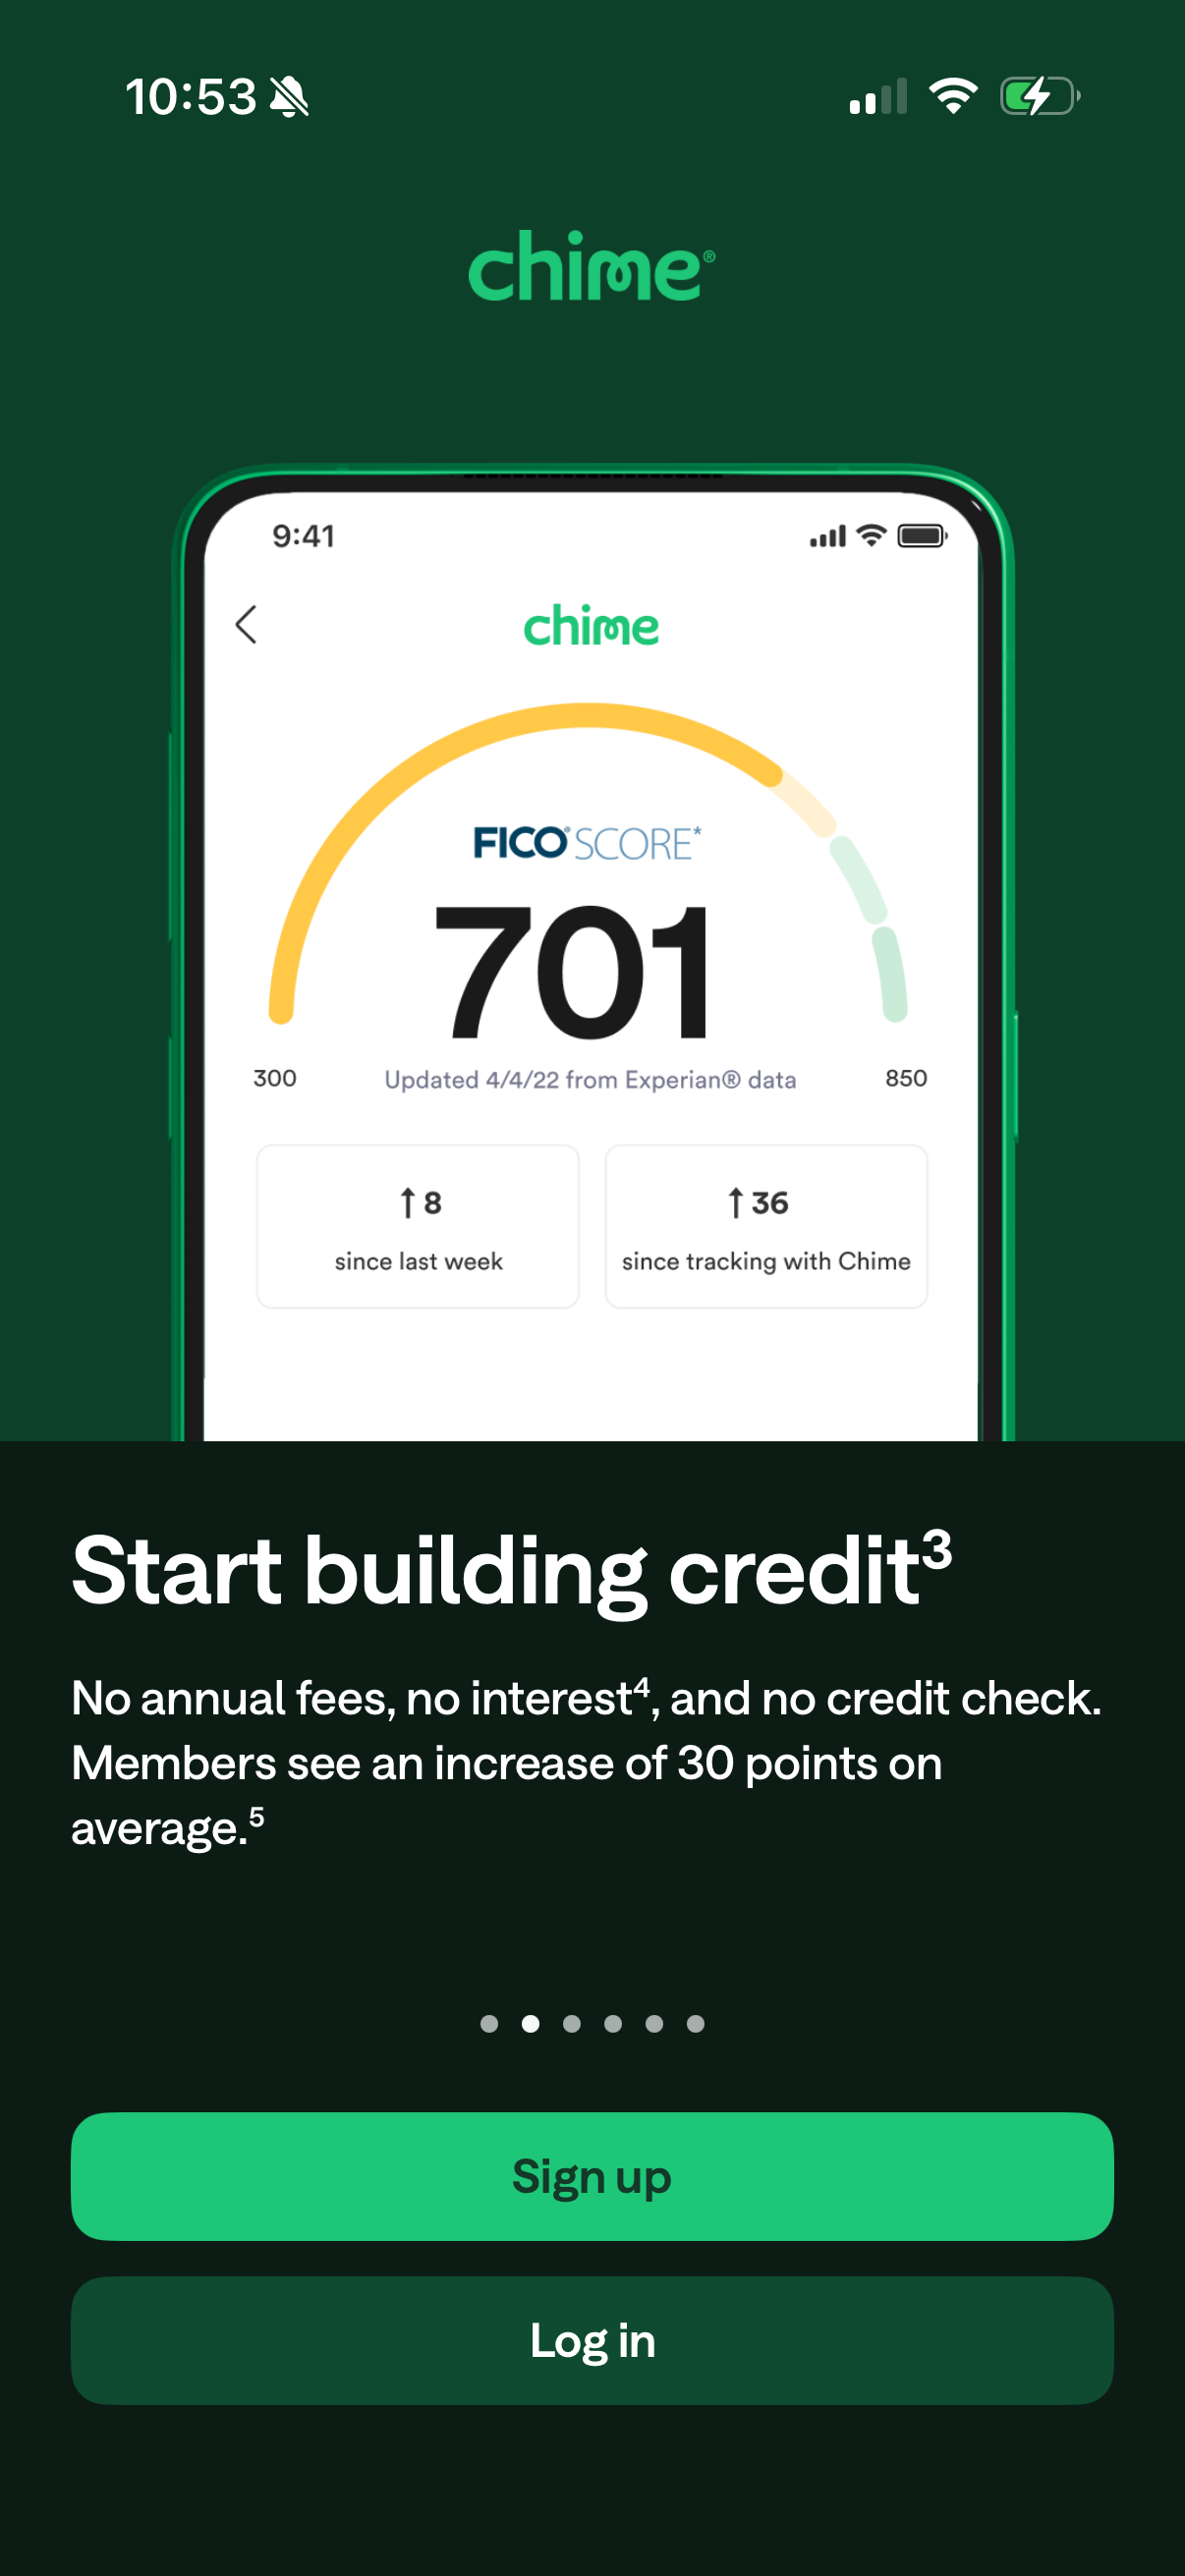
Chime1206 × 2622opens the full image 
Rebel1170 × 2532opens the full image
The numbers
| # | Stat | Computed from |
|---|---|---|
| [1] | Photo & video: 159 annotations, 67 experiments, 11 companies; top areas HERO 34, PRICING 27, CTA 22 | category_totals; category_top_area |
| [2] | Photo & video top testers include CapCut, VEED (11), Pixelcut (11), PictureThis (13) | top_testing_companies |
| [3] | Example pricing move: CapCut raised discounted prices $7.99->$9.99 monthly and $74.99->$89.99 yearly with same anchors/urgency | qualitative PRICING capcut |
| [4] | CTA area high-impact share 27.2% corpus-wide | high_impact_share_by_area |
Methodology
Universe is 159 area annotations from 11 photo & video companies within 2,160 annotations over 1,126 detected experiments in the ~800 tracked-apps corpus. Concentrated sample; areas LLM-annotated from observed before/after screenshots, July 2026; only n>=8 cells reported.
Sources
- [1]
Lazyweb Research analysis of 159 photo & video experiments (11 apps), July 2026
Area annotations for photo & video companies within 2,160 annotations.
- [2]
Lazyweb Research analysis of top testing companies (~800 tracked apps), July 2026
Concentration caveat: 11 companies.
- [3]
Lazyweb Research analysis of 2,160 annotated experiments (~800 tracked apps), July 2026
Named example is a single observed diff with inferred rationale.
- [4]
Lazyweb Research analysis of per-area high-impact share (n>=30 areas), July 2026
Model-assigned impact 4+/5 shares.
Source: Lazyweb Research — proprietary analysis of real, in-market app screens. Cite as Lazyweb Research, 2026-07-07.