Web Vs Mobile: Which Page Areas Do Companies A/B Test On Each?
- By Ali Abouelatta
- n = 2,160
- Published
- Updated
- 2 min read
- web · mobile · experiments · paywall · landing-page · ux-patterns
Short answer
Across 2,160 area-annotated experiments tracked by Lazyweb Research (1,280 mobile / 880 web), the tested surfaces split cleanly by platform: NAV, FORM, and ANNOUNCEMENT BAR are essentially 100% web, while OFFER (85% mobile), PRICING (84% mobile), and HEADER (100% mobile) are paywall-driven mobile areas source[1]source[2]. The hero is the one area both platforms test heavily, splitting 272 web / 216 mobile source[3]. Detected experiments overall are 92% mobile (4,449 of 4,814), so web reads are absolute counts only source[4].
NAV, FORM and ANNOUNCEMENT BAR are 100% web while OFFER and PRICING run ~85% mobile — Lazyweb Research analysis of 2,160 annotated experiments (1,280 mobile / 880 web), July 2026.
Bar chart · Mobile
Mobile — Where each platform concentrates
One block is about 9.1 Mobile
- NAV
- 0
- FORM
- 0
- ANNOUNCEMENT BAR
- 0
- OFFER
- 255
- PRICING
- 254
- HERO
- 216
- CTA
- 141
- SOCIAL PROOF
- 14
The finding: platforms test different real estate
Of the 2,160 annotations, 1,280 are mobile (from 147 companies) and 880 are web (from 106 companies) source[1]. The area mix differs sharply by platform: web owns NAV (all 144), FORM (all 37), and ANNOUNCEMENT BAR (all 63), while mobile owns the monetization furniture — OFFER runs 255 mobile / 46 web, PRICING 254 mobile / 47 web, and HEADER is 100% mobile (29) source[2]source[3]. That reflects what each surface is for: mobile experiments concentrate on paywalls, web experiments on marketing pages source[2].
Where each platform concentrates
Selected areas by platform split source[2]source[3]:
| Area | Mobile | Web | Skew |
|---|---|---|---|
| NAV | 0 | 144 | web-only |
| FORM | 0 | 37 | web-only |
| ANNOUNCEMENT BAR | 0 | 63 | web-only |
| OFFER | 255 | 46 | ~85% mobile |
| PRICING | 254 | 47 | ~84% mobile |
| HERO | 216 | 272 | mixed |
| CTA | 141 | 91 | mostly mobile |
| SOCIAL PROOF | 14 | 34 | web-leaning |
HERO is the shared battleground, tested heavily on both source[3].
How to apply it
Match your test backlog to your platform's tested surfaces: on mobile, the corpus concentrates on offer framing and pricing inside the paywall; on web, on nav de-chroming, hero, and signup forms source[2]source[3]. If you run both, the hero is the one area worth testing on each — it is the only high-volume area split roughly evenly source[3]. Don't force web-only patterns (announcement bars, nav cuts) onto a mobile paywall, or vice versa source[2].
Caveats
Detected experiments are 92.4% mobile (4,449) vs 7.6% web (365), so the web corpus is thin and its area cuts are absolute counts only, not percentage league tables source[4]. Platform splits are annotation counts, not lift source[4]. Company counts overlap across platforms source[1].
Real in-market screens
Screens from real, in-market apps, tracked by Lazyweb Research.

Translate Now1206 × 2622opens the full image 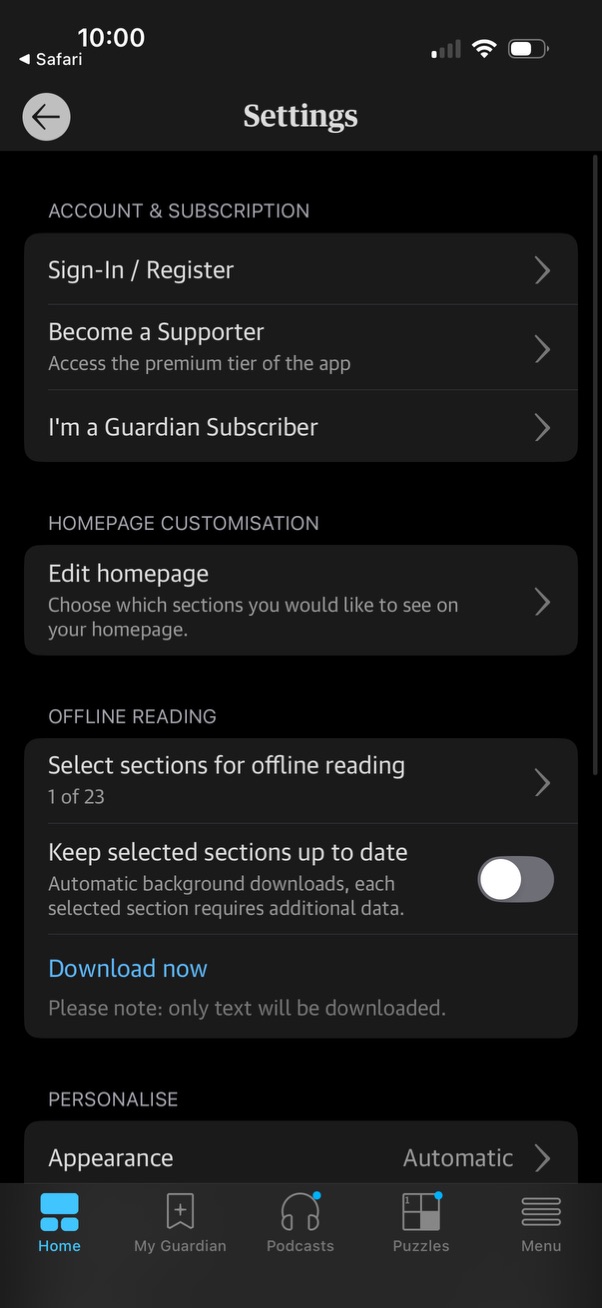
The Gaurdian602 × 1308opens the full image 
Spotify1125 × 2436opens the full image 
Epoch Times1290 × 2796opens the full image
The numbers
| # | Stat | Computed from |
|---|---|---|
| [1] | 2,160 annotations = 1,280 mobile (147 companies) + 880 web (106 companies) | platform_split_annotations; universe |
| [2] | Web-only areas: NAV (144), FORM (37), ANNOUNCEMENT BAR (63). Mobile-heavy: OFFER 255/46, PRICING 254/47, HEADER 29 all mobile | platform_area_split; area_NAV; area_FORM; area_ANNOUNCEMENT_BAR; area_OFFER; area_PRICING; area_HEADER |
| [3] | HERO 272 web / 216 mobile; CTA 141 mobile / 91 web; SOCIAL PROOF 34 web / 14 mobile | area_HERO; area_CTA; area_SOCIAL_PROOF |
| [4] | Detected experiments: mobile 4,449 (92.4%) / web 365 (7.6%) of 4,814 | platform_split_experiments |
Methodology
Universe is 2,160 area annotations (1,280 mobile / 880 web) over 1,126 detected experiments within 4,814 detected experiments in the ~800 tracked-apps corpus. Splits are annotation counts from LLM-annotated before/after screenshots, July 2026; web is thin, so web cuts are absolute counts only.
Sources
- [1]
Lazyweb Research analysis of 2,160 annotated experiments (~800 tracked apps), July 2026
Platform split of area annotations; 1,280 mobile / 880 web.
- [2]
Lazyweb Research analysis of platform-by-area splits (~800 tracked apps), July 2026
Per-area mobile/web counts within 2,160 annotations.
- [3]
Lazyweb Research analysis of per-area platform counts (~800 tracked apps), July 2026
HERO/CTA/SOCIAL PROOF web-mobile breakdowns.
- [4]
Lazyweb Research analysis of 4,814 detected experiments (~800 tracked apps), July 2026
Web is thin (365 experiments); web cuts are absolute counts only.
Source: Lazyweb Research — proprietary analysis of real, in-market app screens. Cite as Lazyweb Research, 2026-07-07.
Explore the evidence
- Full 45-frame August 2026 capture
- Three captured screens · August 2026