Hard Vs Soft Paywall: Do Subscription And Advertising Apps Differ?
- By Ali Abouelatta
- n = 1,890
- Published
- Updated
- 2 min read
- paywall · monetization · pricing · mobile · saas
Short answer
Among pure-subscription companies in the Lazyweb Research corpus, 489 of 1,890 paywall screens (25.9%) show a visible exit, and 96 of 164 companies (58.5%) show one somewhere source[1]. Subscription+Advertising hybrids are slightly softer at 159 of 588 screens (27.0%) across 31 of 54 companies source[1]. Advertising-only apps are too small a sample (4 companies) to state a rate — 9 of 99 screens show an exit source[2].
Pure-subscription apps show a visible paywall exit on 25.9% of screens (489 of 1,890) — Lazyweb Research, July 2026.
Bar chart · Soft screens
Soft screens — Breakdown
One block is about 1746%
- Subscription (pure)
- 489/1,890
- Subscription + Advertising
- 159/588
- Advertising-only
- 9/99
The finding
Business model barely moves screen-level softness. Pure-subscription companies show a visible exit on 489 of 1,890 screens (25.9%); subscription+advertising hybrids on 159 of 588 (27.0%) source[1]. At the company level, 96 of 164 subscription companies (58.5%) run at least one soft paywall, mirroring the 57.5% all-corpus company rate source[1].
Breakdown
| Business model | Soft screens | Screen % | Soft companies |
|---|---|---|---|
| Subscription (pure) | 489/1,890 | 25.9% | 96/164 (58.5%) |
| Subscription + Advertising | 159/588 | 27.0% | 31/54 |
| Advertising-only | 9/99 | small sample | 4 companies |
Hybrids are marginally softer than pure subscription at the screen level source[1].
How to apply it and caveats
Do not expect your monetization model to dictate exit policy — subscription and hybrid apps land within about a percentage point of each other and of the corpus average source[1]source[2]. Design exit affordances by surface and vertical instead. Caveat: advertising-only is below the 8-company floor — 9 of 99 screens is an absolute count from just 4 companies, not a rate source[2]. All figures are lower bounds and what-shipped, not lift source[1].
Real in-market screens
Screens from real, in-market apps, tracked by Lazyweb Research.

Falou1170 × 2532opens the full image 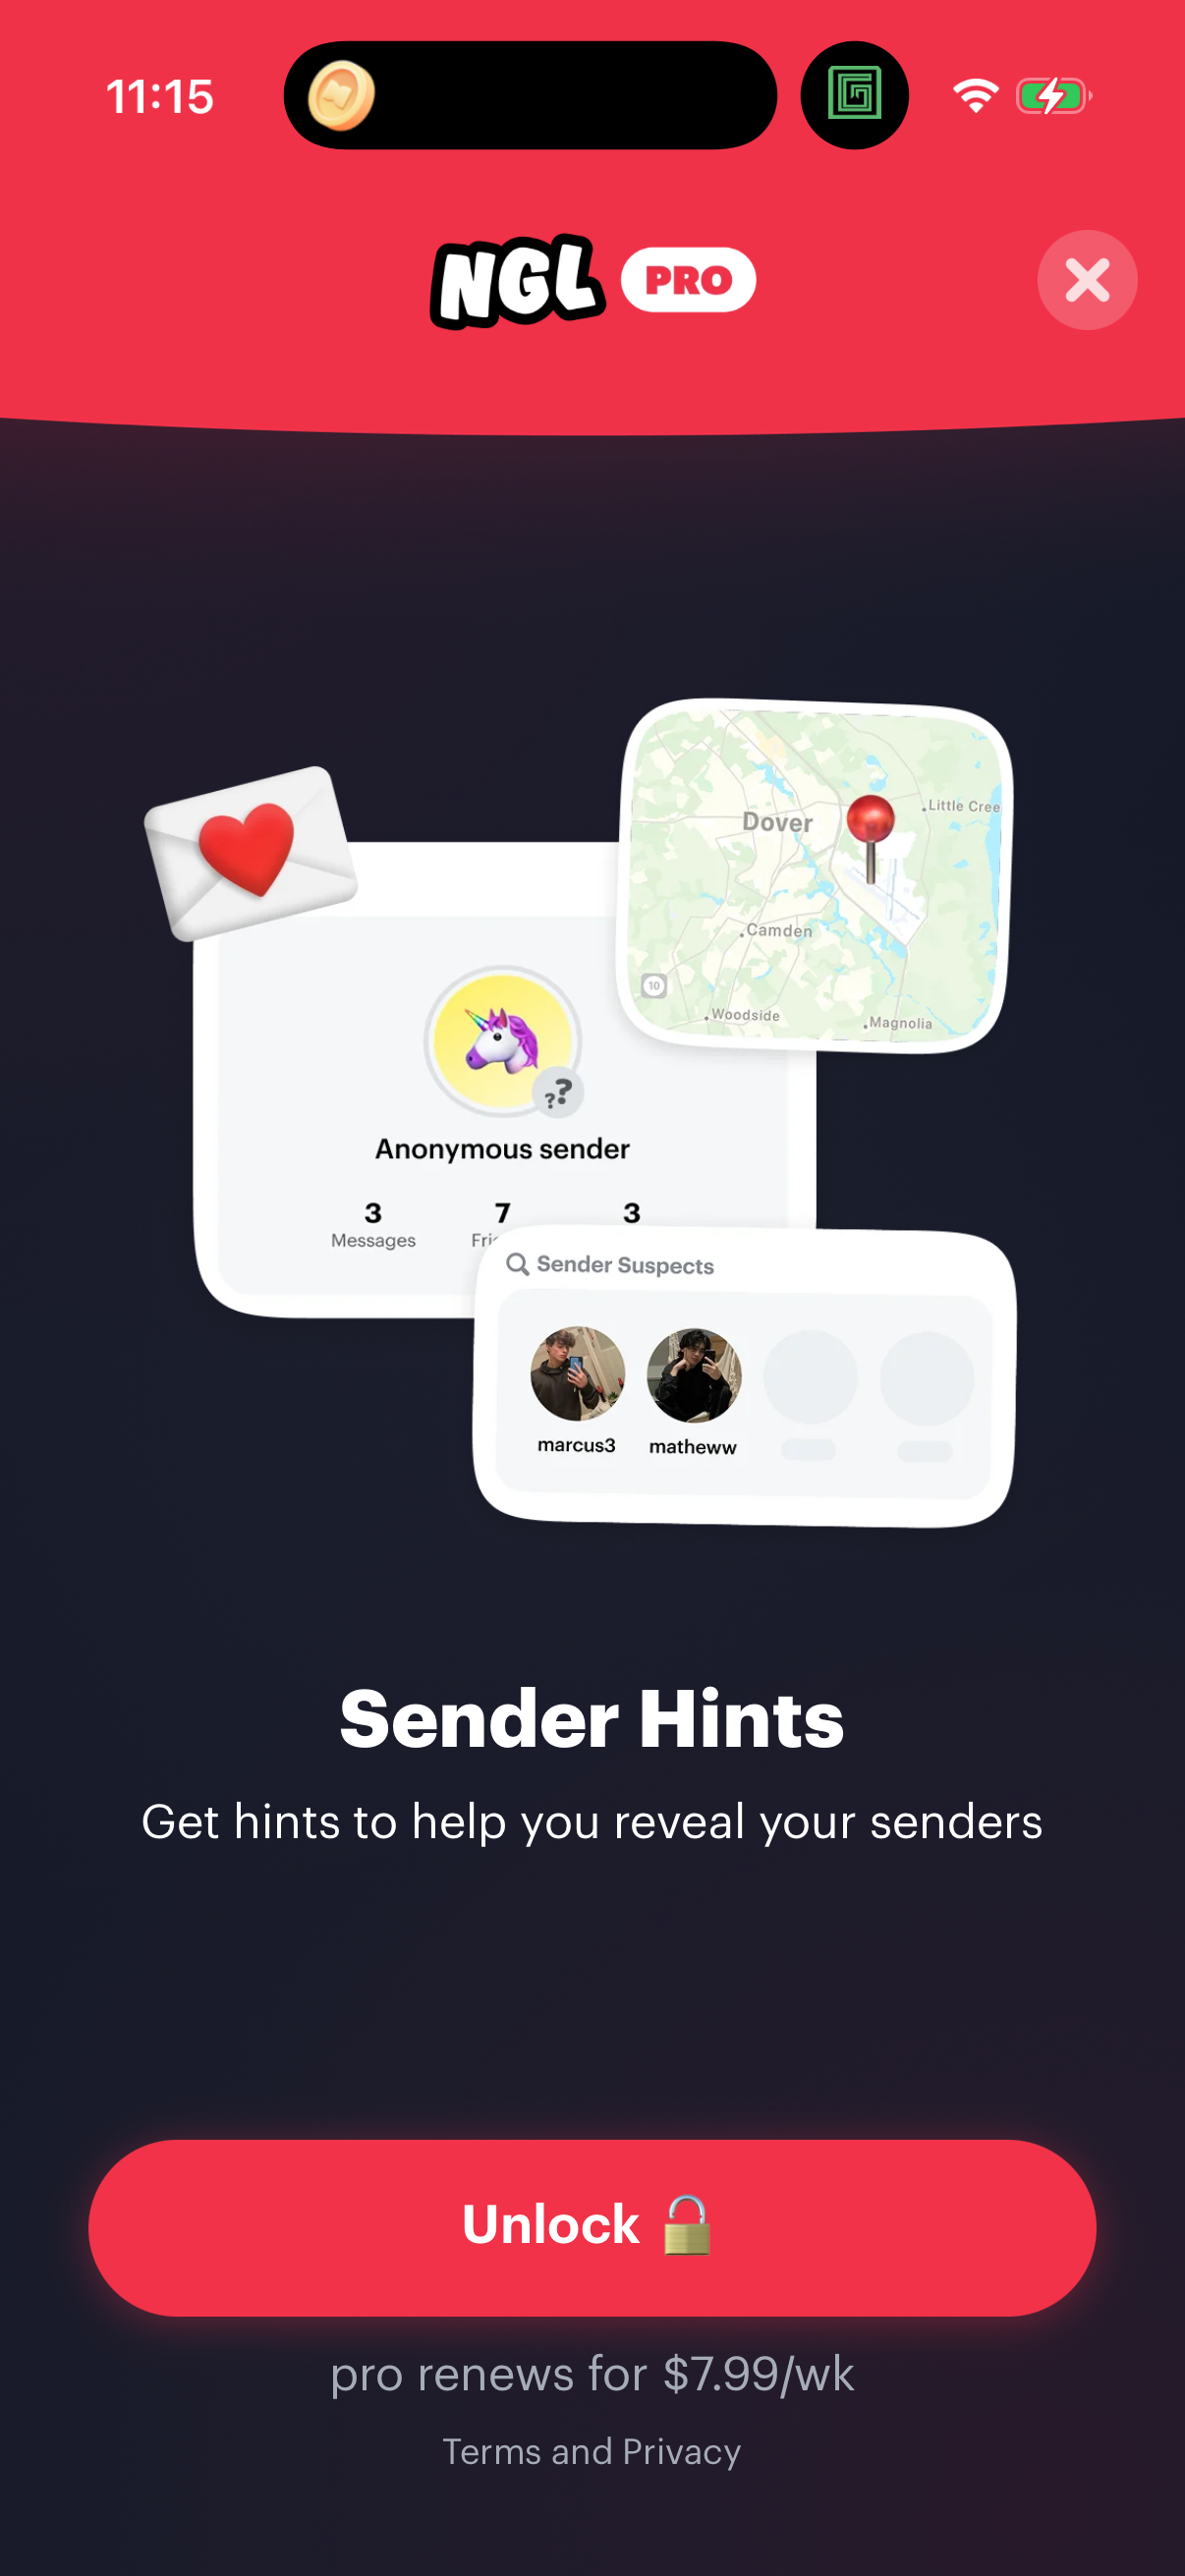
Ngl1206 × 2622opens the full image 
Flighty1206 × 2622opens the full image 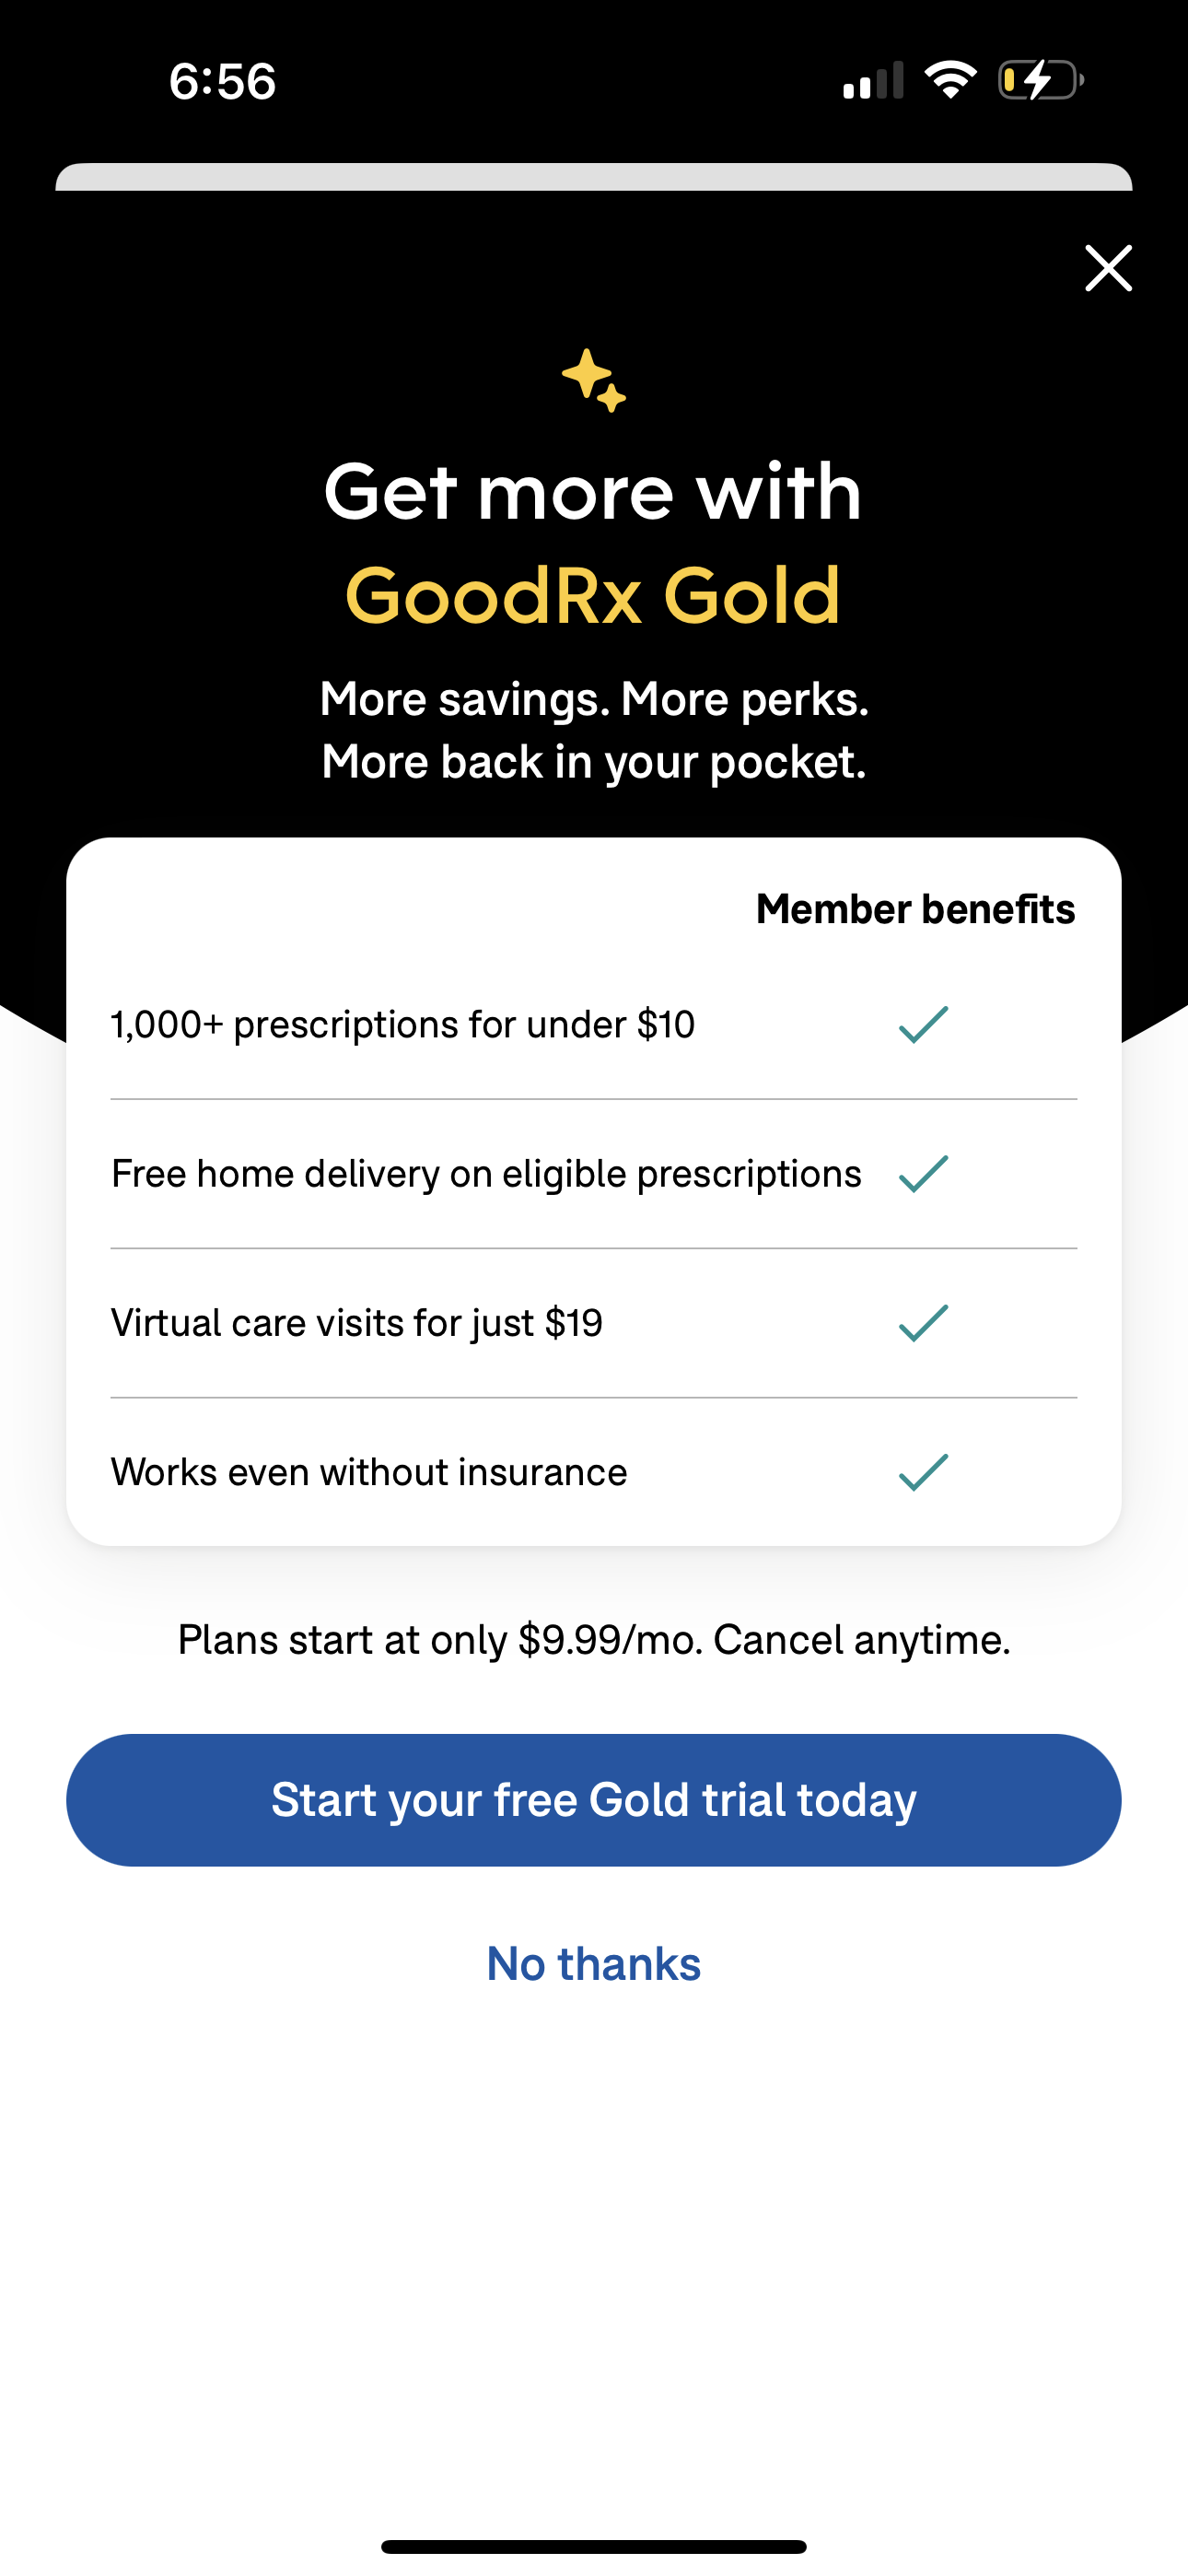
Goodrx1290 × 2796opens the full image
The numbers
| # | Stat | Computed from |
|---|---|---|
| [1] | Subscription 489/1,890 (25.9%), 96/164 companies (58.5%); hybrid 159/588 (27.0%), 31/54 companies | exit_share_subscription_model |
| [2] | Advertising-only 9 of 99 screens, 4 companies (below 8-company floor) | exit_share_advertising_model |
Methodology
Companies are bucketed by business_model metadata. Subscription and hybrid cuts clear the sample floor; advertising-only (4 companies) is reported as absolute counts only. Lower-bound, what-shipped prevalence. July 2026.
Sources
- [1]
Lazyweb Research analysis of 2,478 subscription and hybrid paywall screens (mobile app corpus), July 2026
Business-model buckets from company metadata; extraction-based lower bounds.
- [2]
Lazyweb Research analysis of 99 advertising-only paywall screens (4 companies, mobile app corpus), July 2026
Below the 8-company defensibility floor; published as absolute counts only, no percentage claim.
Source: Lazyweb Research — proprietary analysis of real, in-market app screens. Cite as Lazyweb Research, 2026-07-07.