Hard Vs Soft Paywall: How Common Is Each?
- By Ali Abouelatta
- n = 2,708
- Published
- Updated
- 2 min read
- paywall · monetization · ux-patterns · mobile · design
Short answer
Of 2,708 mobile paywall screens tracked by Lazyweb Research, 1,847 (68.2%) show no visible exit of any kind — the hard-paywall proxy — while the rest expose an X, a text link, or a restore-only escape source[1]. 229 of 252 companies have at least one hard paywall screen source[1]. Hard gates are the default pattern, but they coexist with soft variants inside the same apps source[1]source[2].
1,847 of 2,708 mobile paywall screens (68.2%) show no visible exit — the hard-paywall default — Lazyweb Research, July 2026.
Bar chart · Screens
Screens — Breakdown
One block is about 18.5 Screens
- No visible exit (hard)
- 1,847
- Visible X / close button
- 517
- 'Maybe later' text link
- 193
- Restore-only escape
- 151
The split
Using a mutually exclusive taxonomy where a visible X takes precedence, 1,847 of 2,708 screens (68.2%) are hard paywalls with no visible exit source[1]. The soft remainder breaks into a visible X/close button (517 screens), a 'Maybe later'-style text link (193 screens), and a restore-only escape (151 screens) source[2]. So hard gates outnumber every soft pattern combined by roughly two to one.
Breakdown
| Pattern | Screens | Companies |
|---|---|---|
| No visible exit (hard) | 1,847 | 229 |
| Visible X / close button | 517 | 120 |
| 'Maybe later' text link | 193 | 62 |
| Restore-only escape | 151 | 56 |
Counts are mutually exclusive; a visible X outranks a text link on the same screen source[2]. 229 of 252 companies ship at least one hard screen source[1].
How to apply it and caveats
Hard being the majority (68.2%) is a fact about what shipped, not evidence it wins — this corpus never measured conversion lift source[1]. Note the numerator gap: because a visible X takes precedence, the 68.2% hard figure and the 73.8% no-exit figure elsewhere differ slightly by classification rule source[1]. All hard-paywall counts are upper bounds symmetrically — undetected close controls would move screens from hard to soft source[1].
Real in-market screens
Screens from real, in-market apps, tracked by Lazyweb Research.
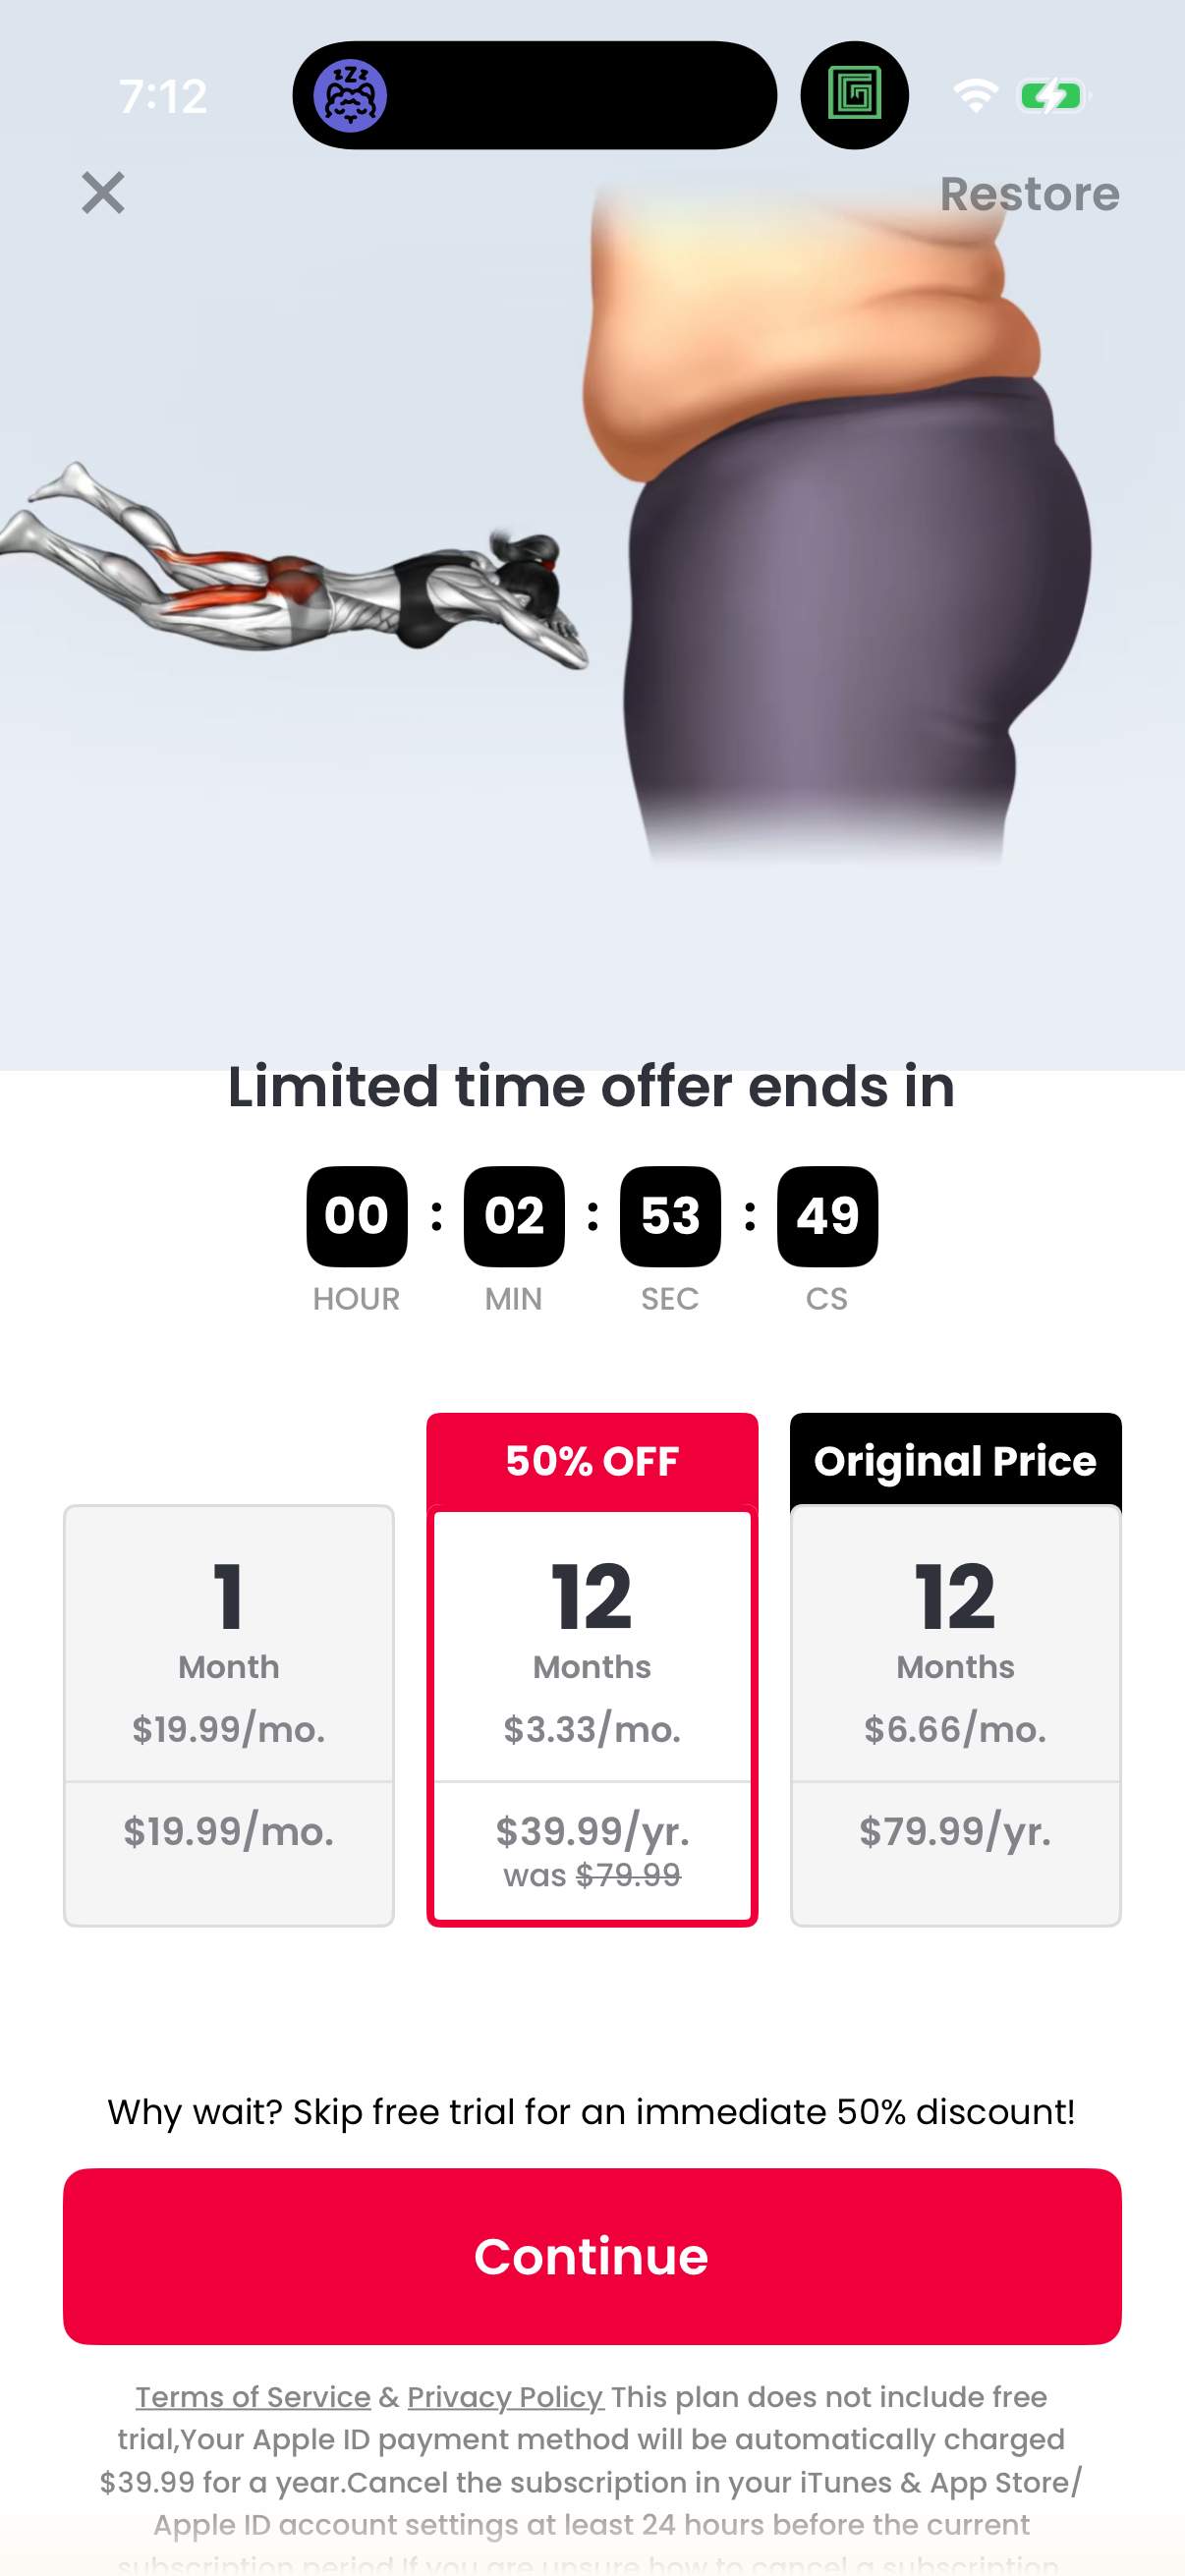
Justfit1206 × 2622opens the full image 
Adobe1170 × 2532opens the full image 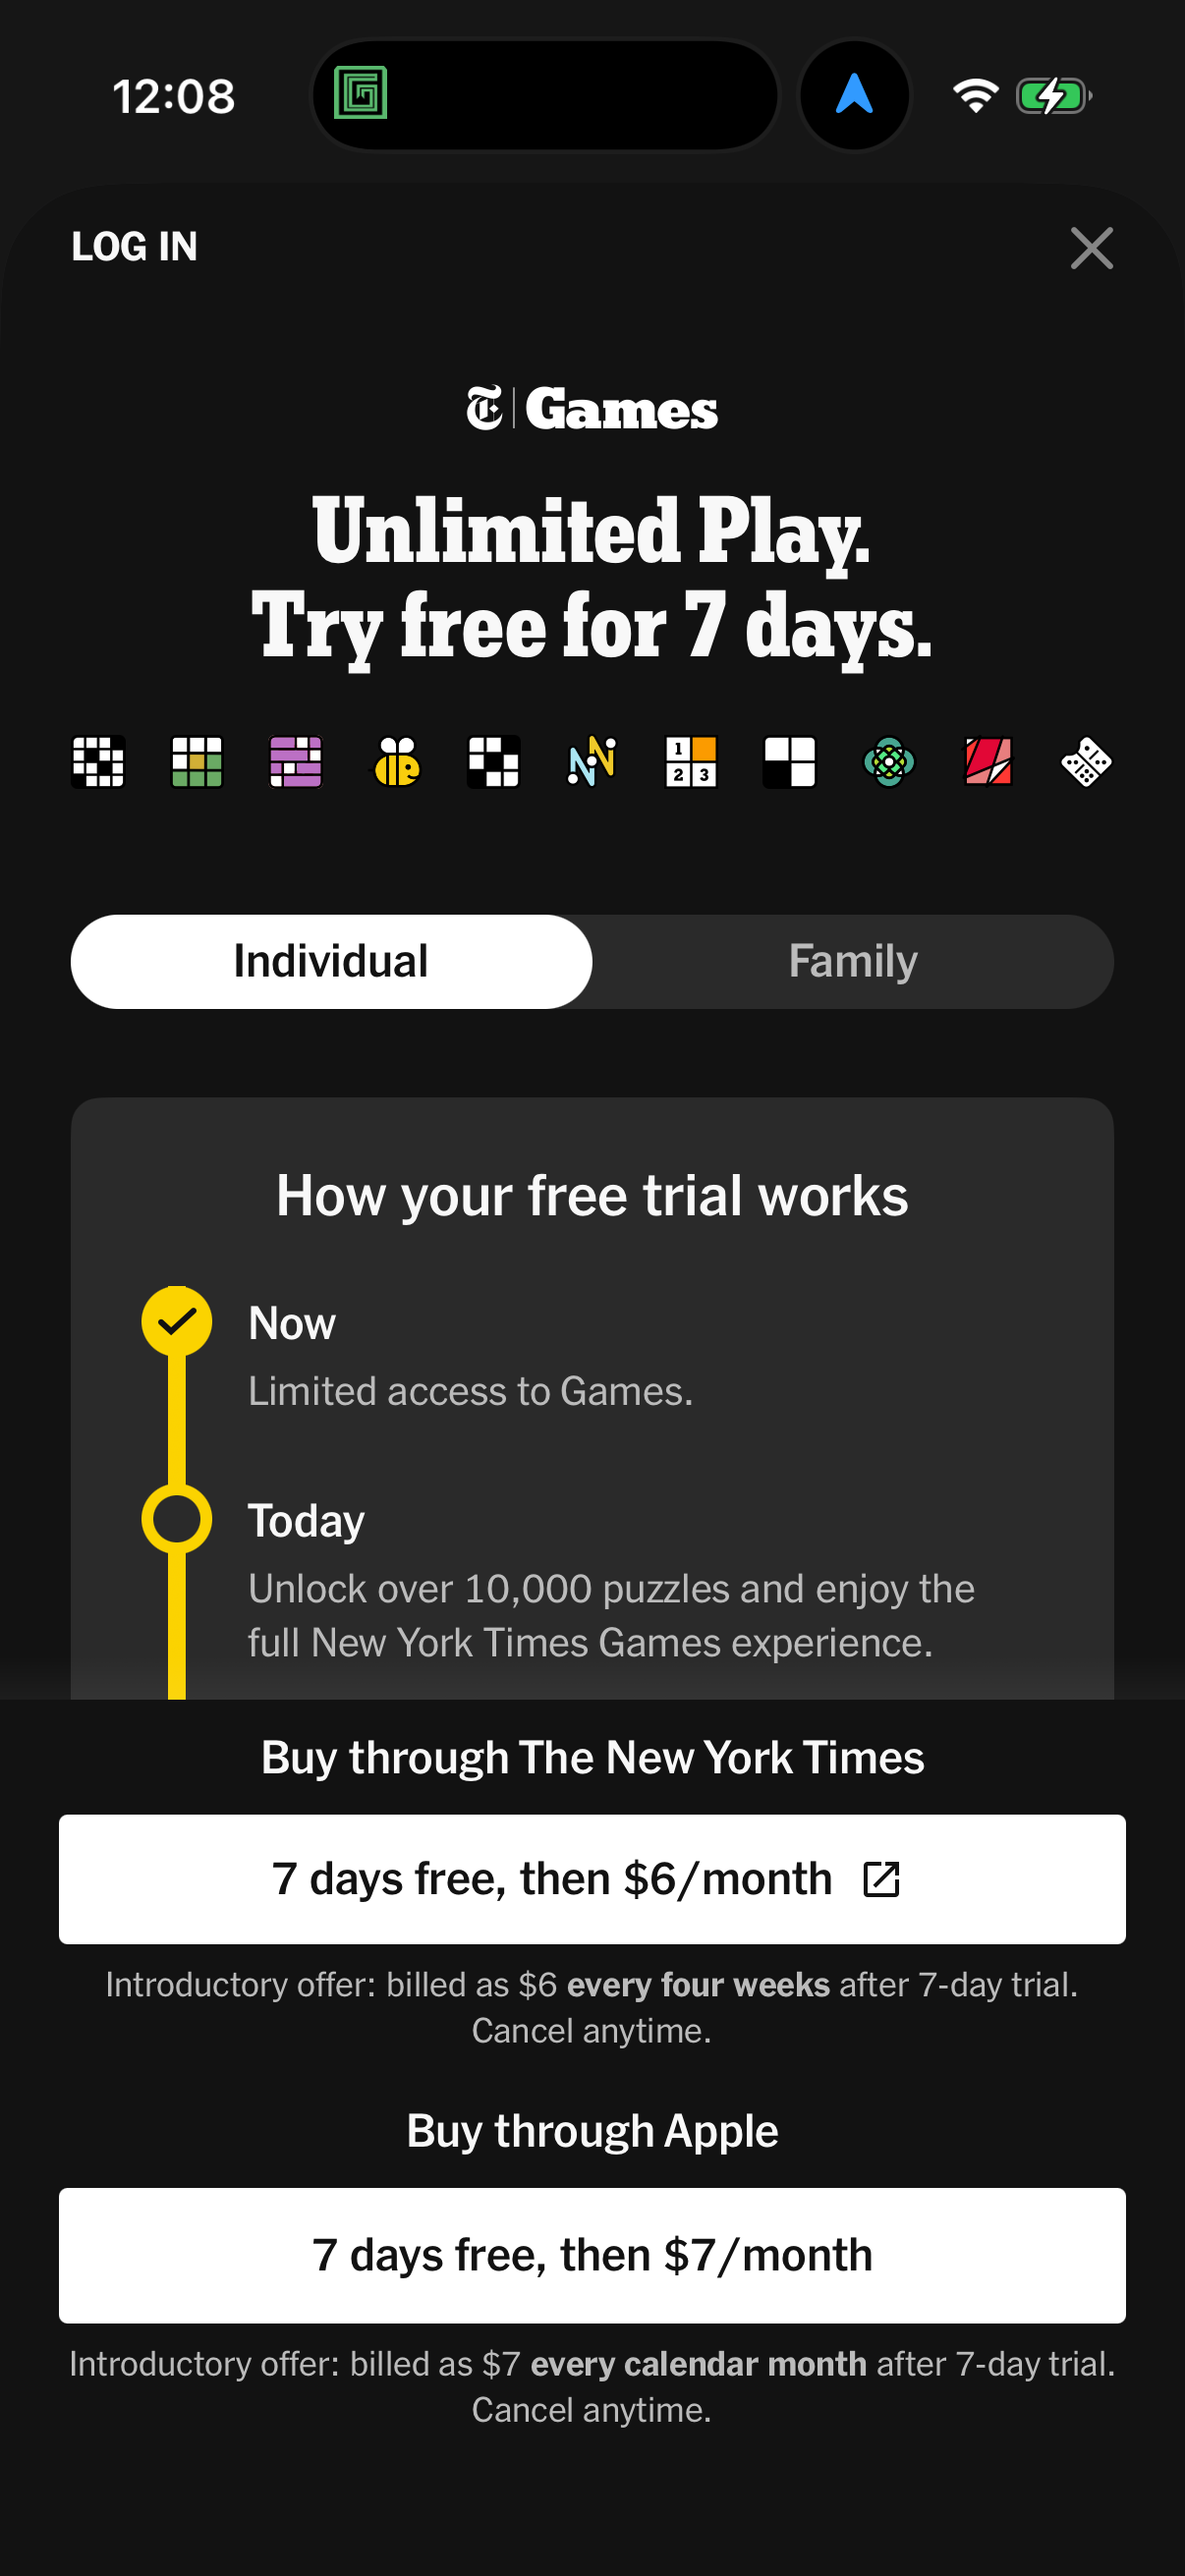
Nyt Games1206 × 2622opens the full image 
Apple Music Classical1206 × 2622opens the full image
The numbers
| # | Stat | Computed from |
|---|---|---|
| [1] | 1,847 of 2,708 screens (68.2%) hard; 229 of 252 companies have one | hard_paywall_screens: 1,847/2,708 = 68.2% |
| [2] | X/close 517 | text link 193 | restore-only 151 | exit_type_taxonomy mutually exclusive branches |
Methodology
Universe is 2,708 paywall screens across 252 companies. Each screen is classified into exactly one exit type with visible-X precedence; the no-exit branch is the hard-paywall proxy. Detection is extraction-based and undercounts soft exits.
Sources
- [1]
Lazyweb Research analysis of 2,708 paywall screens (mobile app corpus, 252 companies), July 2026
Hard-paywall proxy = no visible exit in extracted CTAs or vision descriptions; a lower bound on soft paywalls.
- [2]
Lazyweb Research analysis of 2,708 paywall screens (mobile app corpus, 252 companies), July 2026
Mutually exclusive exit taxonomy; visible X takes precedence over text link and restore-only.
Source: Lazyweb Research — proprietary analysis of real, in-market app screens. Cite as Lazyweb Research, 2026-07-07.