Which app categories default to dark mode and which default to light?
- By Ali Abouelatta
- n = 520
- Published
- Updated
- 2 min read
- design · ux-patterns · saas · mobile · web
Short answer
Dark defaults concentrate in Entertainment (38 of 42 systems, 90%), Music (19 of 24, 79%) and Developer Tools (13 of 18) source[1]. Light dominates Food & Drink (33 of 40, 83%), Medical (17 of 19) and Lifestyle (21 of 32) source[1]. Broad utility categories like Health & Fitness (39 dark / 32 light) and Finance (20 dark / 22 light) are near-even source[1].
90% of 42 audited Entertainment design systems default to dark; 83% of 40 Food & Drink default to light, July 2026.
Bar chart · Dark
Dark — Category leaderboard
One block is about 1.4 Dark
- Entertainment
- 38
- Music
- 19
- News
- 19
- Health & Fitness
- 39
- Education
- 25
- Finance
- 20
- Lifestyle
- 11
- Food & Drink
- 7
Category leaderboard
Categories with n>=20 are shown as directional; below that, treat counts as absolute source[1].
| Category | Dark | Light | n | Lean |
|---|---|---|---|---|
| Entertainment | 38 | 4 | 42 | Dark 90% |
| Music | 19 | 5 | 24 | Dark 79% |
| News | 19 | 11 | 30 | Dark 63% |
| Health & Fitness | 39 | 32 | 71 | Even |
| Education | 25 | 23 | 48 | Even |
| Finance | 20 | 22 | 42 | Even |
| Lifestyle | 11 | 21 | 32 | Light 66% |
| Food & Drink | 7 | 33 | 40 | Light 83% |
Developer Tools (13/5, n=18) and Medical (2/17, n=19) are strong but sit just under the n>=20 directional bar source[1].
How to apply it
Media and content-immersion categories (Entertainment, Music, News) treat dark as the honest default — dark surfaces make cover art, video and album grids pop, and Netflix and Spotify anchor that convention source[2]. Consumption-and-trust categories (Food & Drink, Medical, Lifestyle) default light. If you are in a near-even category (Health & Fitness, Education, Finance), the theme choice is genuinely yours — lead with your platform convention instead.
Caveats
Per-category cuts below n=30 (Music, Developer Tools, Medical, Books, Photo & Video) are reported as absolute counts, not stable percentages source[1]. Travel (n=2) and Business (n=10) are too small to read at all.
Real in-market screens
Screens from real, in-market apps, tracked by Lazyweb Research.
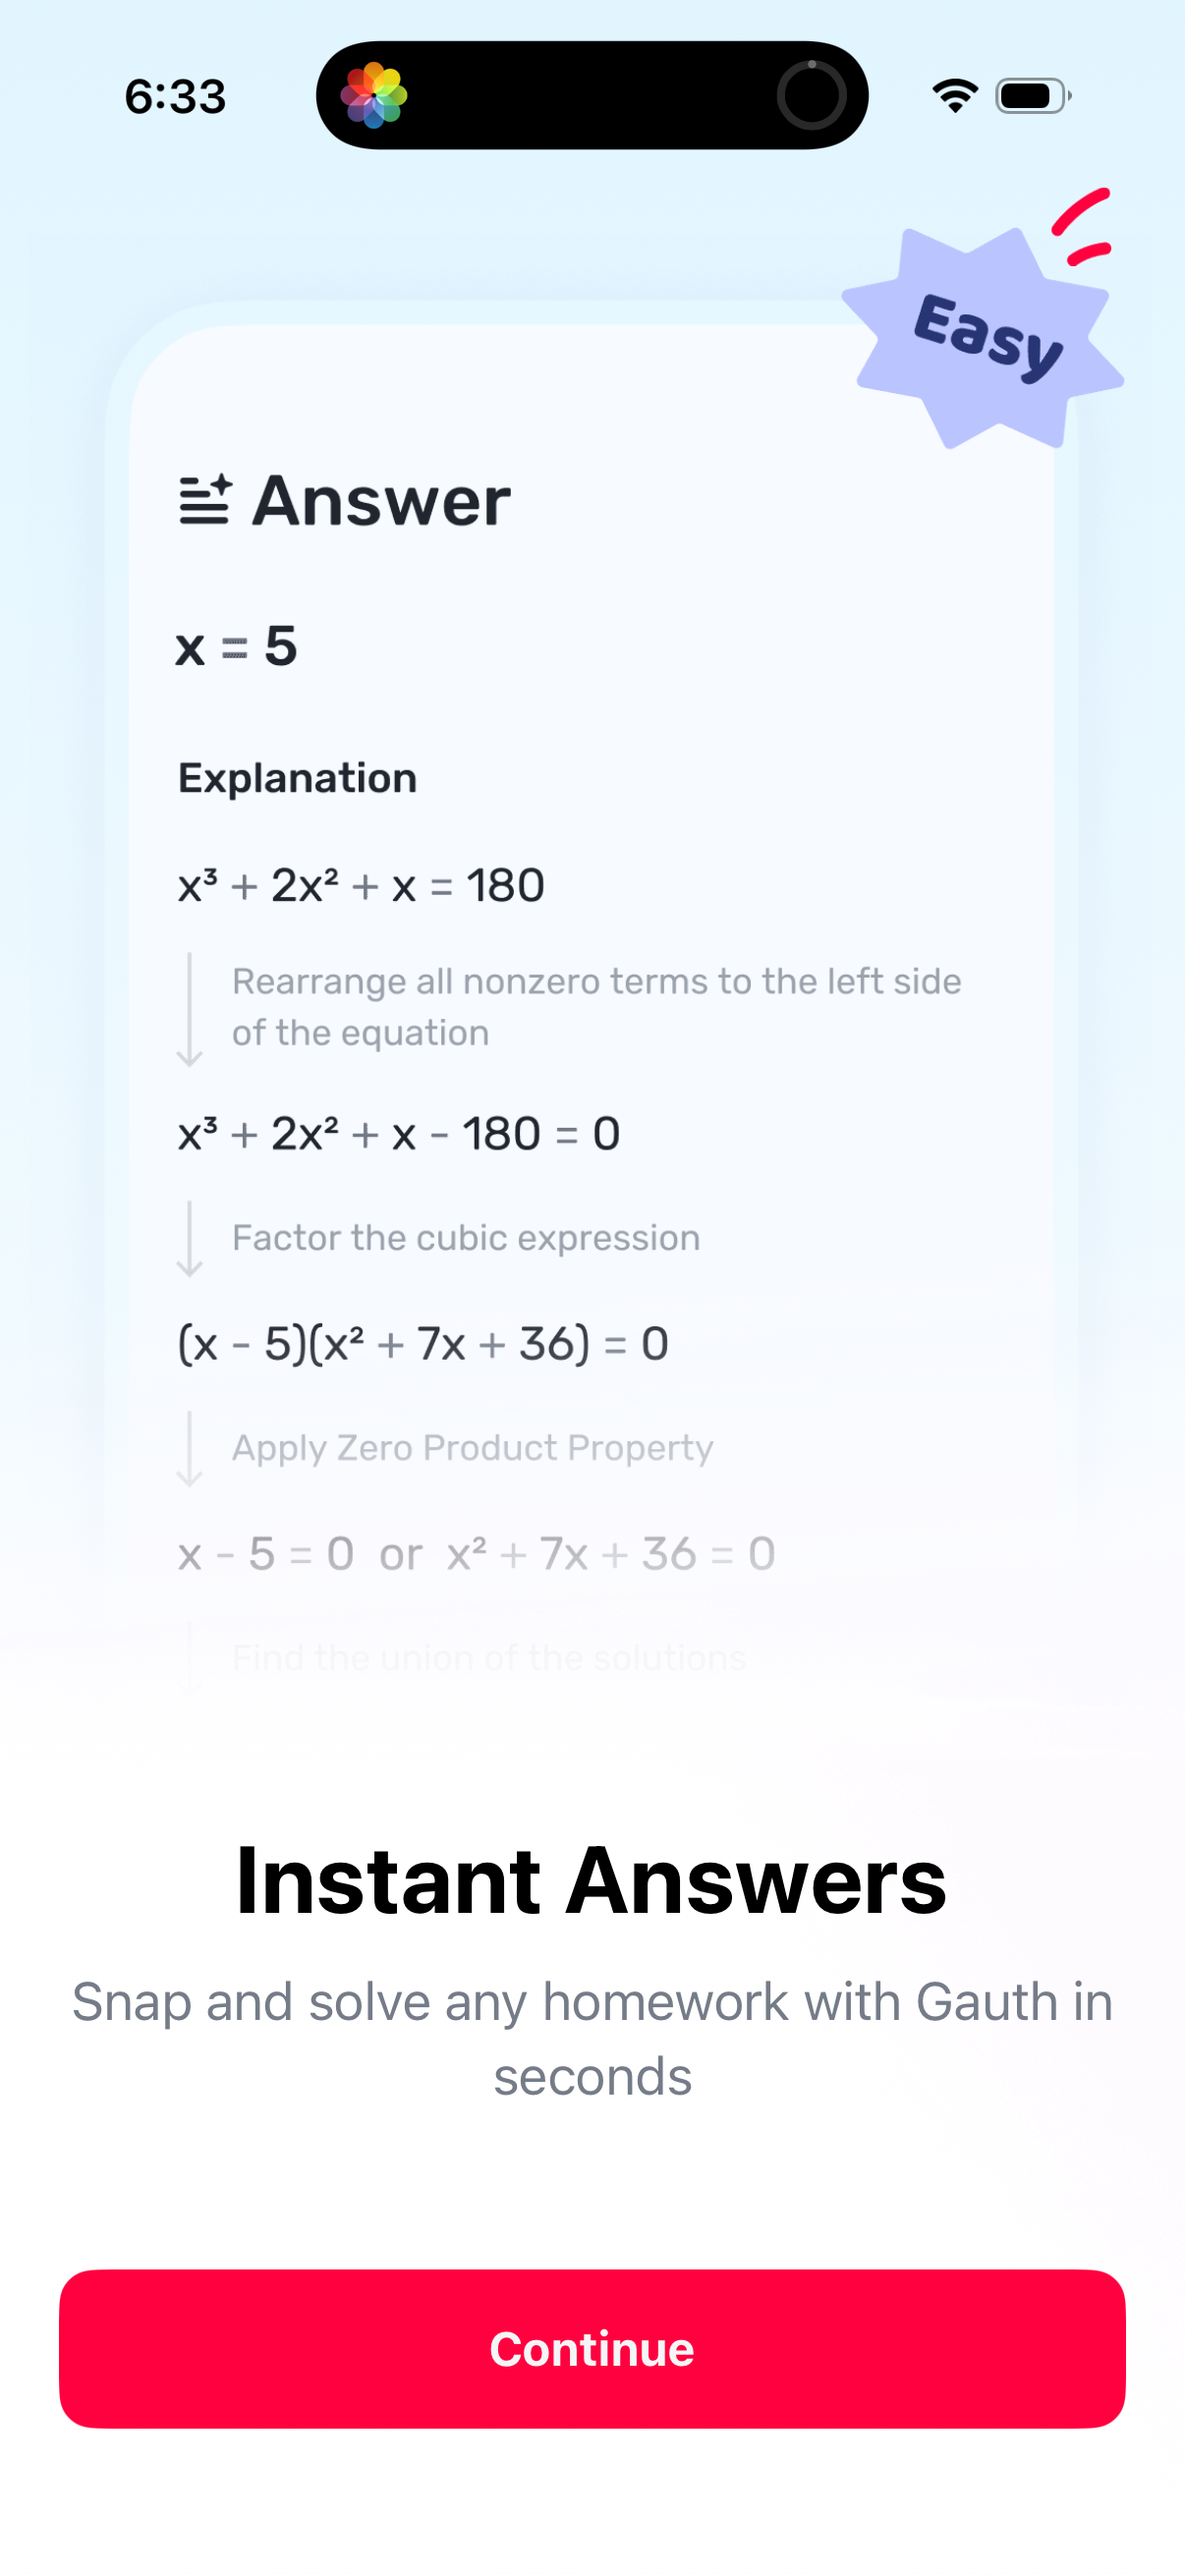
Gauthmath1206 × 2622opens the full image 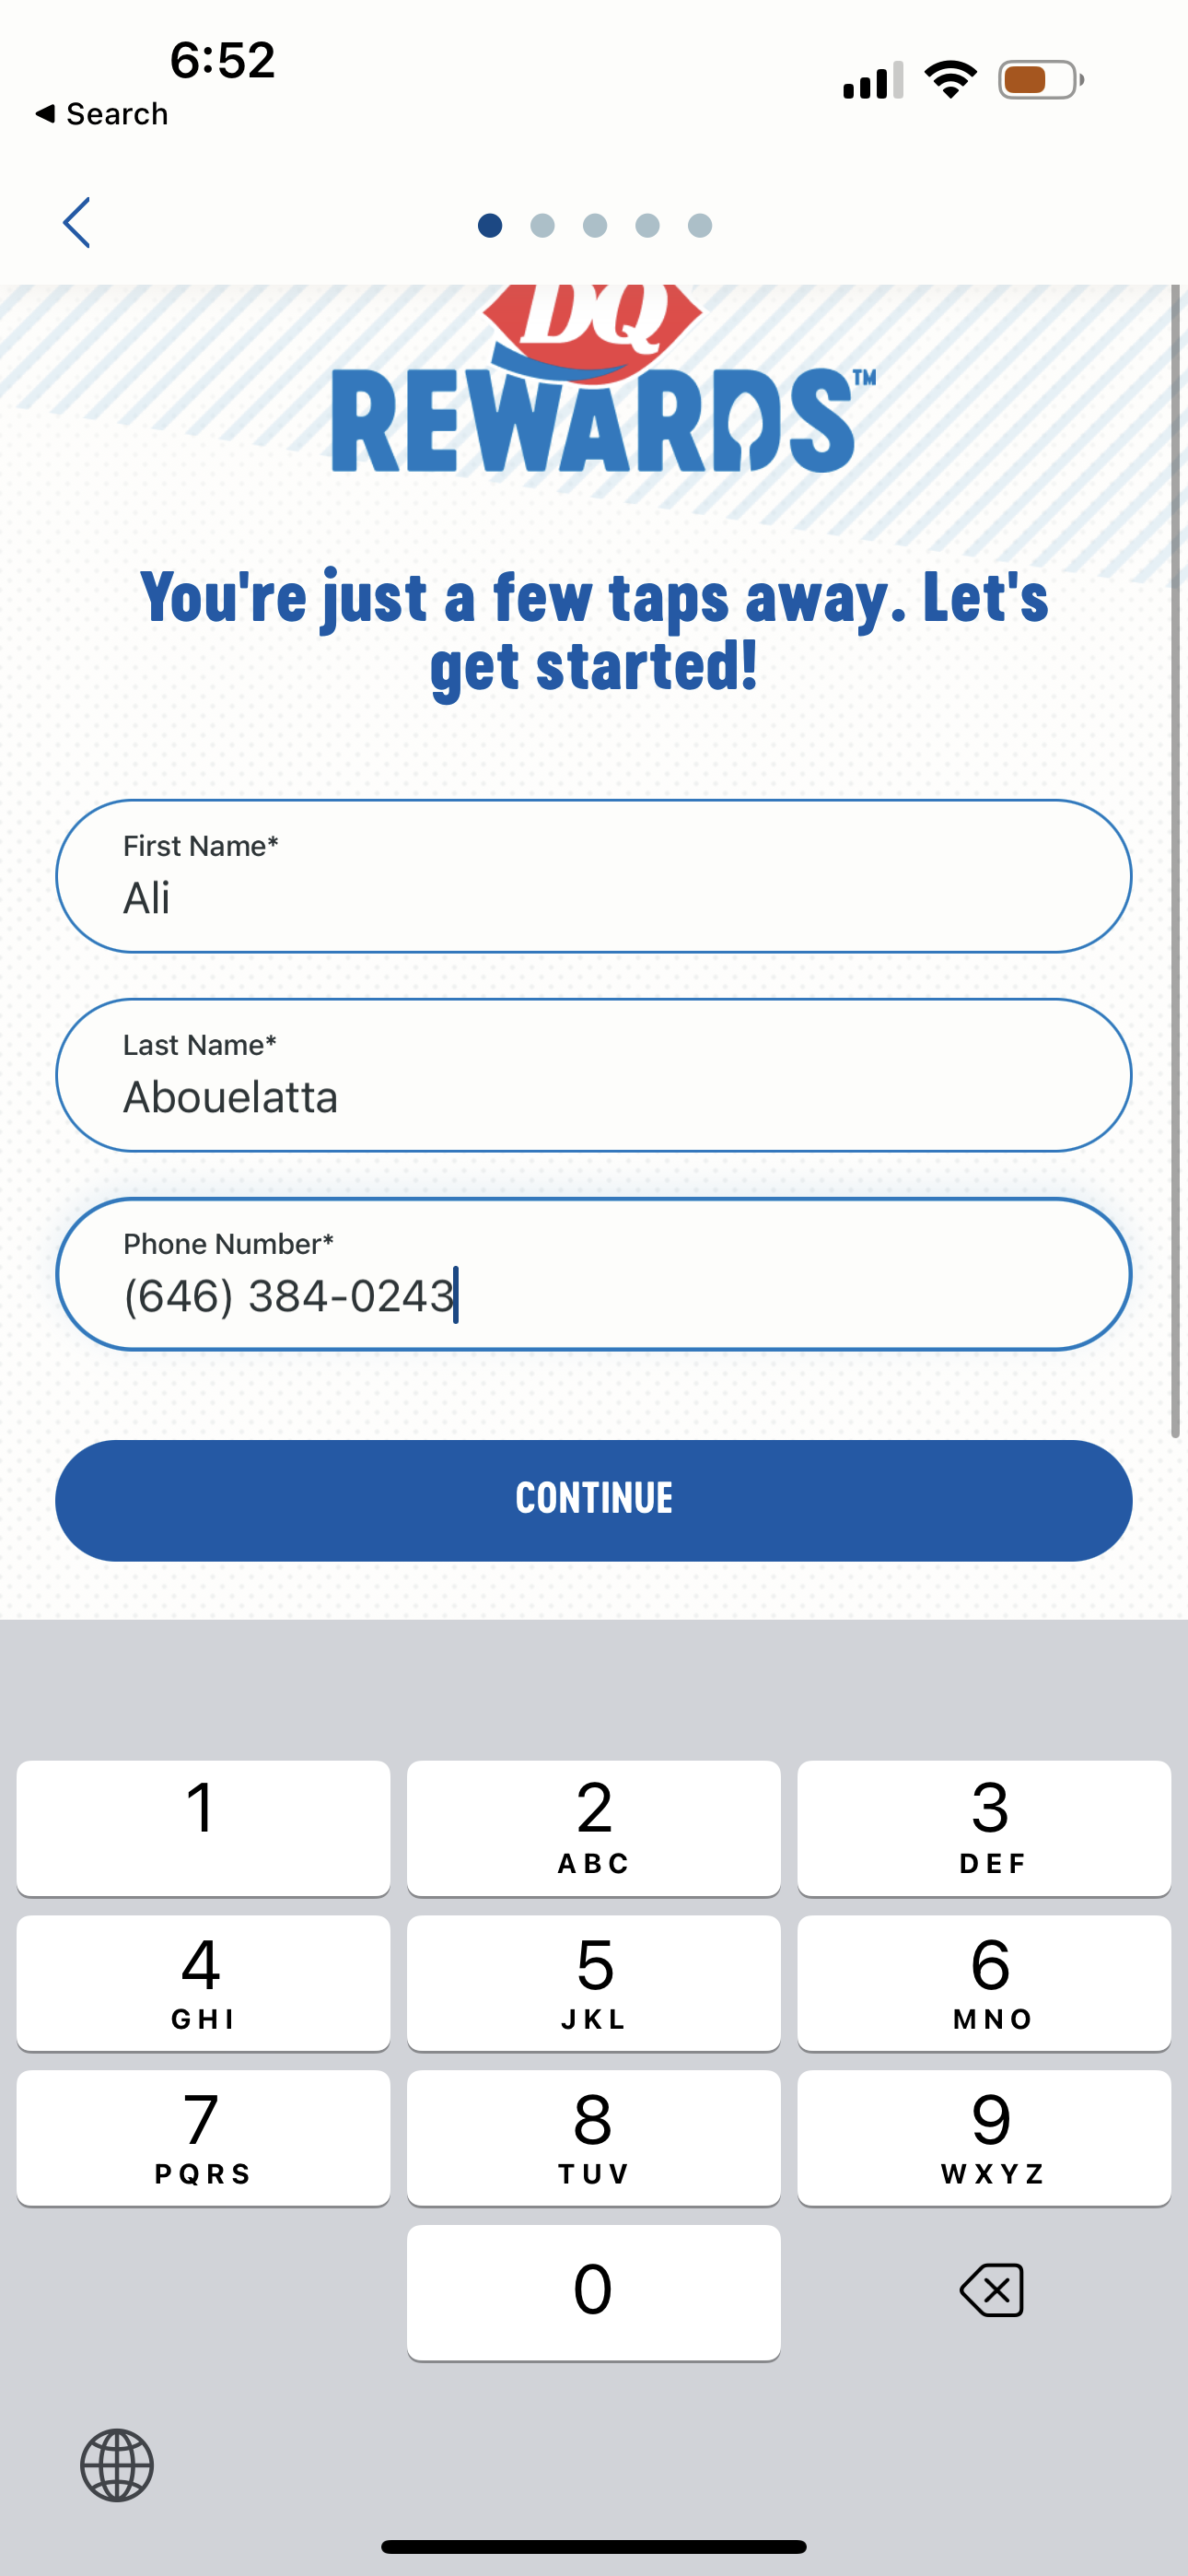
Dairy Queen1290 × 2796opens the full image 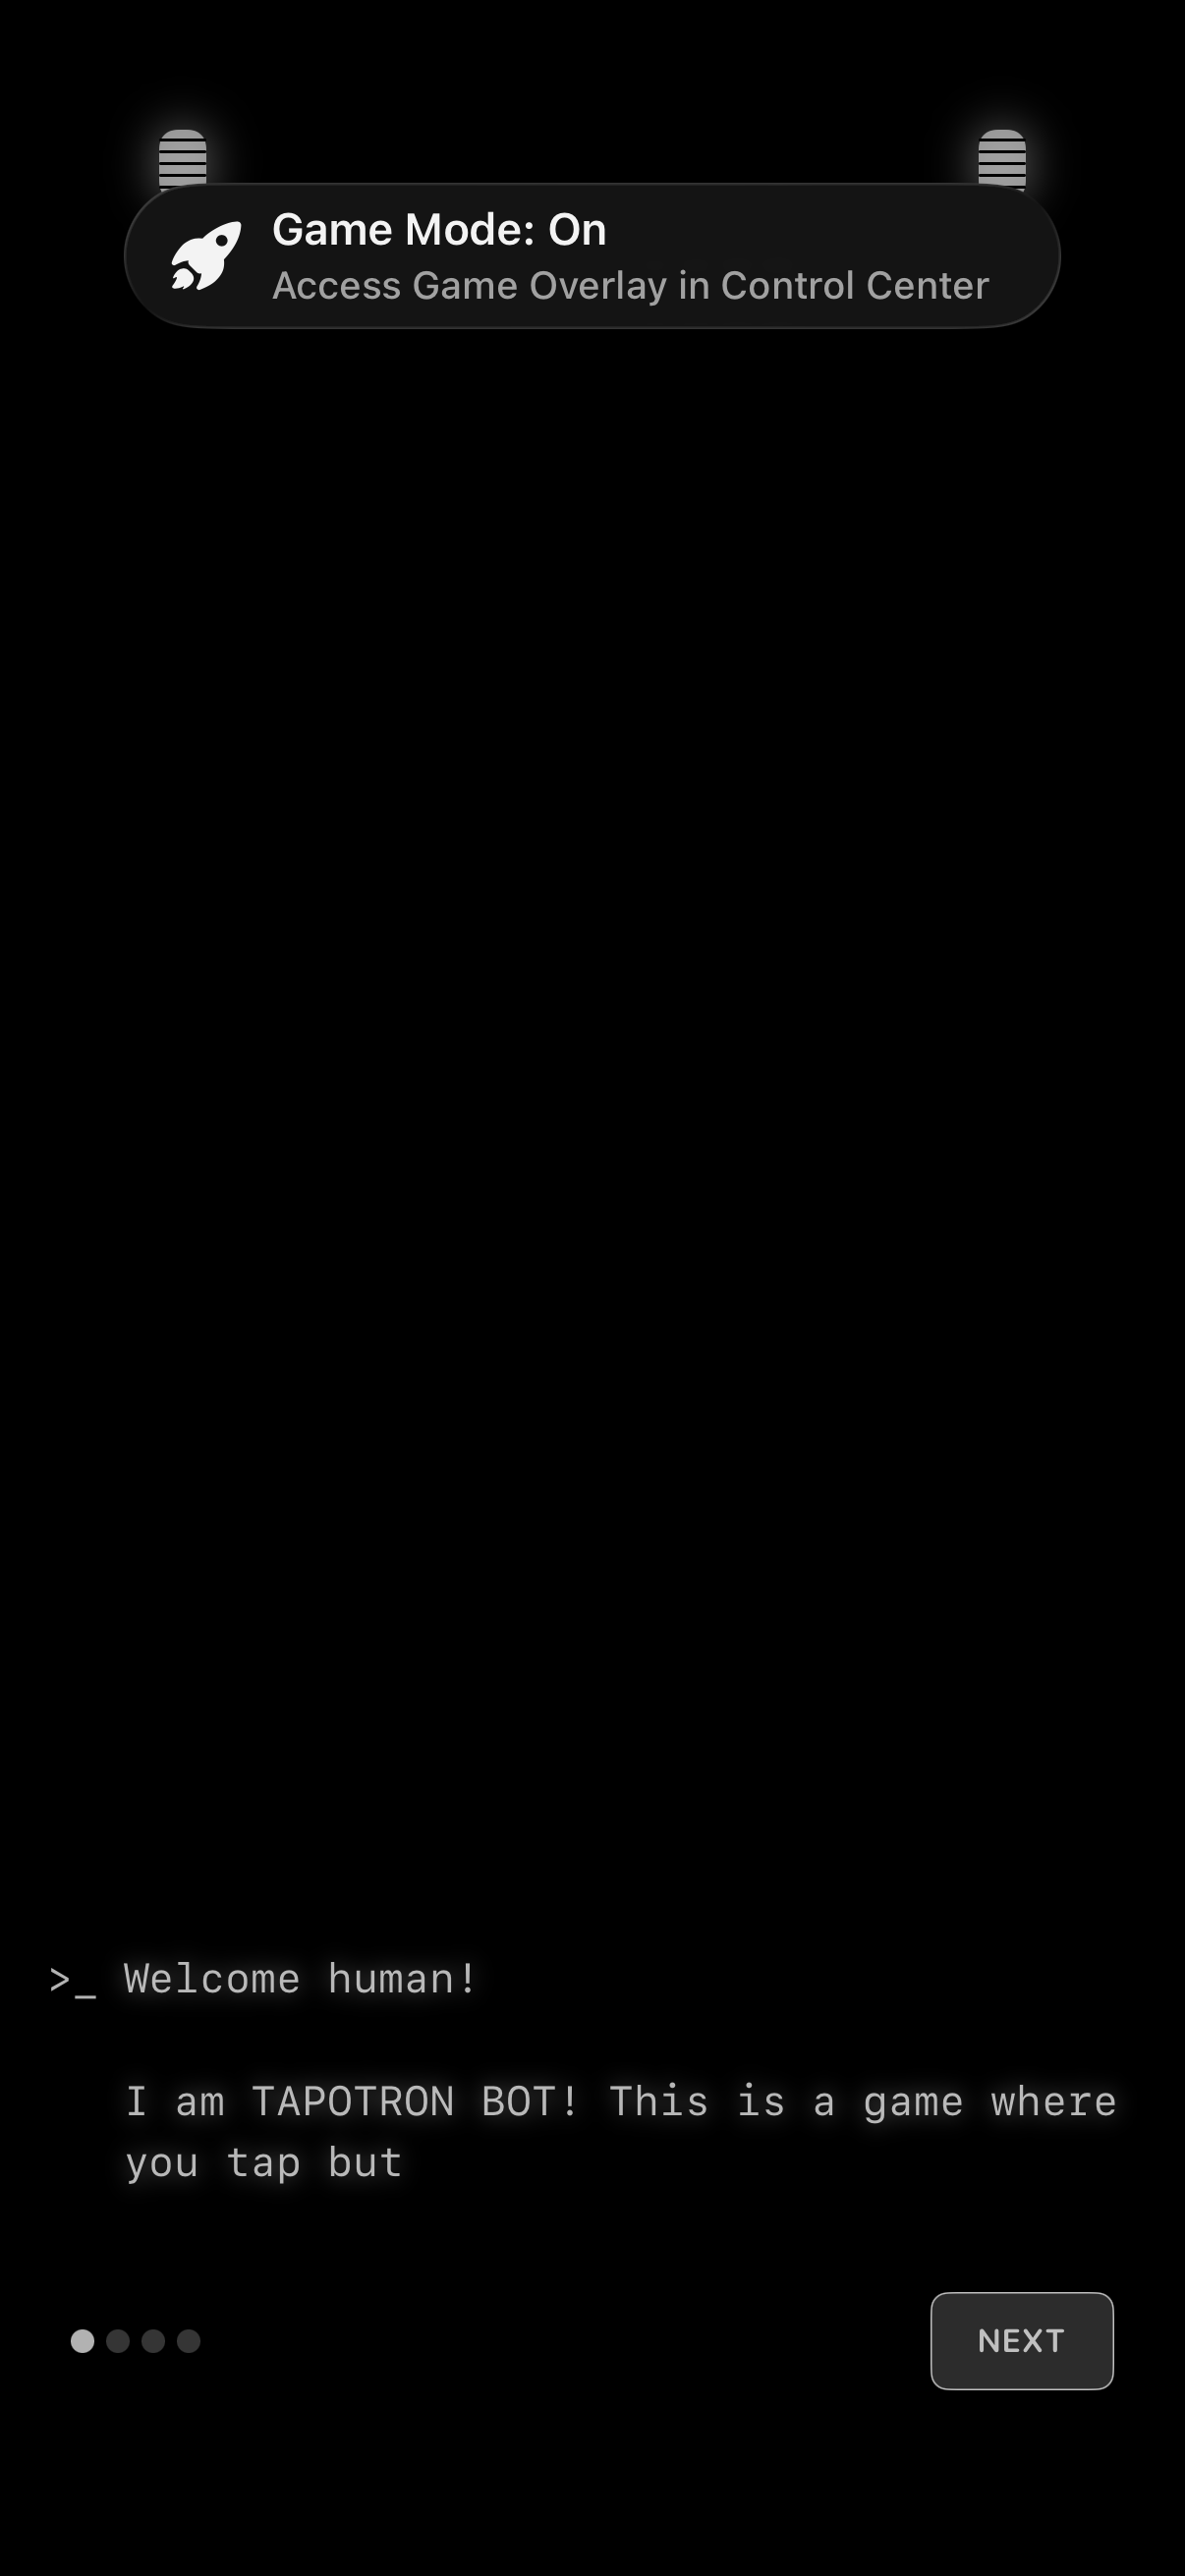
Tapotron1206 × 2622opens the full image 
Buzzfeed1206 × 2622opens the full image
The numbers
| # | Stat | Computed from |
|---|---|---|
| [1] | Entertainment 38/42 dark; Food & Drink 33/40 light; Health & Fitness 39/32; Finance 20/22 | theme_by_category |
| [2] | Netflix and Spotify: dark-default media design systems | qualitative:netflix,spotify |
Methodology
Universe: 520 audited design systems joined to categorized companies. Method: dark vs light count per category; only n>=30 categories are read as percentages. July 2026 snapshot; small categories are directional only.
Sources
- [1]
Lazyweb Research analysis of 520 design systems (categorized design_systems corpus), July 2026
Default theme per company category via design_systems joined to companies; categories under n=30 reported as counts.
- [2]
Lazyweb Research analysis of 520 design systems (audited design_systems corpus), July 2026
Netflix (dark, #E50914) and Spotify (dark, brand green) as canonical dark-first entertainment systems — example rows.
Source: Lazyweb Research — proprietary analysis of real, in-market app screens. Cite as Lazyweb Research, 2026-07-07.