What primary brand colors dominate finance and entertainment design systems?
- By Ali Abouelatta
- n = 84
- Published
- Updated
- 2 min read
- design · ux-patterns · monetization · saas · landing-page
Short answer
Blue leads every category, but the second color diverges: in Finance, green ties for second (17 blue, 9 neutral, 9 green of 42) — the money-green pattern source[1]. In Entertainment, red jumps to second (15 blue, 9 red, 8 neutral of 42) via streaming and media brands source[1]. Category shifts the accent, not the leader.
Green ties for second in Finance brand colors (9 of 42 systems) but ranks 5th overall, July 2026.
Bar chart · Entertainment (n=42)
Entertainment (n=42) — Same leader, different runner-up
One block is about 0.5 Entertainment (n=42)
- Blue
- 15
- Neutral
- 8
- Green
- 4
- Red
- 9
- Teal/cyan
- 1
- Purple/indigo
- 2
Same leader, different runner-up
Primary brand hue for the two categories where the accent diverges from the overall ranking source[1].
| Hue | Finance (n=42) | Entertainment (n=42) |
|---|---|---|
| Blue | 17 | 15 |
| Neutral | 9 | 8 |
| Green | 9 | 4 |
| Red | — | 9 |
| Teal/cyan | 3 | 1 |
| Purple/indigo | 2 | 2 |
Green ranks only 5th overall (7.7%) but ties for 2nd in Finance; red ranks 3rd overall but jumps to 2nd in Entertainment source[1]source[2].
How to apply it
In Finance, green reads as 'money' and is over-represented versus the global baseline — Cash App and Robinhood exemplify it source[3]. In Entertainment, red carries urgency and heat (Netflix Red is the anchor) source[3]. If you want to signal category membership, borrow the runner-up hue; if you want to signal difference, use blue's ubiquity against your competitors by picking a distinct accent.
Real in-market screens
Screens from real, in-market apps, tracked by Lazyweb Research.
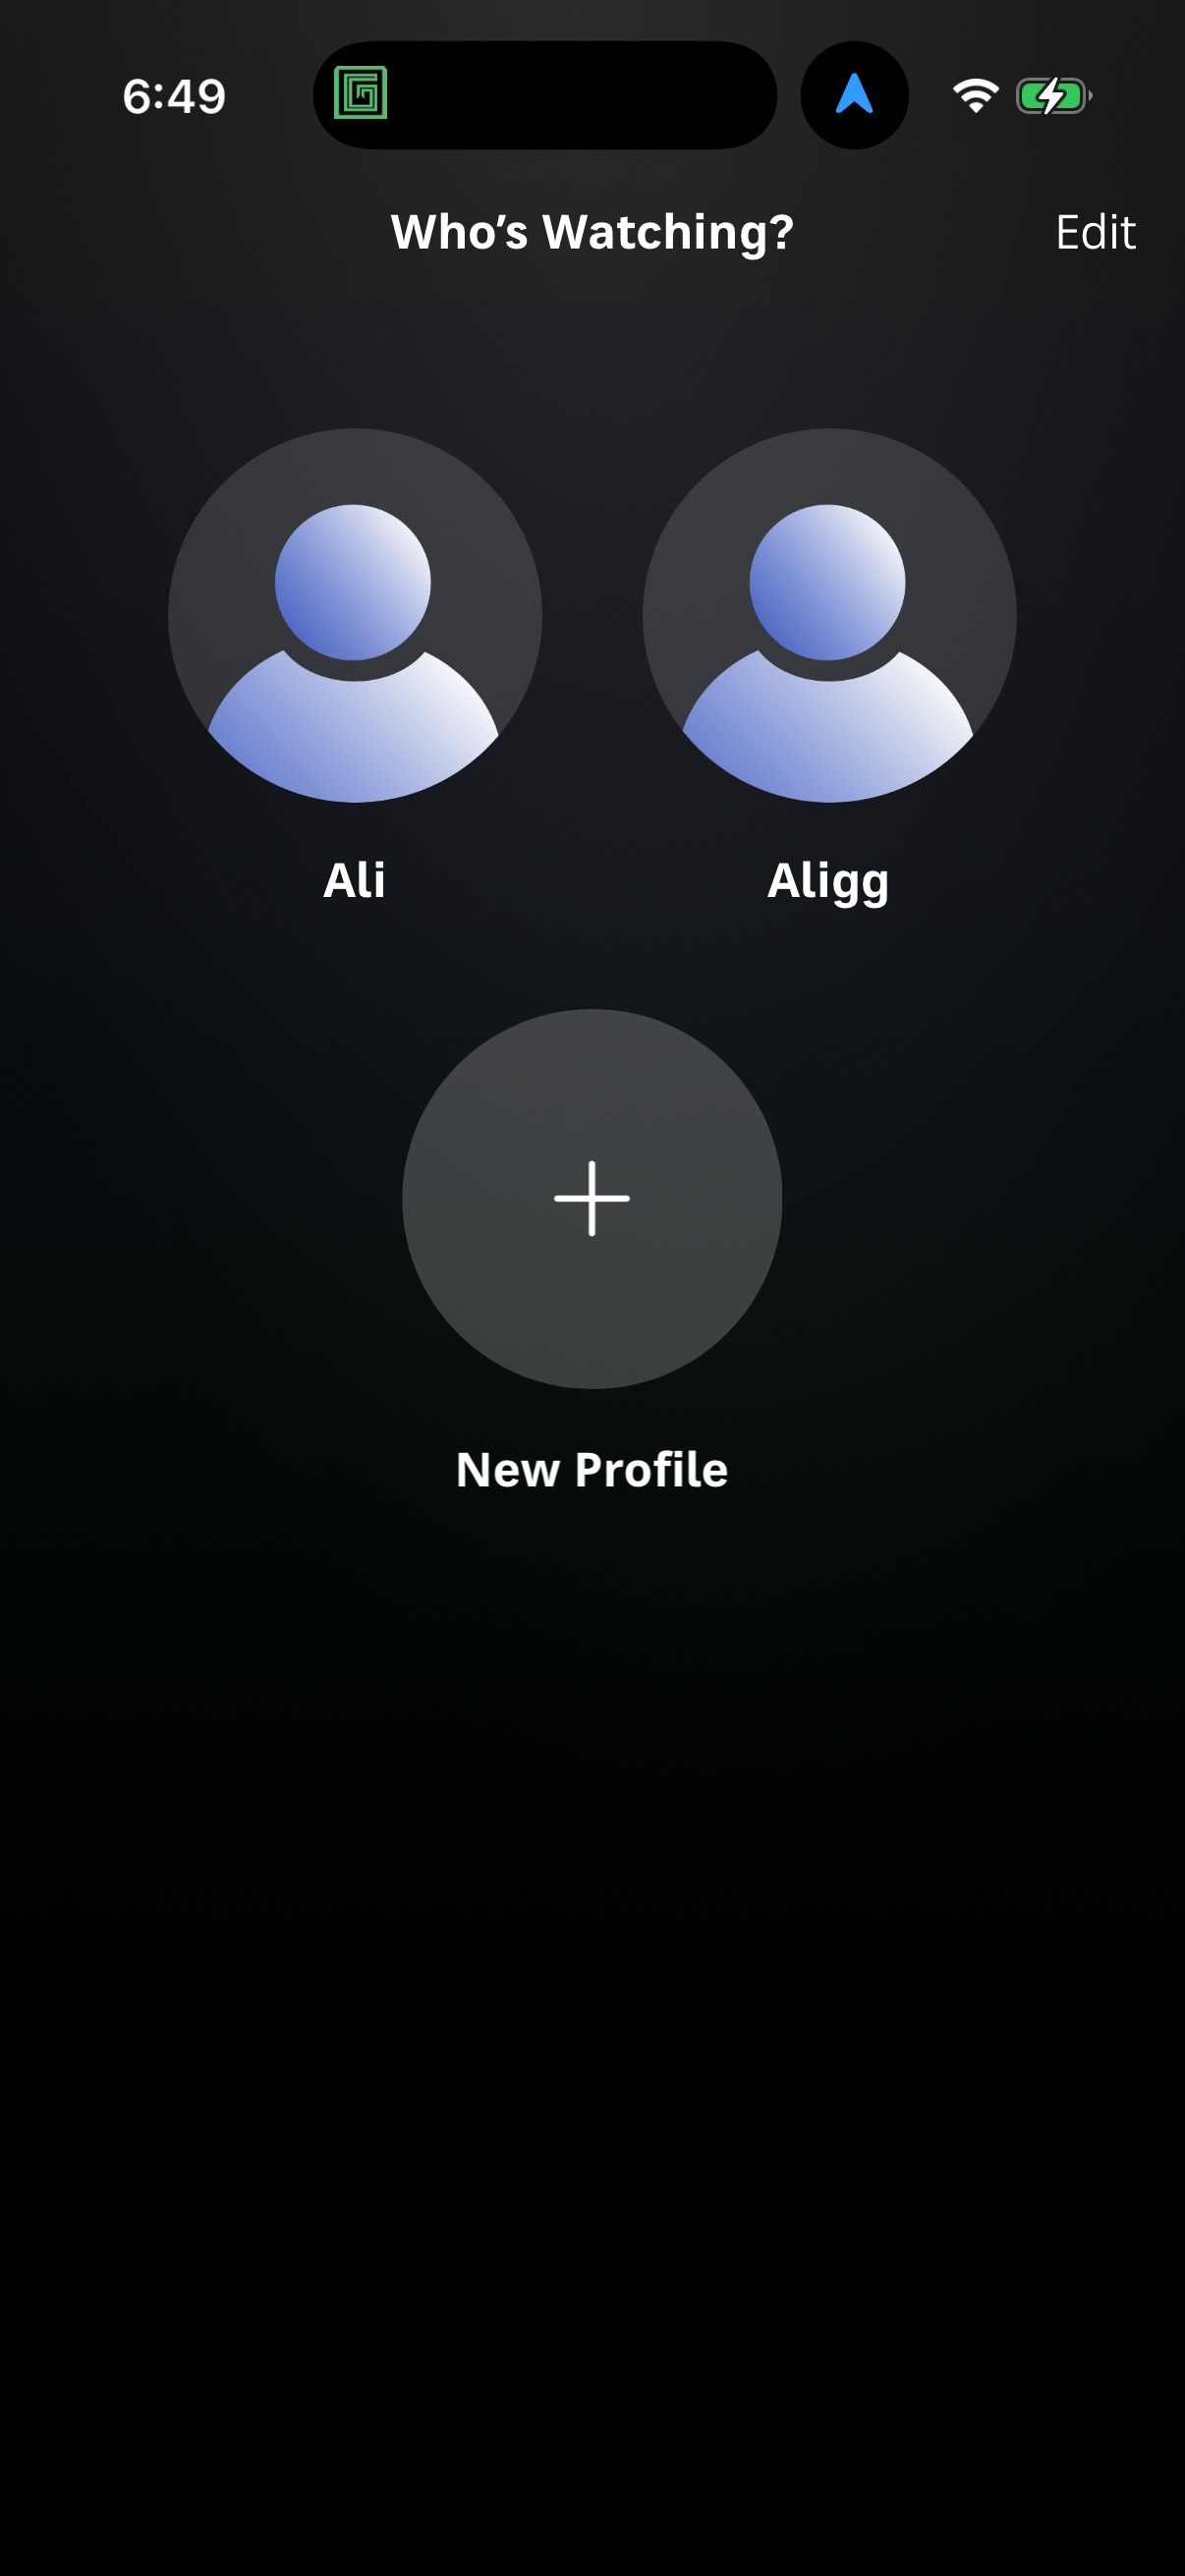
Max1206 × 2622opens the full image 
Universe1206 × 2622opens the full image 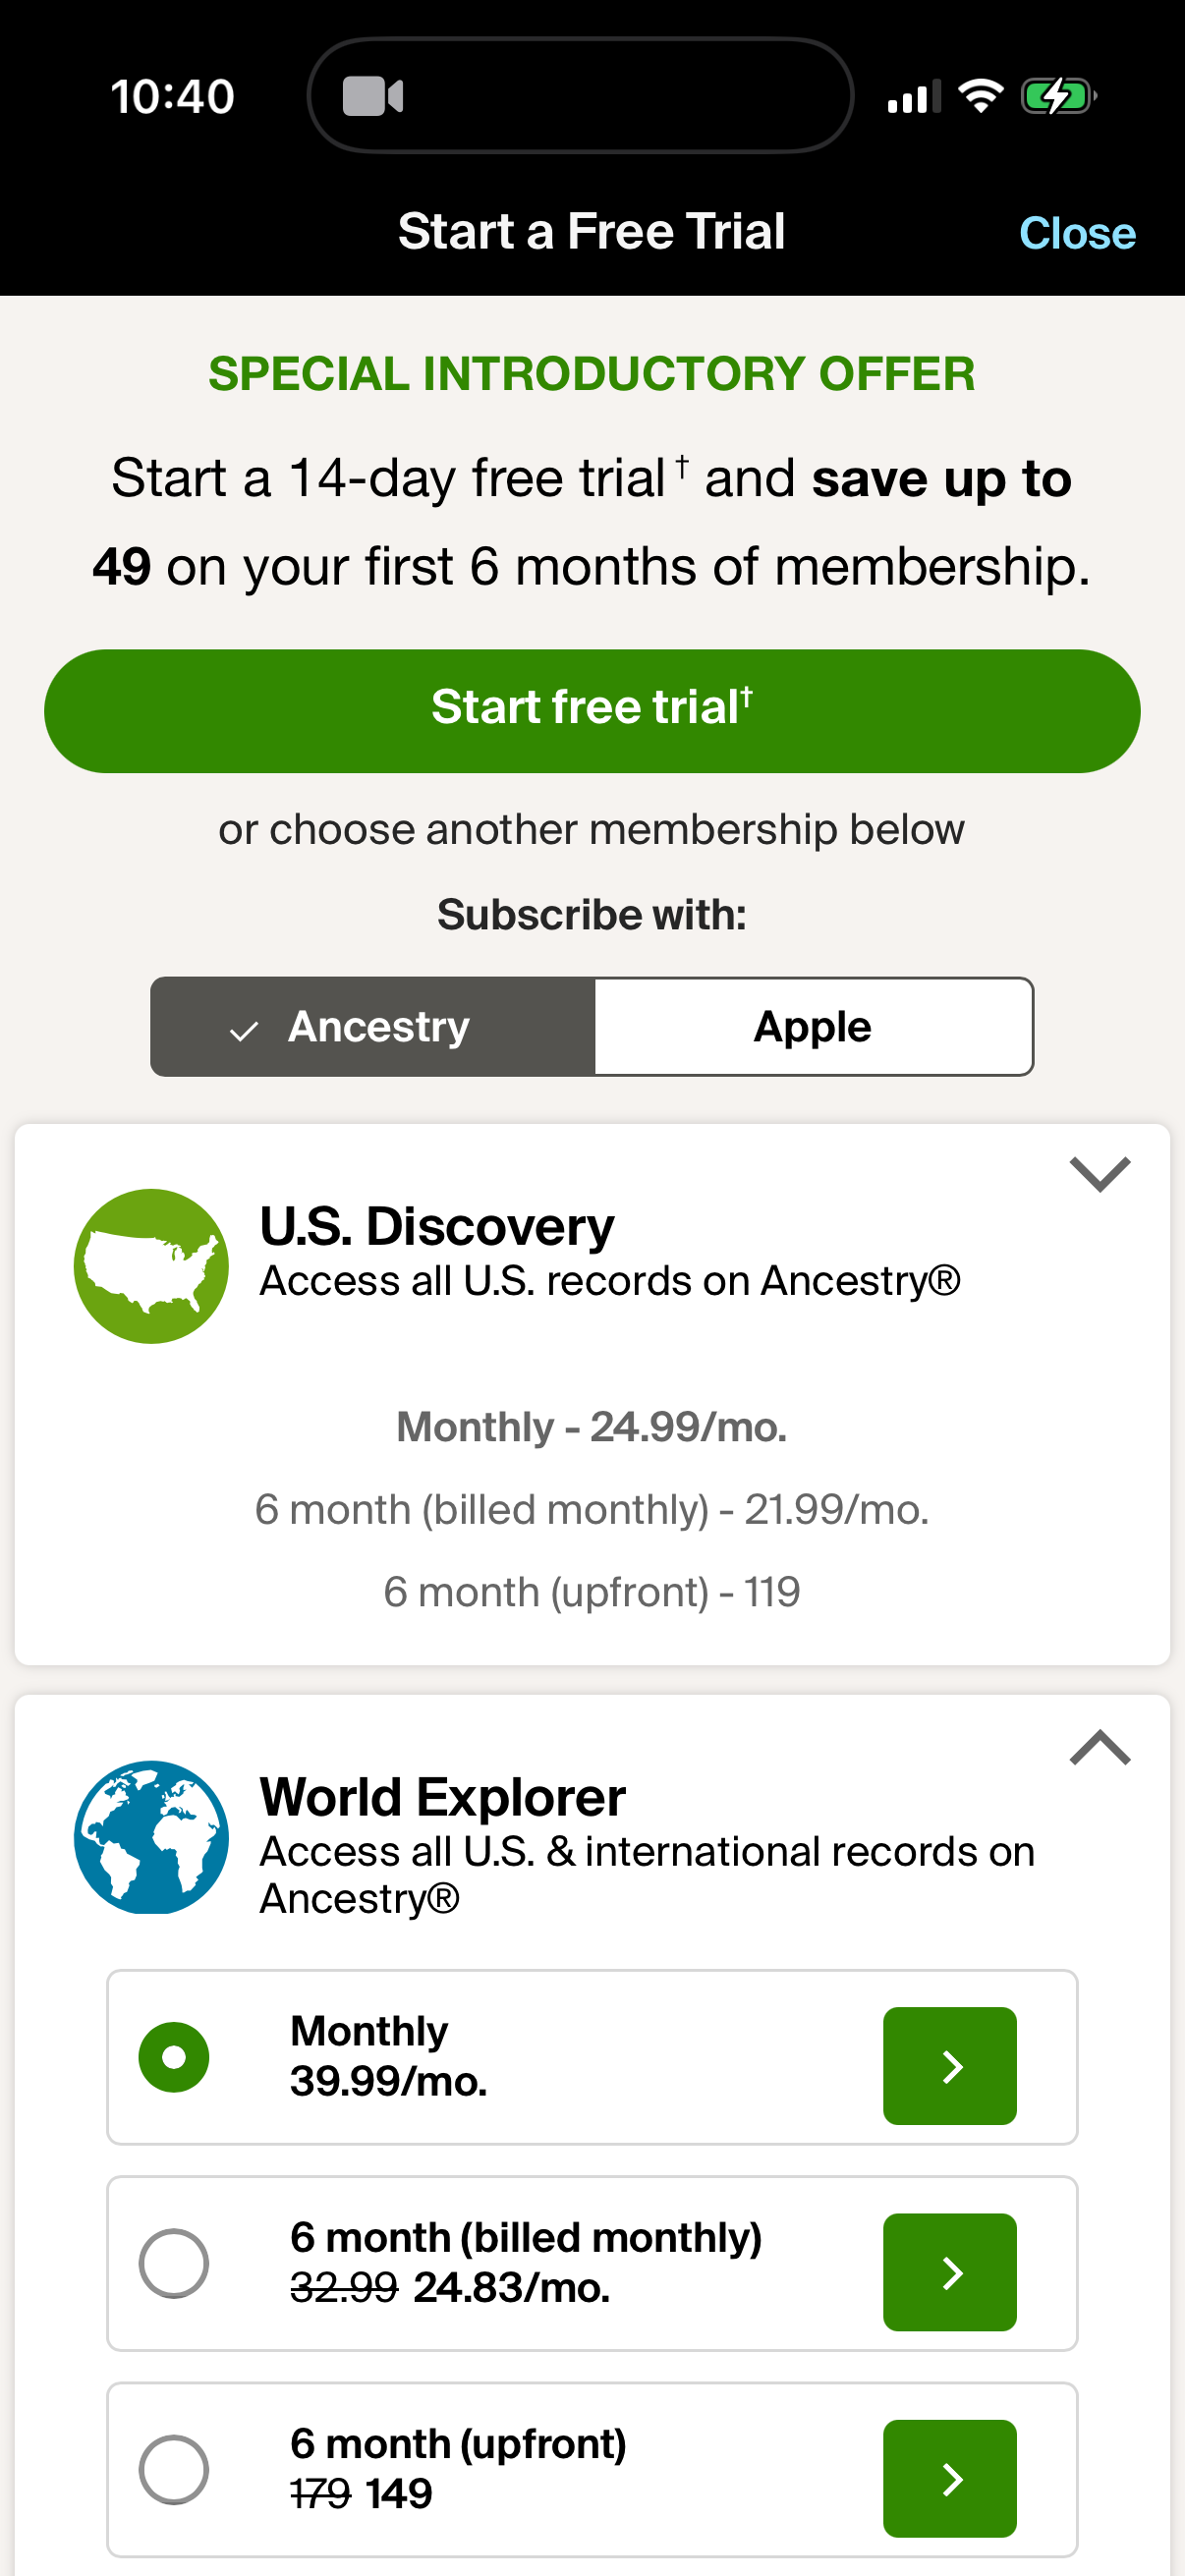
Ancestry1206 × 2622opens the full image 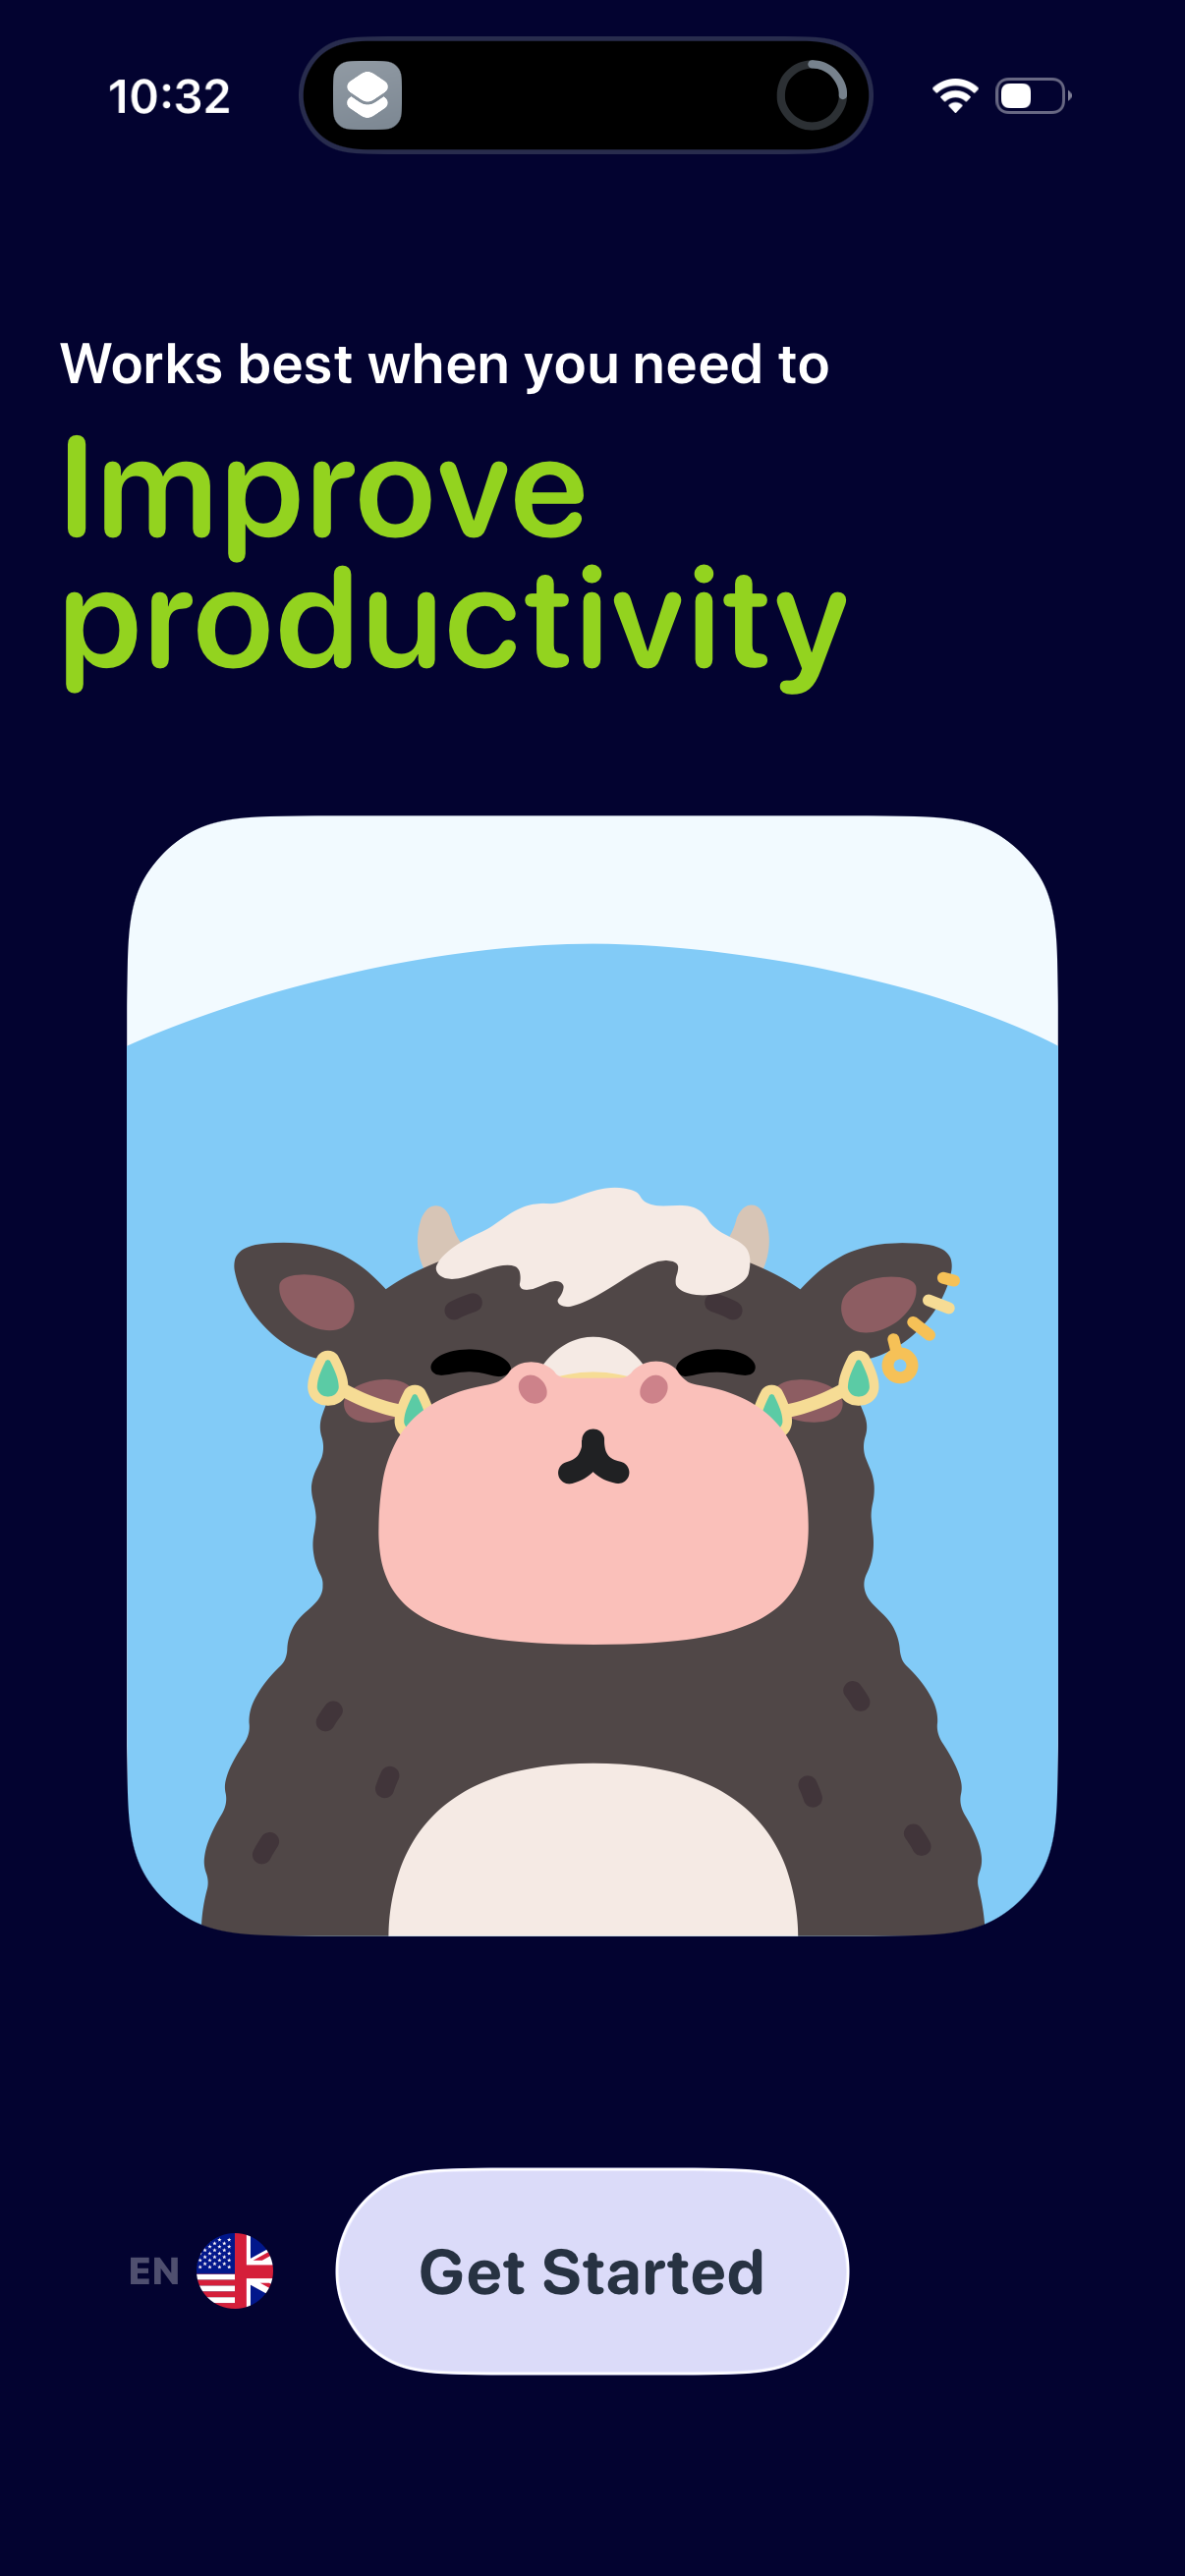
Mindllama1206 × 2622opens the full image
The numbers
| # | Stat | Computed from |
|---|---|---|
| [1] | Finance: blue 17, neutral 9, green 9 of 42; Entertainment: blue 15, red 9, neutral 8 of 42 | primary_brand_hue_by_category |
| [2] | green 7.7% and red 14.6% overall of 519 | primary_brand_hue_overall |
| [3] | Cash App/Robinhood green; Netflix Red (#E50914) | qualitative:cash-app,robinhood,netflix |
Methodology
Universe: 42 Finance and 42 Entertainment audited design systems within the 520-system corpus. Method: brand-hue bucketing per category. July 2026 snapshot; per-category hue counts are directional and buckets are approximate near boundaries.
Sources
- [1]
Lazyweb Research analysis of 84 design systems (42 Finance + 42 Entertainment), July 2026
Brand hue bucketing within Finance and Entertainment categories.
- [2]
Lazyweb Research analysis of 519 design systems (systems with a brand color), July 2026
Overall brand-hue ranking used as the baseline for category comparison.
- [3]
Lazyweb Research analysis of 520 design systems (audited design_systems corpus), July 2026
Cash App/Robinhood money-green and Netflix Red as example rows, not weighted stats.
Source: Lazyweb Research — proprietary analysis of real, in-market app screens. Cite as Lazyweb Research, 2026-07-07.