Where do web apps place in-product upsells?
- By Ali Abouelatta
- n = 11,753
- Published
- Updated
- 2 min read
- web · upsell · saas · monetization · ux-patterns
Short answer
In the web corpus, 82% of labeled product screens are in-product (9,645/11,753), and the two largest in-product surfaces are settings (1,351 screens) and dashboard (1,088) — both fully in-product.source[4] So on web, the upgrade entry naturally rides the surfaces users live in every session. Anchor web upsells to settings and the dashboard before reaching for interruptive modals.
9,645 of 11,753 labeled web product screens (82%) are in-product, led by settings (1,351) and dashboard (1,088) — Lazyweb Research, July 2026.
Bar chart · Screens
Screens — Finding
One block is about 0.4 Screens
- In-product screens
- 9,645
- All labeled product screens
- 11,753
- In-product settings
- 1,351
- In-product dashboard
- 1,088
Finding
Web in-product surface composition:source[4]
| Metric | Screens |
|---|---|
| In-product screens | 9,645 |
| All labeled product screens | 11,753 |
| In-product settings | 1,351 |
| In-product dashboard | 1,088 |
At 82% in-product, the web corpus is dominated by the surfaces where returning users spend time — and settings plus dashboard together are the largest single destinations for placing an always-available upgrade entry.
How to apply
On web, put the persistent upgrade path in the two highest-traffic in-product surfaces: an 'Upgrade' entry in settings/account and a plan/usage nudge on the dashboard. These match how mobile treats settings (35% of apps with a settings screen carry an upgrade entry)source[3] and give broad, low-friction exposure without an interstitial. Reserve contextual modals for the moment a user hits a specific limit.
Caveats
The web corpus (sites_screen_labels, 11,753 screens) is a distinct universe from the 809-app mobile corpus and largely different companies — never mix the denominators.source[4] Screen counts are labels, not conversion.
Real in-market screens
Screens from real, in-market apps, tracked by Lazyweb Research.

Masterclass1206 × 2622opens the full image 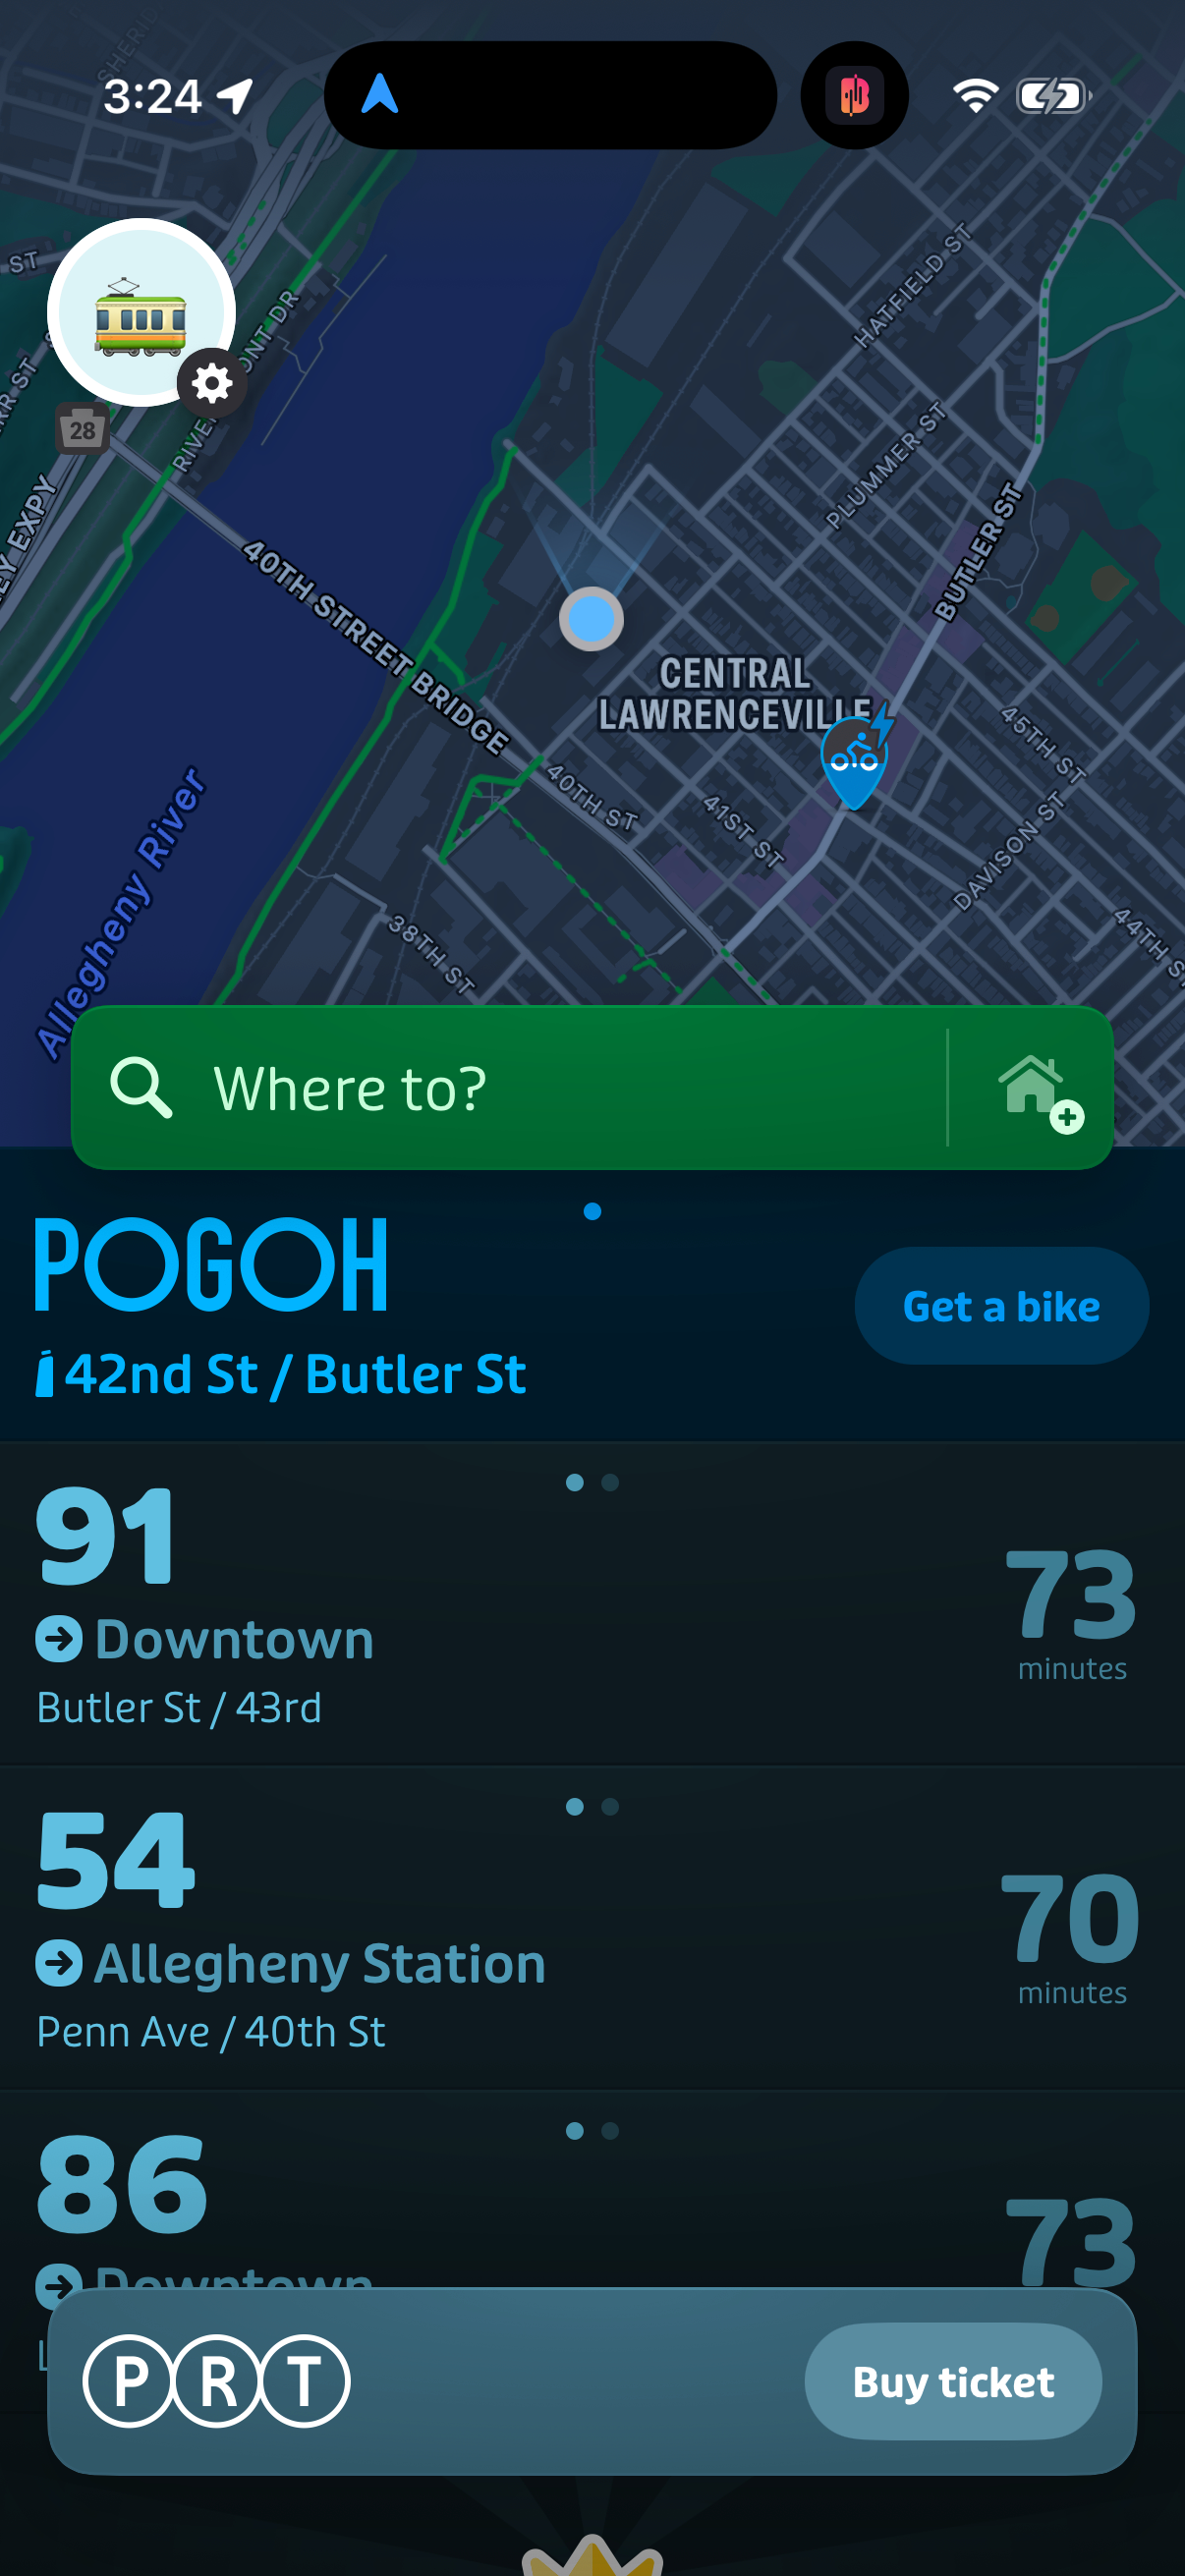
Transit1206 × 2622opens the full image 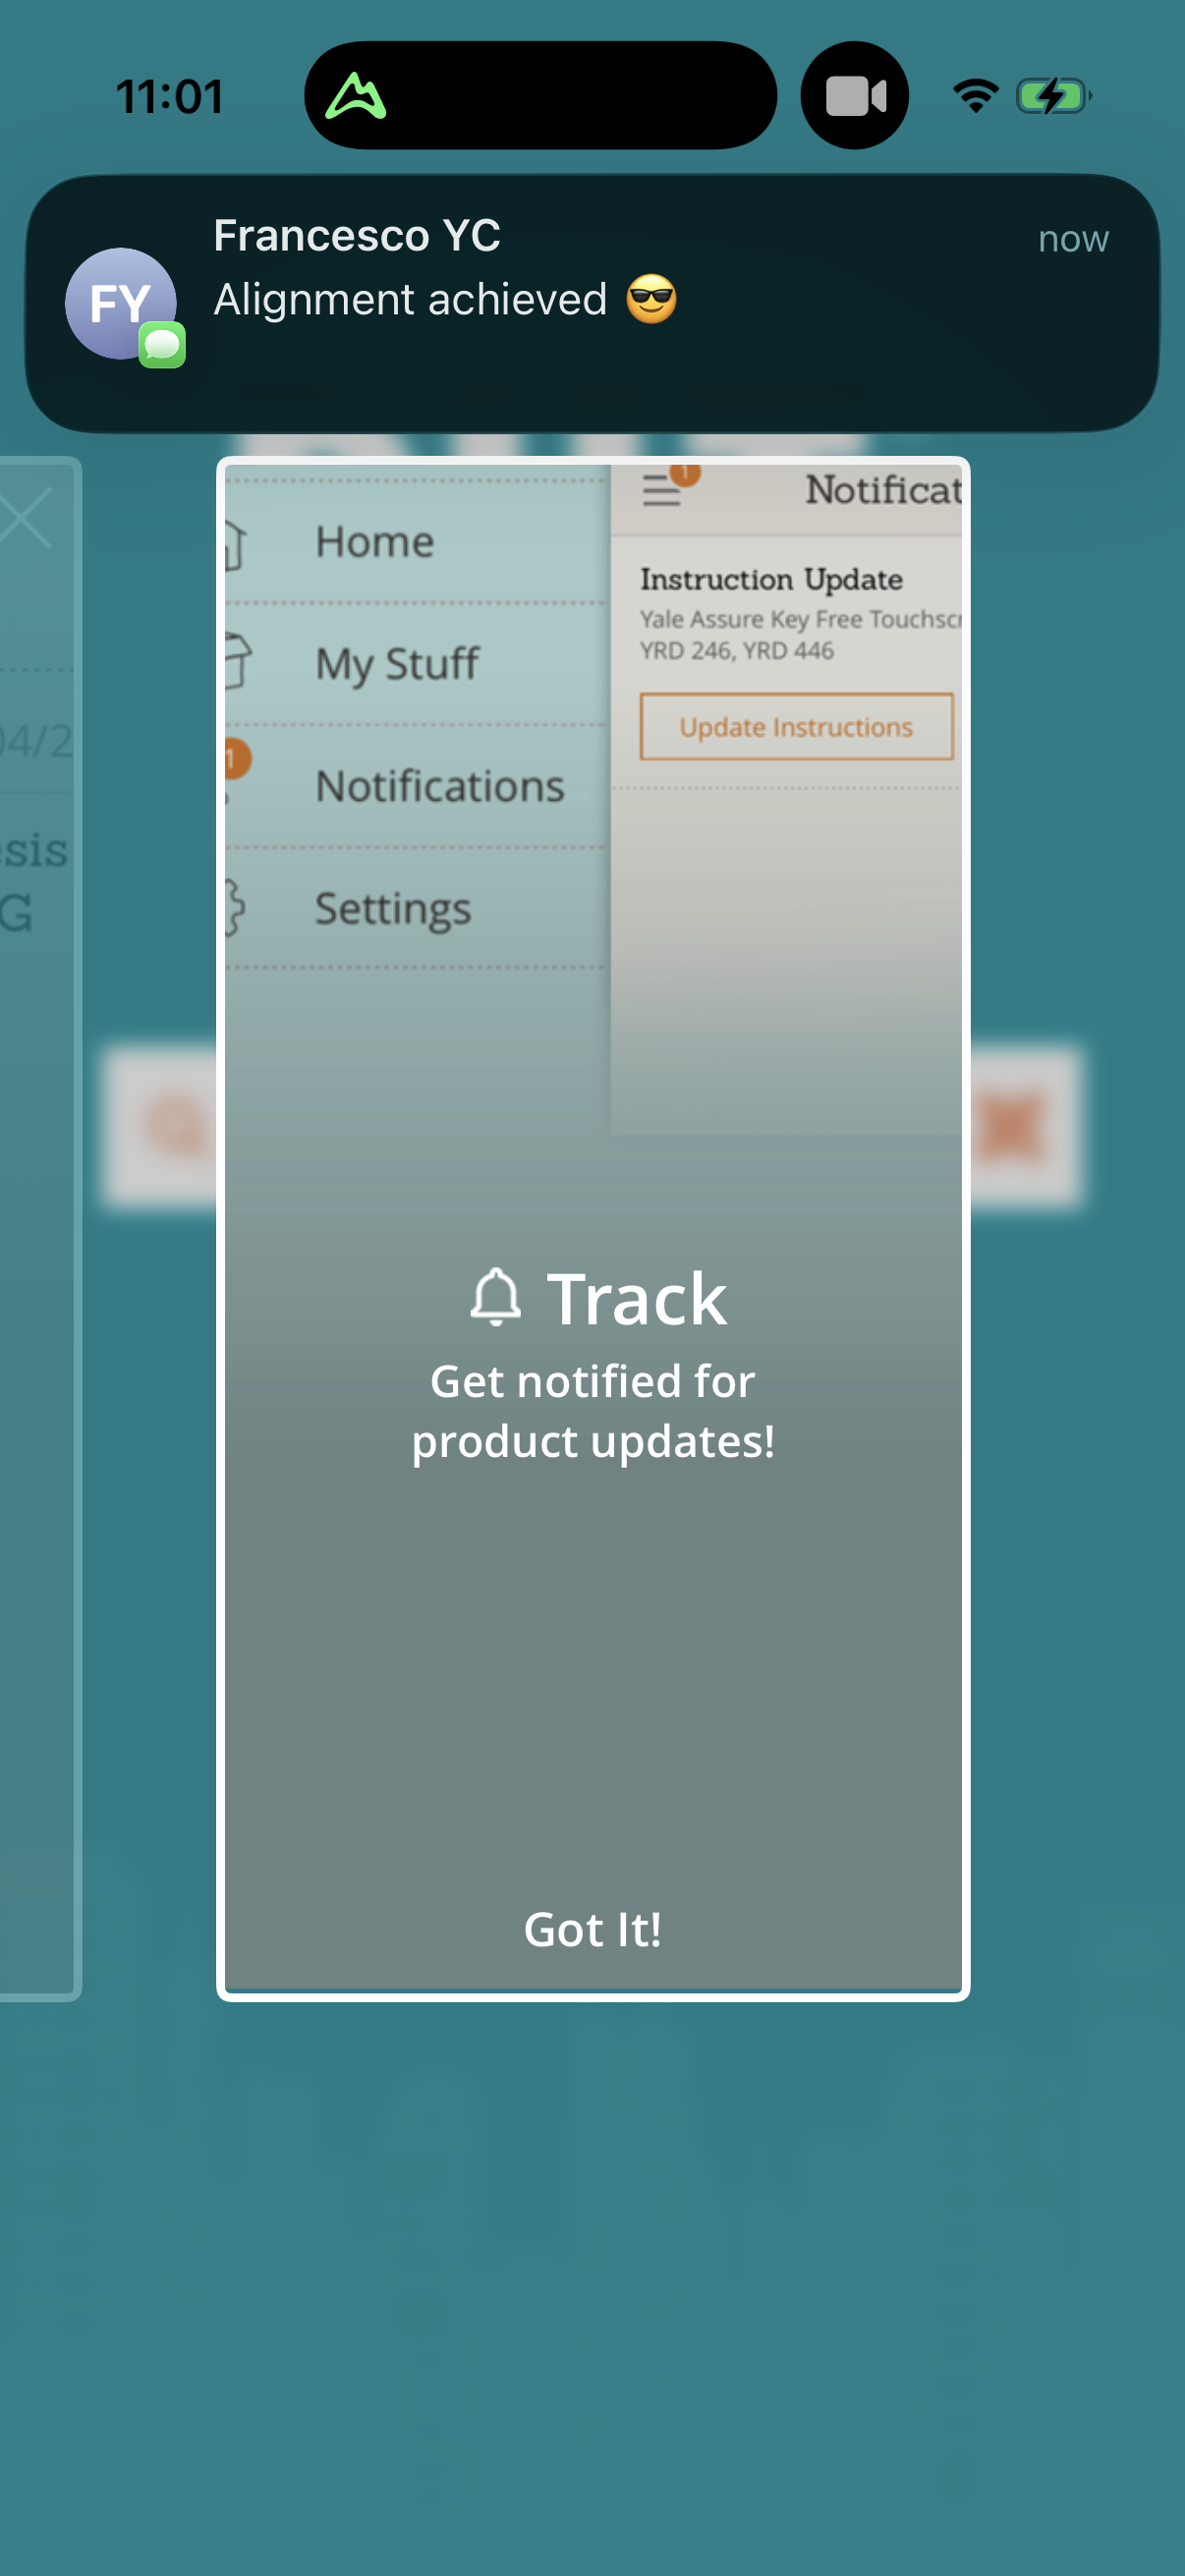
Bilt1206 × 2622opens the full image 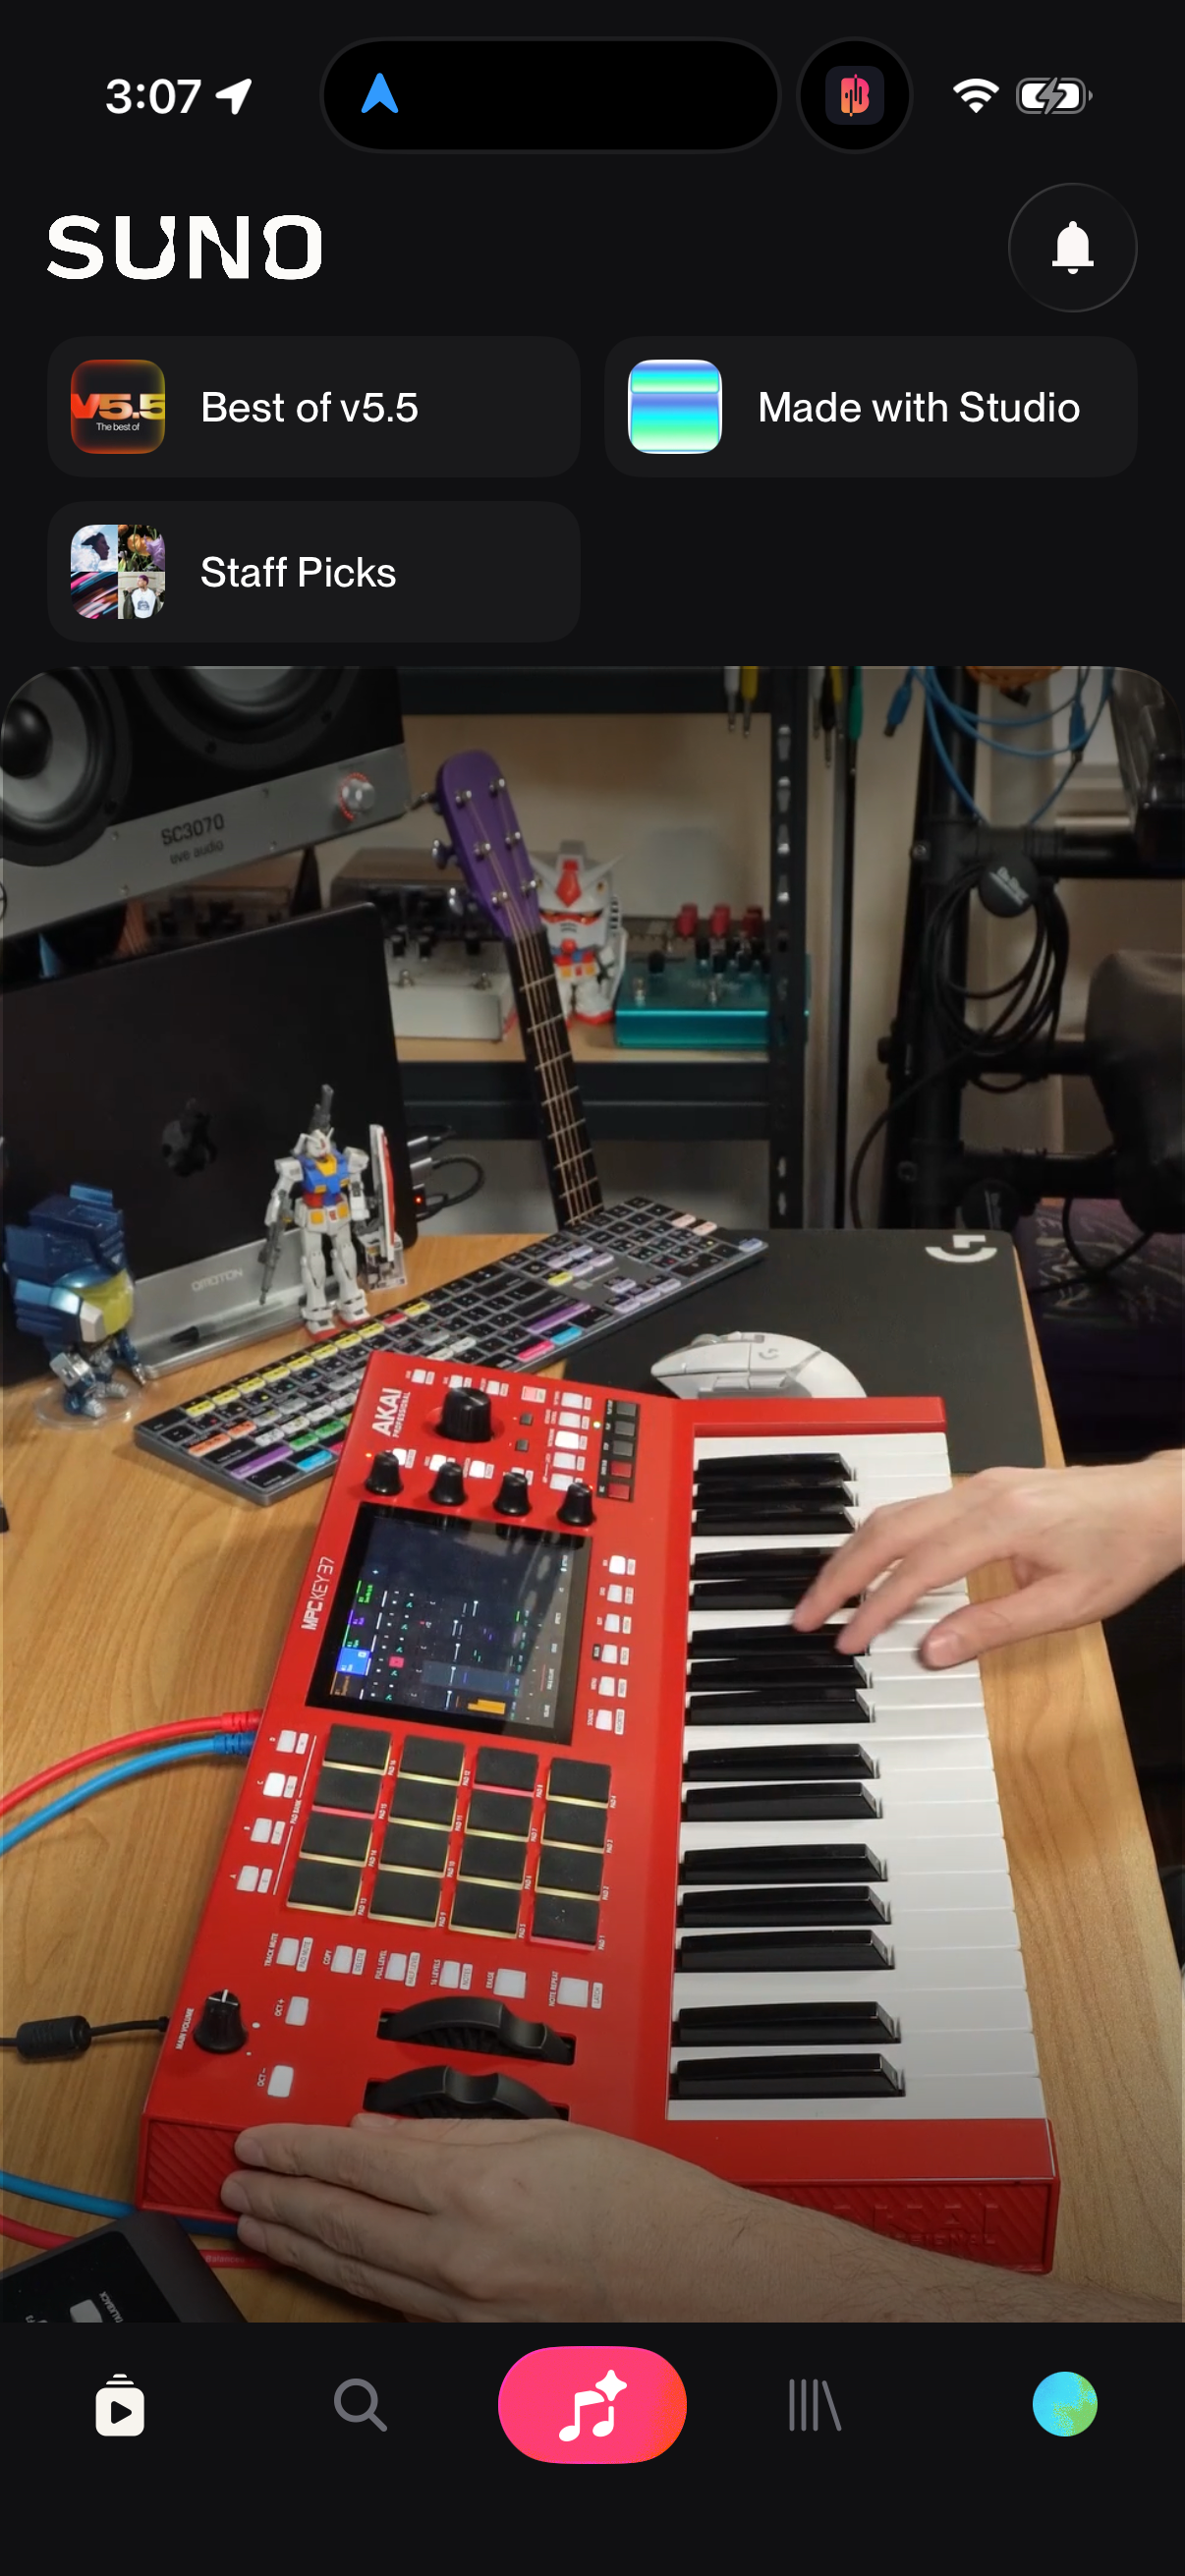
Suno1206 × 2622opens the full image
The numbers
| # | Stat | Computed from |
|---|---|---|
| 01 | 9,645/11,753 (82%)s1 | web_in_product_screens: 9,645/11,753 |
| 02 | 1,351 settings screenss2 | web_in_product_screens sql note: Settings=1,351 |
| 03 | 1,088 dashboard screenss3 | web_in_product_screens sql note: dashboard=1,088 |
| 04 | 35% (112/321) mobiles4 | upgrade_entry_in_settings: 112/321 |
Methodology
Universe: 11,753 labeled desktop web product screens (distinct web corpus), plus a mobile settings comparison. Method: in-product share and surface counts from sites_screen_labels, July 2026. Caveat: web and mobile are distinct universes; counts are labels, not conversion.
Sources
- [4]
Lazyweb Research analysis of 11,753 labeled desktop web product screens (distinct web corpus), July 2026
Web (sites_screen_labels) and mobile (screenshots) are distinct universes and largely different companies; never mix the 809-app denominator with the 11,753 web-screen denominator.
- [3]
Lazyweb Research analysis of 23,407 canonical mobile screens (tracked app corpus), July 2026
Canonical-screen category counts; is_paywall is NULL on 21,824/23,407 rows so gating is reported as app-count prevalence or absolute screen counts, never as a share of all screens.
Source: Lazyweb Research — proprietary analysis of real, in-market app screens. Cite as Lazyweb Research, 2026-07-07.