Do advertising-model apps upsell differently than subscription apps?
- By Ali Abouelatta
- n = 176
- Published
- Updated
- 2 min read
- monetization · upsell · paywall · saas · mobile
Short answer
Yes. Advertising-model apps run in-product upgrade banners less often than subscription apps — 43% (75/176) vs 56% (232/417) — and lean less on hard gating (26% unlock CTA, 16% lock gating vs 32% and 20% for subscription).source[2] The banner intent also differs: advertising upsells typically pitch 'remove ads' rather than 'unlock a feature'. If you monetize with ads, expect a lighter, single-banner motion.
Advertising apps run upgrade banners in 43% of cases (75/176) vs 56% for subscription apps — Lazyweb Research, July 2026.
Bar chart · Advertising (n=176)
Advertising (n=176) — Finding: lighter gating on the ad side
One block is about 1.5%
- Upgrade banner / prompt
- 43% (75)
- Unlock CTA
- 26% (45)
- Lock-icon gating
- 16% (29)
- Usage / limit gating
- count only (6)
Finding: lighter gating on the ad side
Side-by-side, by distinct company:source[2]
| Mechanic | Advertising (n=176) | Subscription (n=417) |
|---|---|---|
| Upgrade banner / prompt | 43% (75) | 56% (232) |
| Unlock CTA | 26% (45) | 32% (133) |
| Lock-icon gating | 16% (29) | 20% (84) |
| Usage / limit gating | count only (6) | 8% (34) |
Advertising apps sit below subscription apps on every comparable mechanic — consistent with the ad model already extracting value from free users, so the upsell is a lighter 'pay to remove ads' offer rather than pervasive feature locks.
How to apply
If ads are your primary revenue, don't copy a subscription app's dense gating — the category norm is a single upgrade banner (43%) framed around removing ads or friction, not locking core features. Keep unlock CTAs for genuinely premium extras (26% of ad apps use them). If you're subscription-first, the reverse holds: heavier gating is normal and expected.
Caveats
Advertising x usage/limit gating is only 6 apps (N<8) and is reported as a count, not a percentage.source[2] Banner framing ('remove ads' vs 'unlock feature') is an interpretation of the model, not a separately measured tag. All shares are company-deduped lower bounds from LLM tags.source[2]
Real in-market screens
Screens from real, in-market apps, tracked by Lazyweb Research.
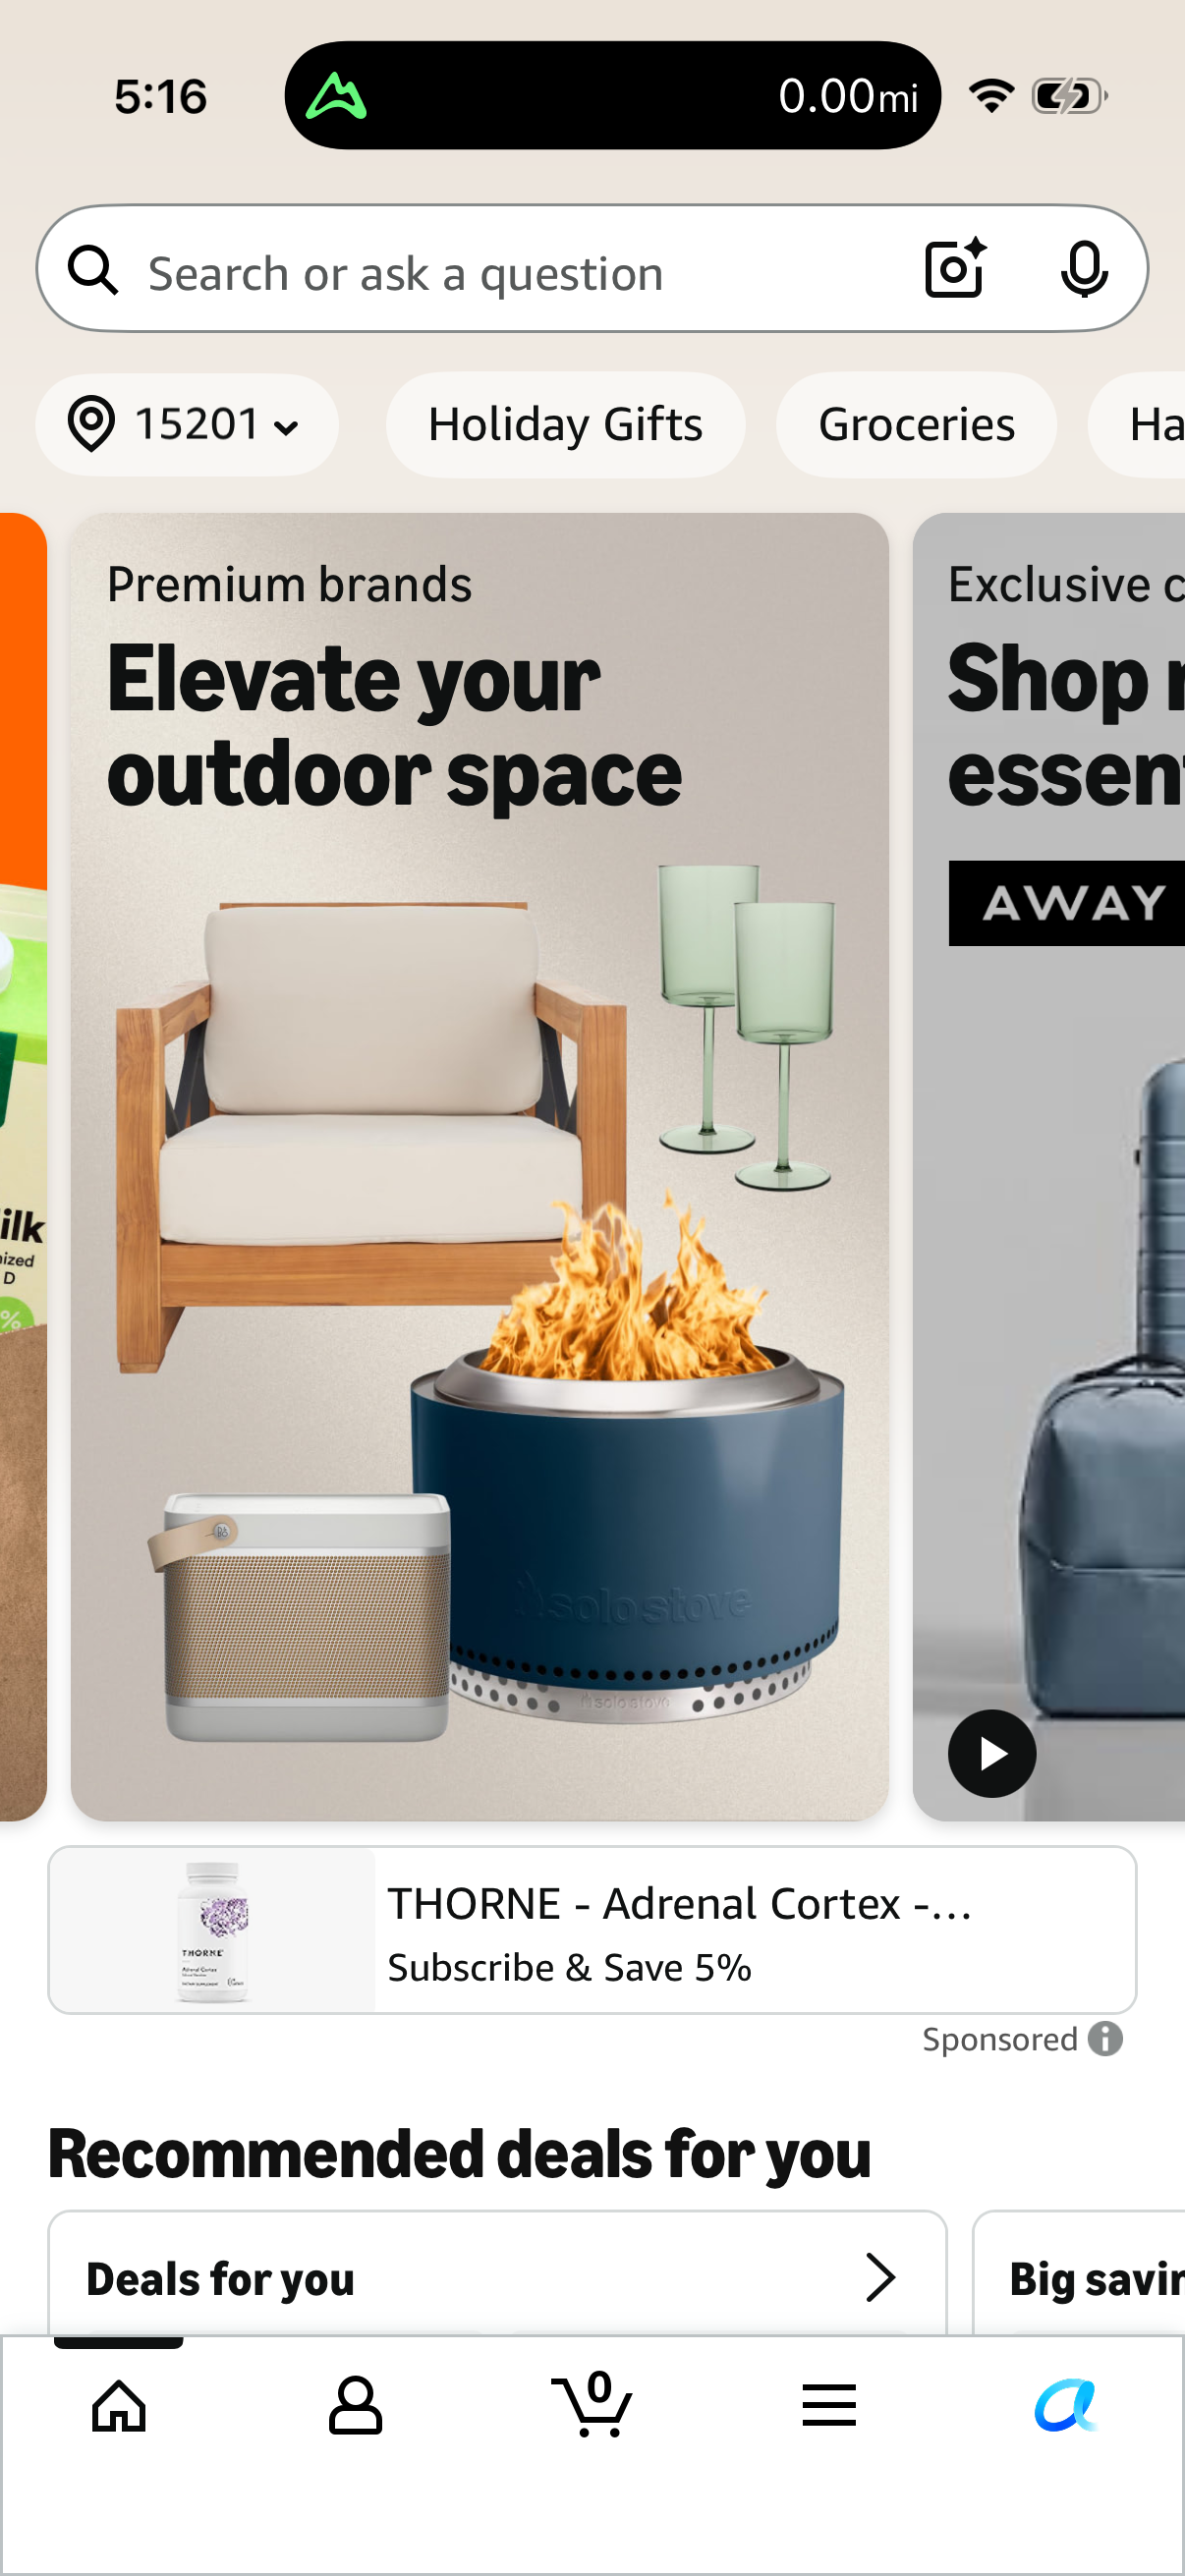
Amazon1206 × 2622opens the full image 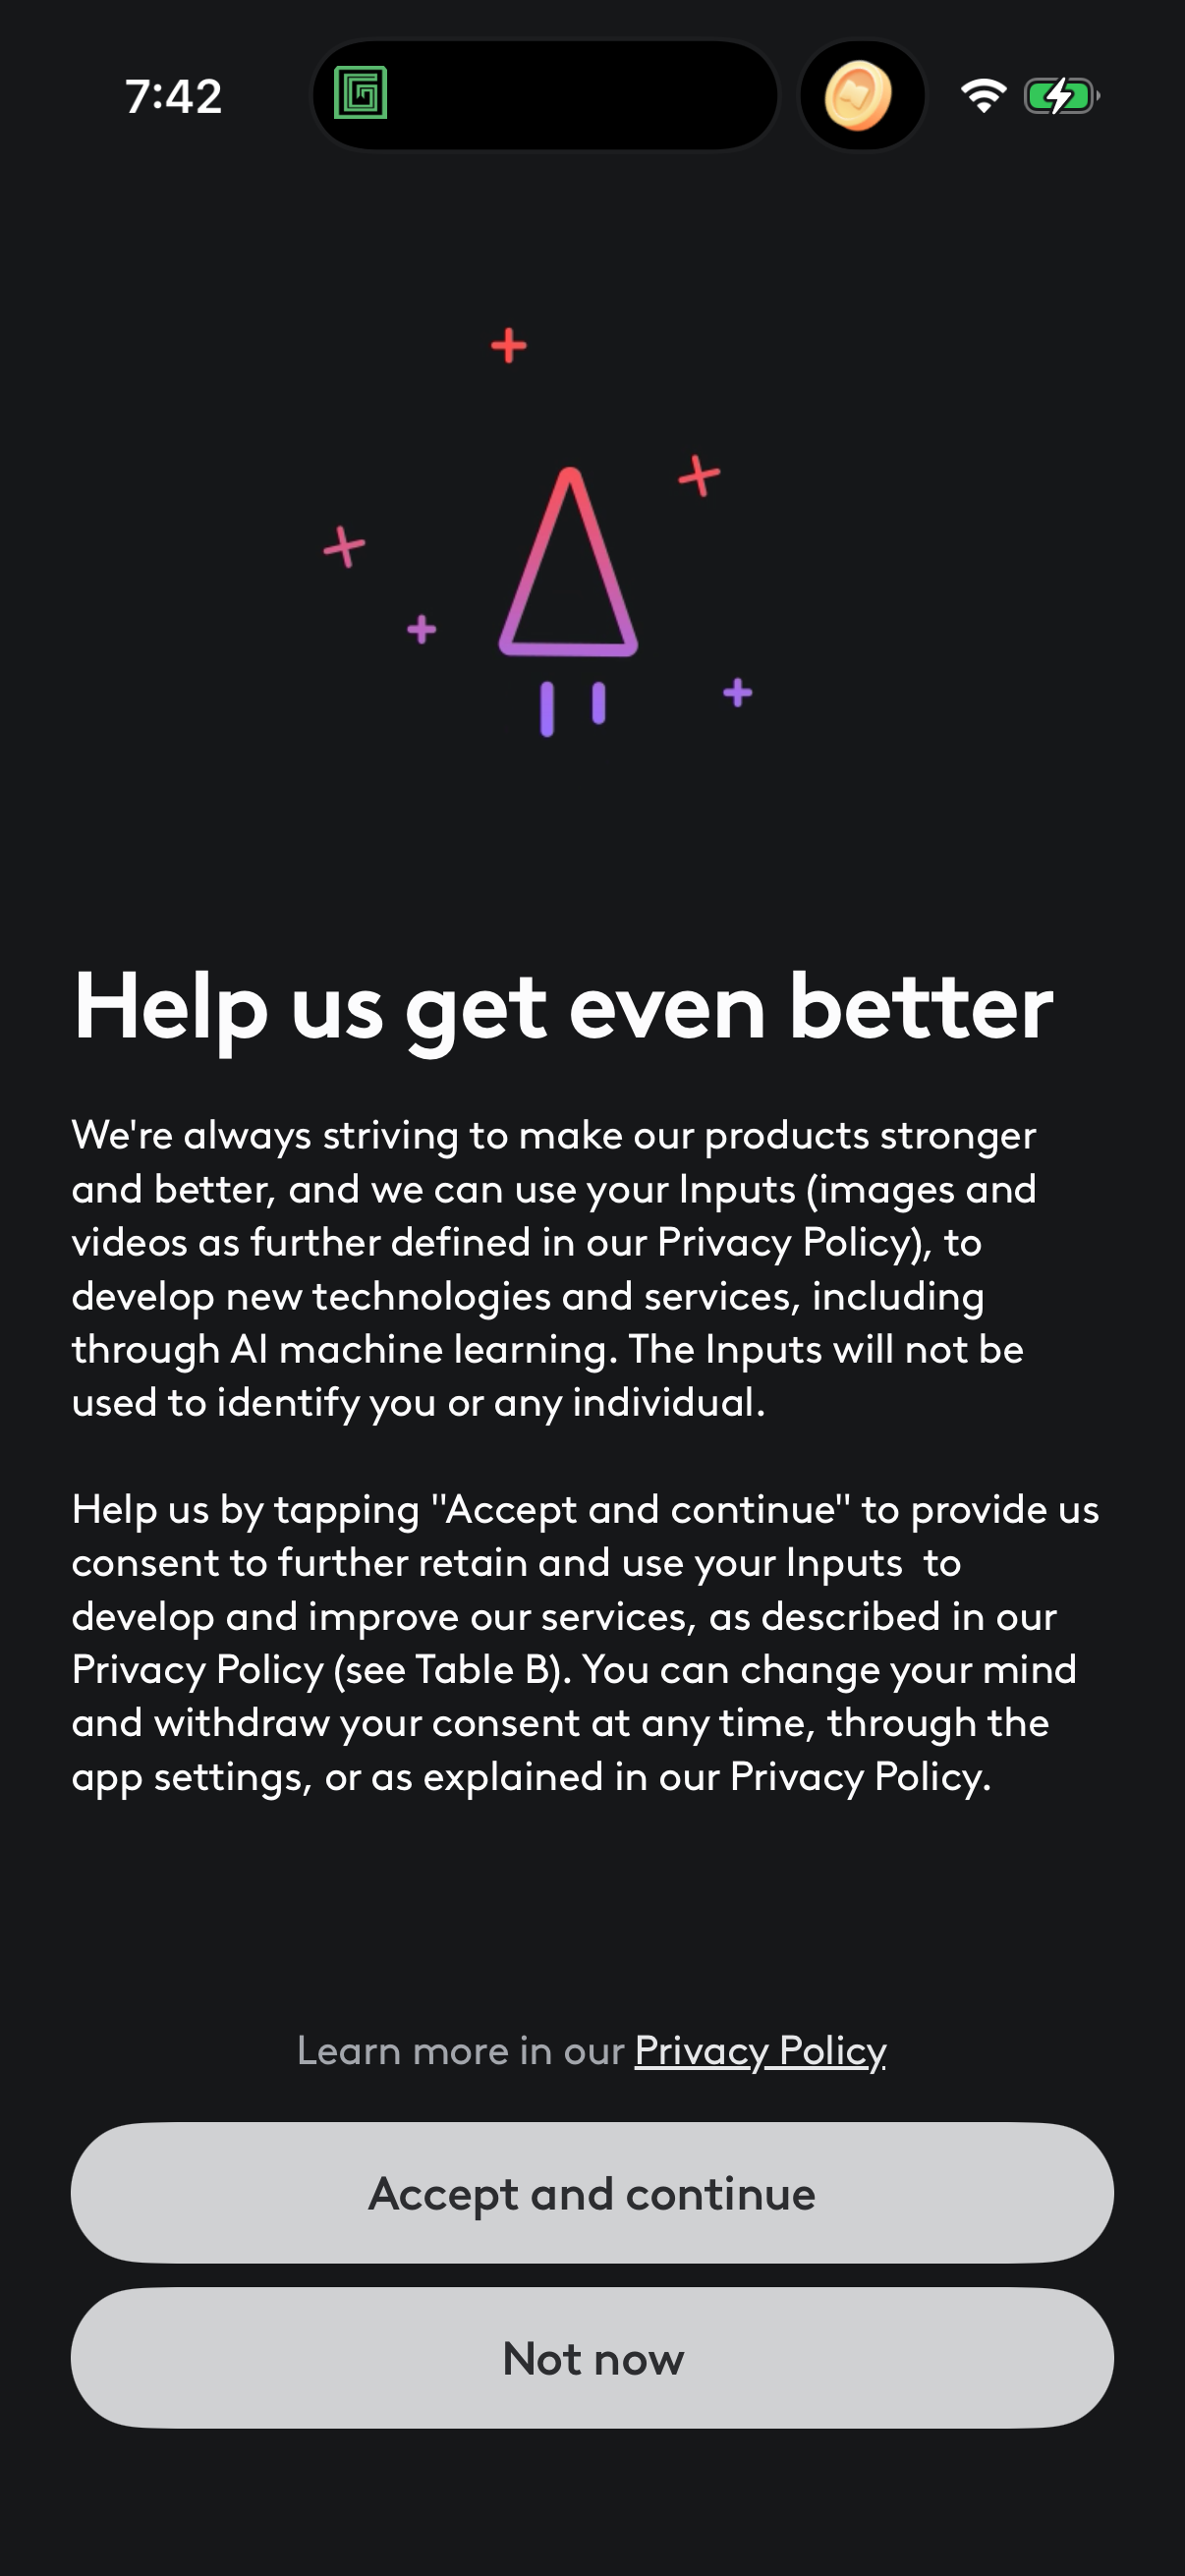
Videoleap1206 × 2622opens the full image 
Buzzfeed1206 × 2622opens the full image 
Zara1206 × 2622opens the full image
The numbers
| # | Stat | Computed from |
|---|---|---|
| 01 | 43% (75/176)s1 | bm_advertising_upgrade_banner: 75/176 |
| 02 | 56% (232/417)s2 | bm_subscription_upgrade_banner: 232/417 |
| 03 | 26% (45/176)s3 | bm_advertising_unlock_cta: 45/176 |
| 04 | 32% (133/417)s4 | bm_subscription_unlock_cta: 133/417 |
| 05 | 16% (29/176)s5 | bm_advertising_lock_gating: 29/176 |
| 06 | 20% (84/417)s6 | bm_subscription_lock_gating: 84/417 |
| 07 | 6 apps (count only)s7 | smallSampleWarnings: Advertising x usage gating = 6 apps |
| 08 | 8% (34/417)s8 | bm_subscription_usage_gating: 34/417 |
Methodology
Universe: 809 tracked mobile apps with business-model attributes (Advertising=176, Subscription=417). Method: mechanic x business-model cross-tab deduped by distinct company, July 2026. Caveat: cells below N=8 (e.g. Advertising x usage gating) reported as counts.
Sources
- [2]
Lazyweb Research analysis of 809 apps (tracked mobile app corpus, business-model cross-tab), July 2026
Business-model attributes populated on ~800 tracked apps (Subscription=417, Advertising=176, Cross-subsidized Funnel=124 in this cross-tab); each mechanic deduped by distinct company.
Source: Lazyweb Research — proprietary analysis of real, in-market app screens. Cite as Lazyweb Research, 2026-07-07.