Should I use a usage meter or a hard lock to gate a feature?
- By Ali Abouelatta
- n = 809
- Published
- Updated
- 2 min read
- paywall · upsell · monetization · ux-patterns · mobile · saas
Short answer
The market strongly favors hard locks: lock-icon gating appears in 12% of 809 apps (94/809) and unlock CTAs in 20% (159/809), while usage-meter/limit gating is used by only 5% (44/809).source[1] Usage gating is also shallow — 44 apps across just 69 screenshots — so it's a specialist tool for consumable value, not a default. Choose a hard lock for discrete features and a meter only when a count of runs/credits is the actual product.
Hard-lock gating (12% of apps) outnumbers usage-meter gating (5%) roughly 2-to-1 — Lazyweb Research, July 2026.
Bar chart · Share
Share — Finding
One block is about 0.7%
- Unlock CTA (hard unlock)
- 20%
- Lock-icon gating (hard lock)
- 12%
- Usage-meter / limit gating
- 5%
Finding
Prevalence across 809 apps:source[1]
| Approach | Apps | Share | Screenshots |
|---|---|---|---|
| Unlock CTA (hard unlock) | 159 | 20% | 658 |
| Lock-icon gating (hard lock) | 94 | 12% | 410 |
| Usage-meter / limit gating | 44 | 5% | 69 |
The usage-gating footprint is notably thin — roughly 1.6 screenshots per app — implying it typically shows up as a single 'limit reached' state rather than a pervasive metered experience.source[1]
How to apply
Default to a hard lock (lock icon + unlock CTA) when the gated thing is a discrete, binary feature: an export, a filter, a premium chapter. Use a usage meter only when consumption is inherently countable and the count is part of the value story — credits, generations, daily runs. If you pick a meter, budget for the metering infrastructure and a clear 'limit reached' upsell state; it's a heavier build than a static lock for a reason few apps take it on.
Caveats
Usage-gating prevalence (44 apps / 69 screenshots) is flagged thin — treat it as directional and avoid per-category cuts.source[1] All figures are company-deduped lower bounds from tightened LLM tags; raw %usage% was rejected for data-usage-disclosure false positives.source[1]
Real in-market screens
Screens from real, in-market apps, tracked by Lazyweb Research.
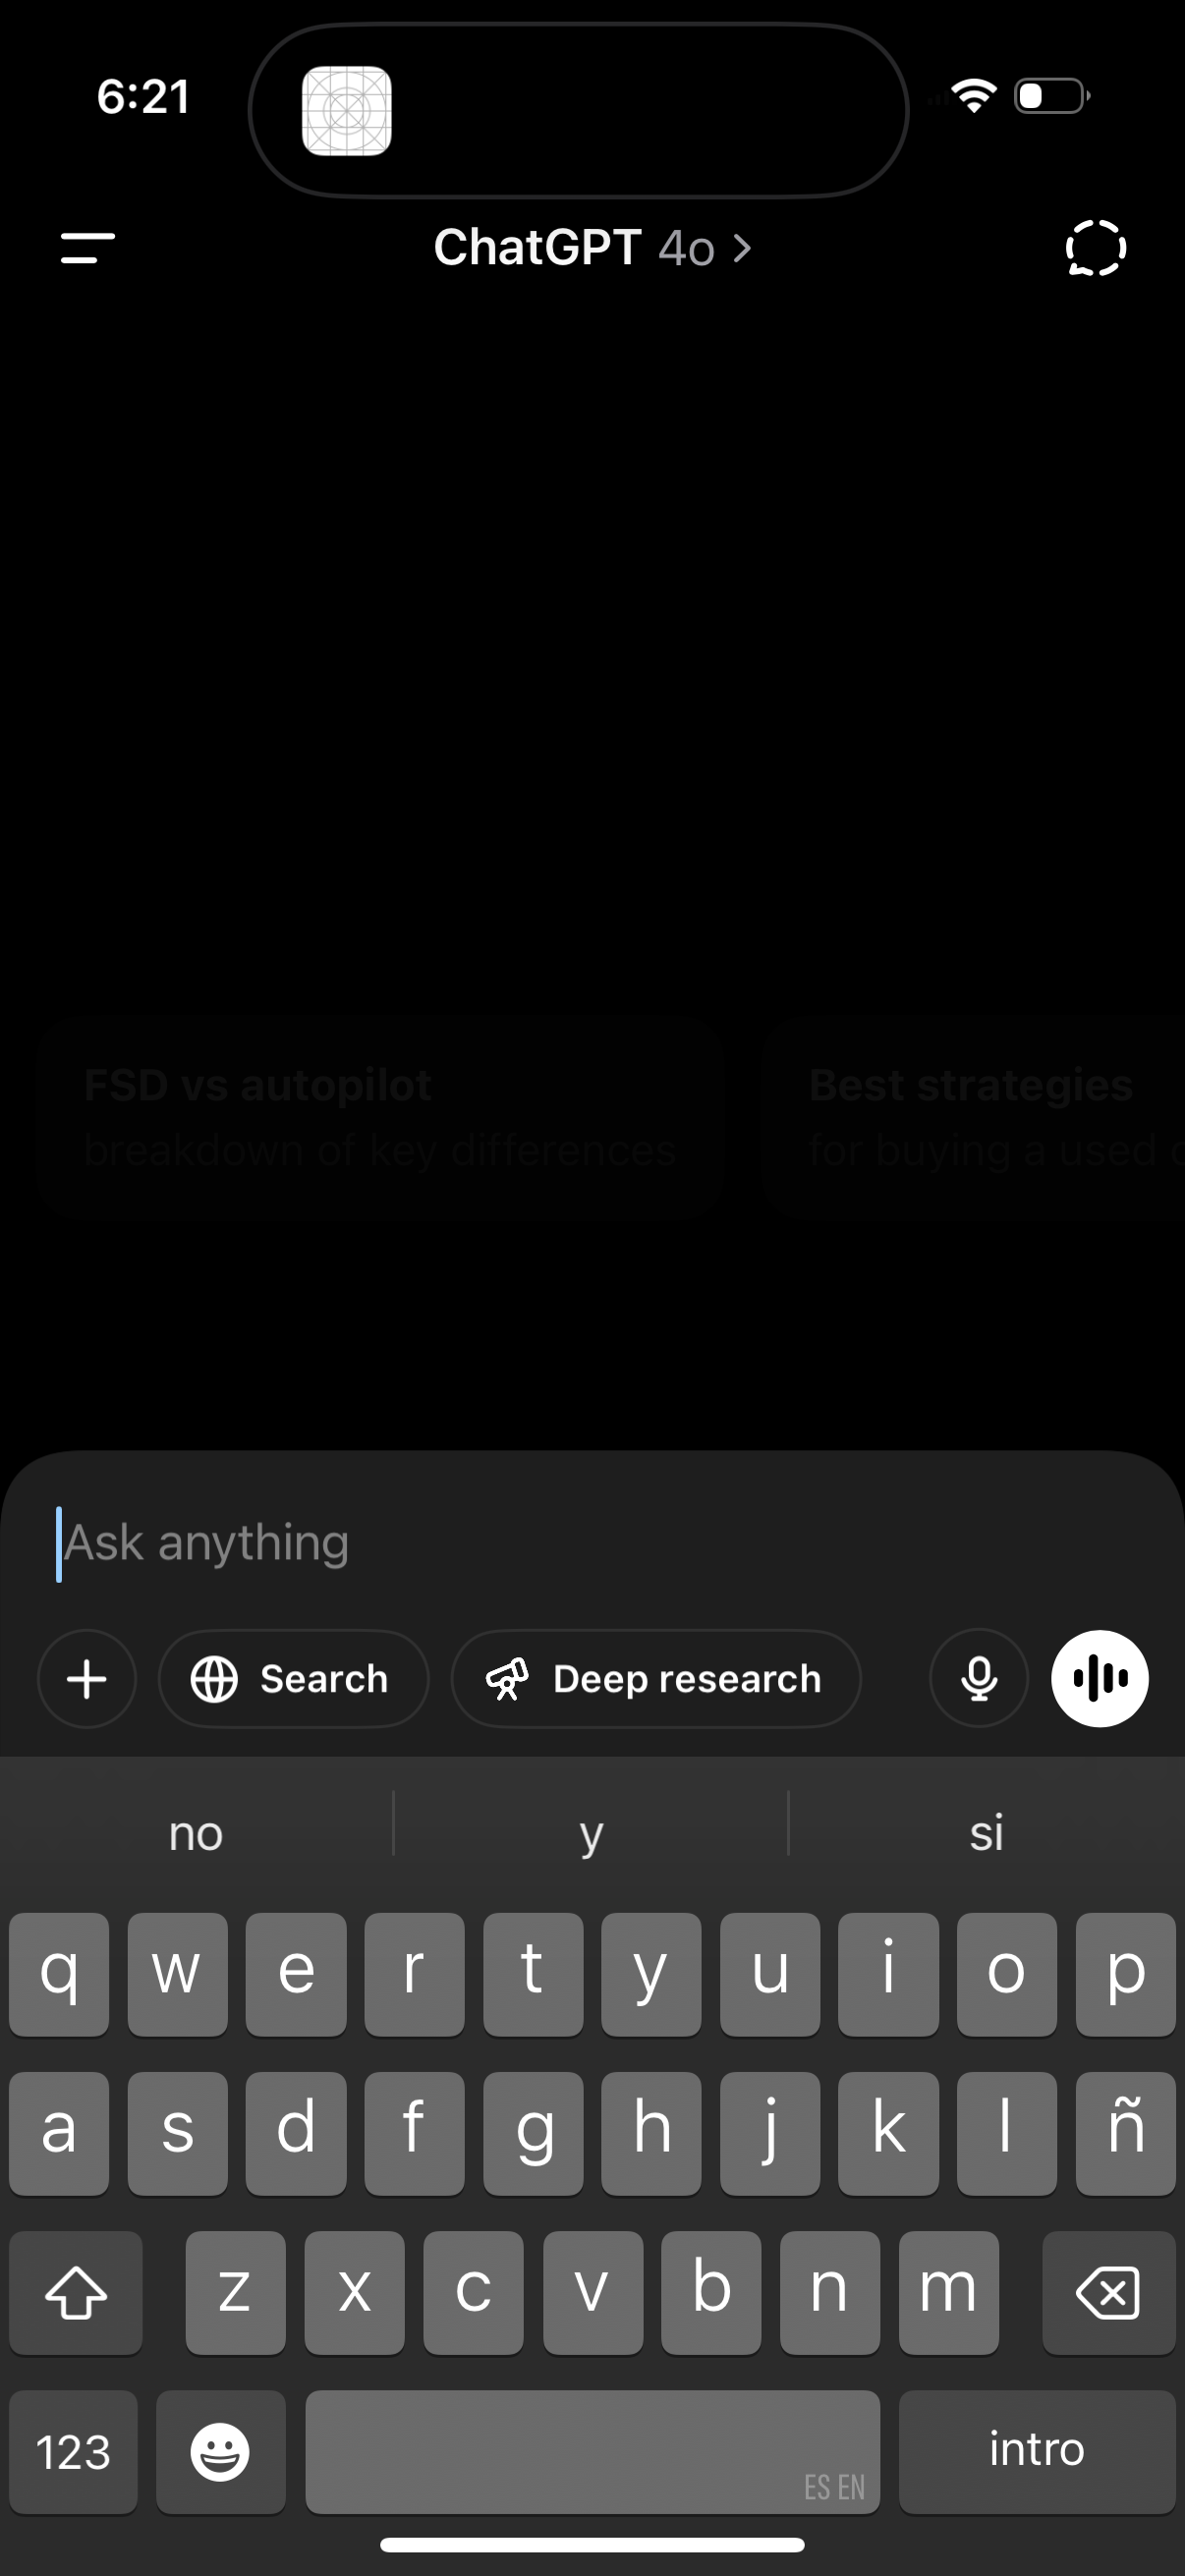
Chatgpt1206 × 2622opens the full image 
Google Photos1290 × 2796opens the full image 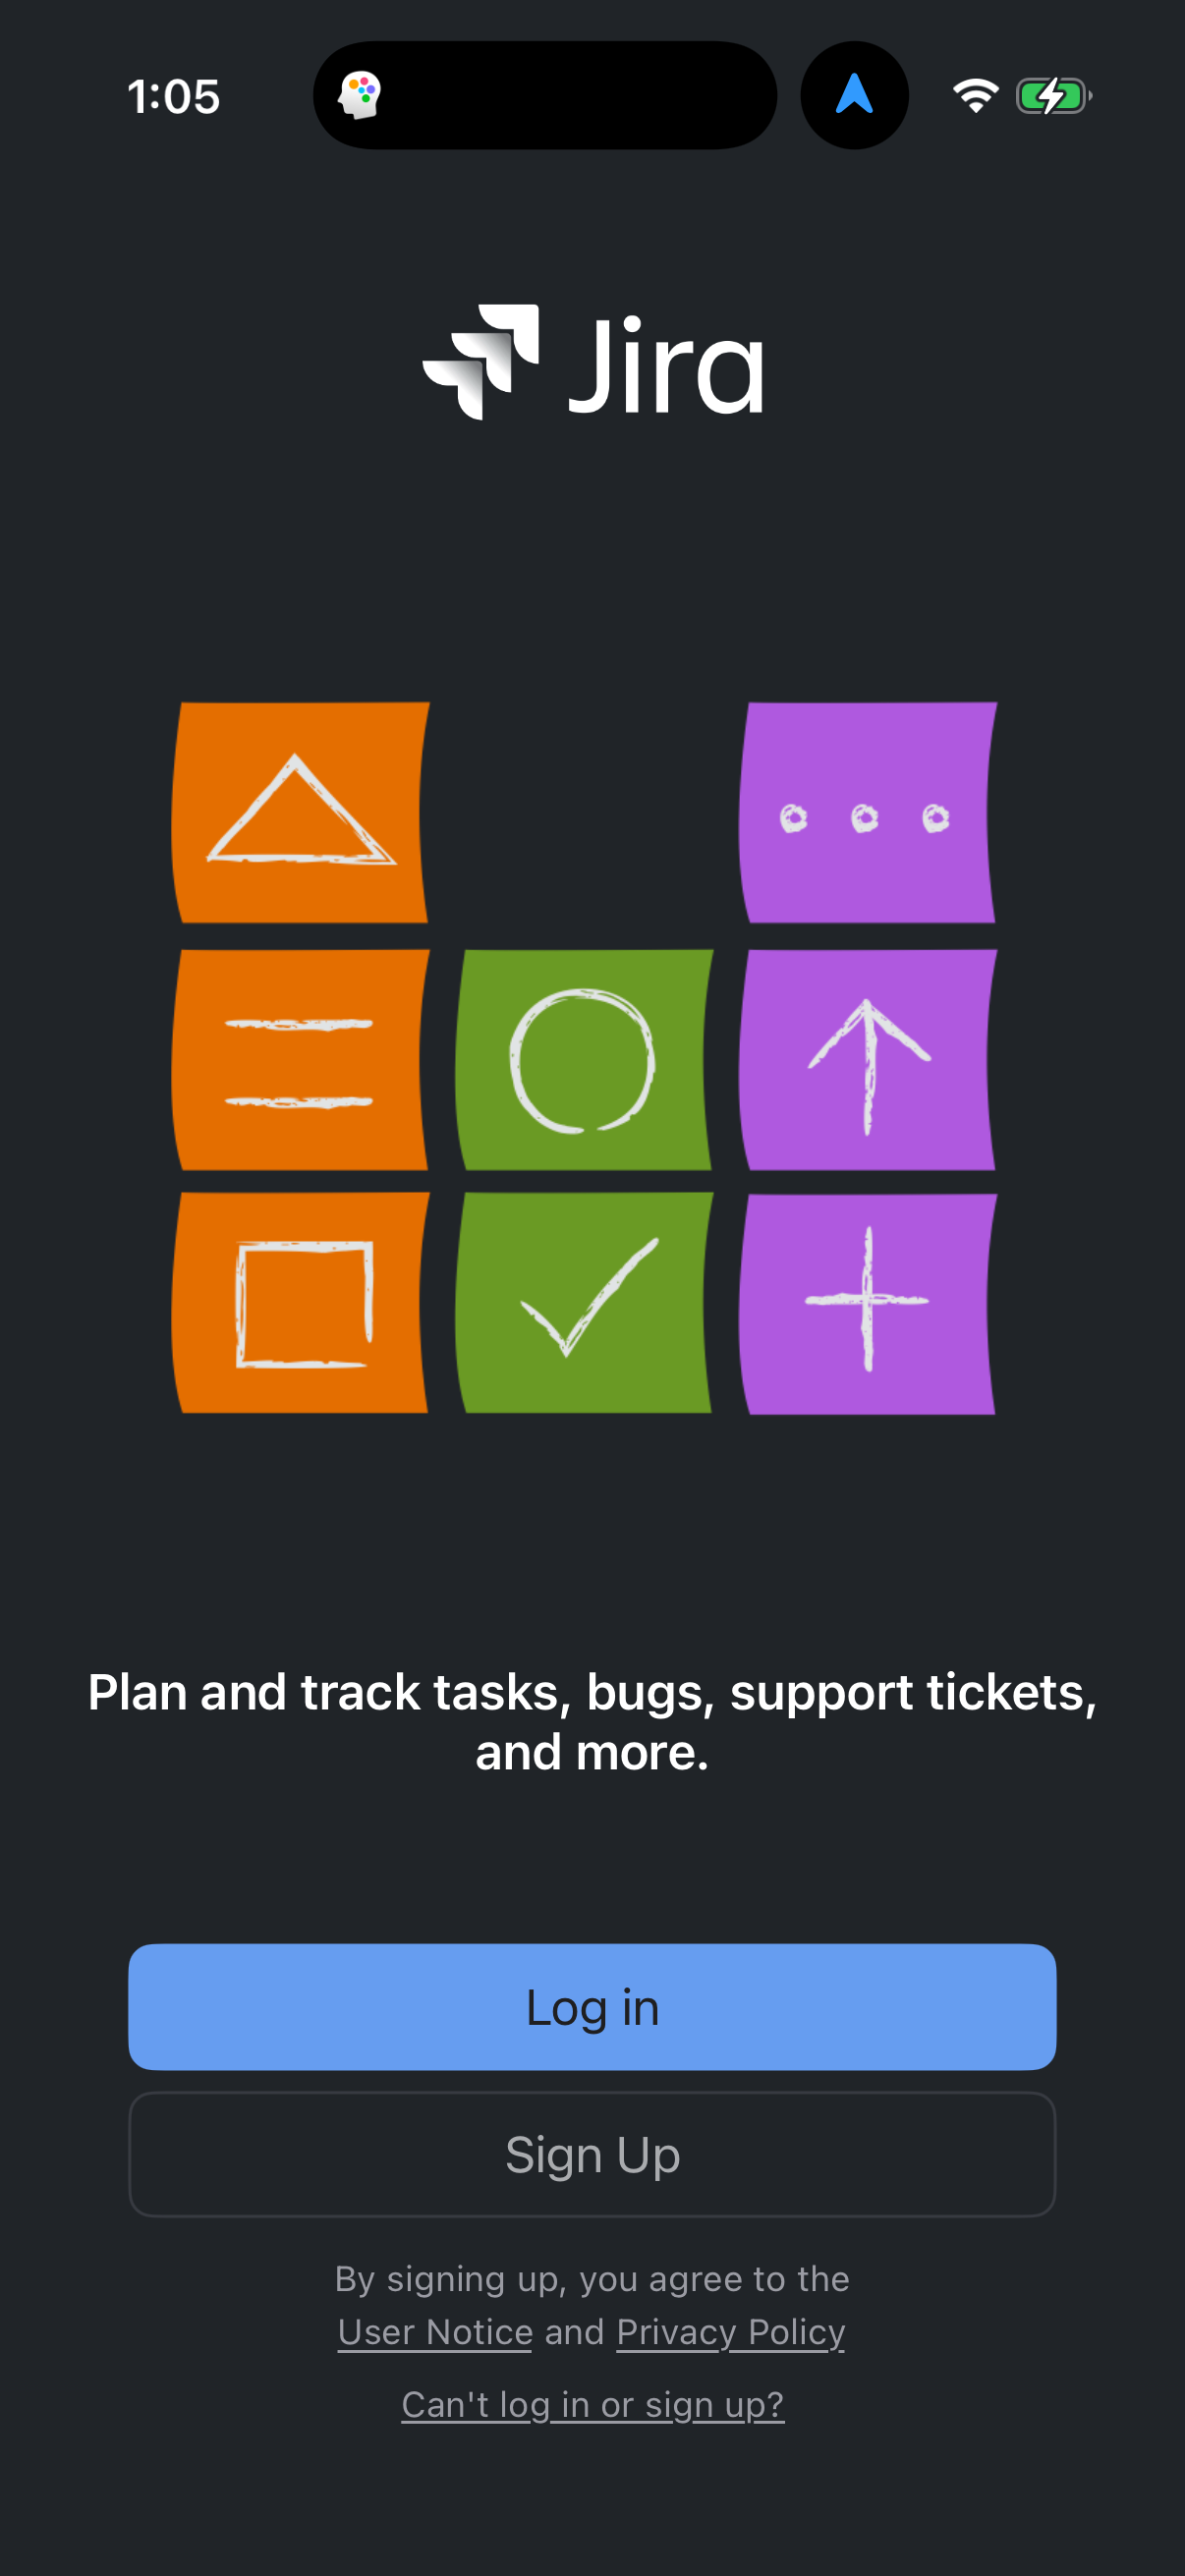
Jira1206 × 2622opens the full image 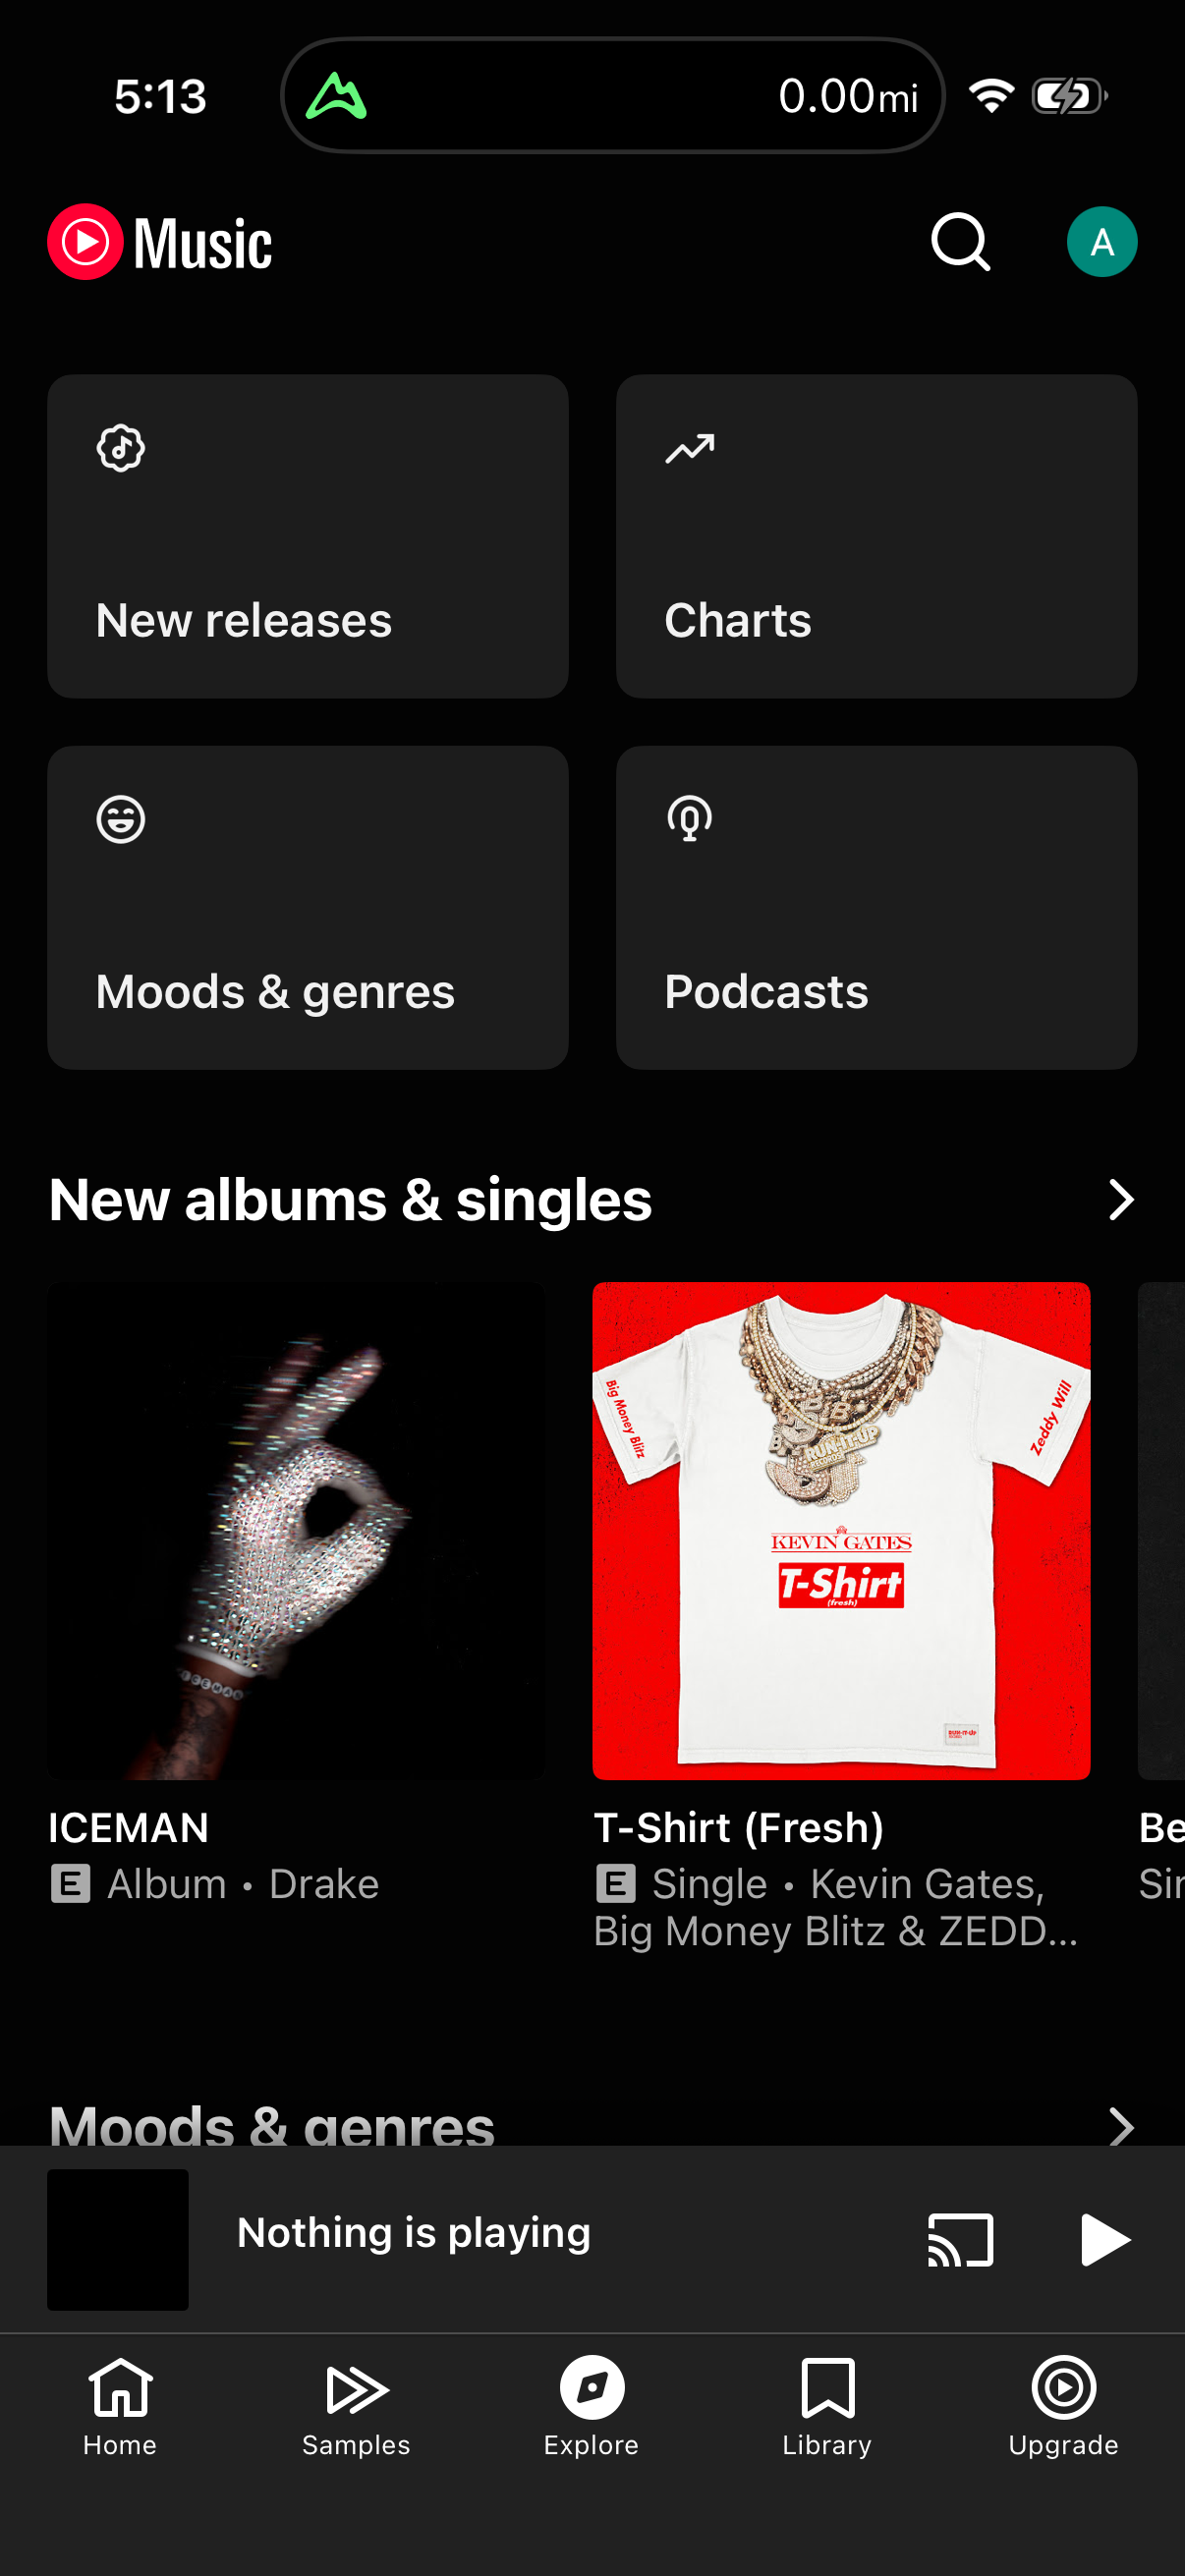
Youtube Music1206 × 2622opens the full image
The numbers
| # | Stat | Computed from |
|---|---|---|
| 01 | 12% (94/809), 410 screenshotss1 | lock_icon_gating_prevalence: 94/809 |
| 02 | 20% (159/809), 658 screenshotss2 | unlock_cta_prevalence: 159/809 |
| 03 | 5% (44/809), 69 screenshotss3 | usage_meter_limit_gating_prevalence: 44/809 |
Methodology
Universe: 809 tracked mobile apps with 44,873 tagged screenshots. Method: app-count prevalence (COUNT DISTINCT company) over tightened LLM synonym tag patterns, July 2026. Caveat: tag-based prevalence is a lower bound; raw single-word patterns (%lock%, %usage%, %blur%) were rejected for security/media/data-usage false positives.
Sources
- [1]
Lazyweb Research analysis of 809 apps (tracked mobile app corpus with screenshots), July 2026
Prevalence deduped by COUNT(DISTINCT company_name) over 44,873 tagged screenshots; tag patterns are LLM synonym phrases (tightened after spot-checking) so every stat is a lower bound.
Source: Lazyweb Research — proprietary analysis of real, in-market app screens. Cite as Lazyweb Research, 2026-07-07.