Premium badge or unlock CTA: which pattern do more apps use to signal a gated feature?
- By Ali Abouelatta
- n = 809
- Published
- Updated
- 2 min read
- upsell · paywall · ux-patterns · mobile · design · saas
Short answer
Premium/pro badges are slightly more common than unlock CTAs: 22% of 809 apps (176/809) put a premium or pro badge on a gated feature, versus 20% (159/809) that use an explicit 'unlock' CTA.source[1] Both sit above lock-icon gating (12%, 94/809).source[1] Badges label; unlock CTAs act — most mature apps use them together, one to mark the feature and one to convert the tap.
22% of apps (176/809) badge gated features as premium; 20% (159/809) use an unlock CTA — Lazyweb Research, July 2026.
Bar chart · Share
Share — Finding
One block is about 0.8%
- Premium / pro badge
- 22%
- Unlock CTA
- 20%
- Lock-icon gating
- 12%
Finding
Across 809 apps:source[1]
| Signal | Apps | Share | Role |
|---|---|---|---|
| Premium / pro badge | 176 | 22% | Marks the feature as paid |
| Unlock CTA | 159 | 20% | Converts the intent |
| Lock-icon gating | 94 | 12% | Visually locks the item |
The badge and the CTA are close in prevalence and complementary: a badge sets the expectation before the tap, an unlock CTA captures it at the tap.
How to apply
Use a premium/pro badge to pre-label gated features so users aren't surprised at the wall — this is the single most-used labeling device (22%). Pair it with an unlock CTA on the actual gate so the tap has somewhere to go (20%). A lock icon (12%) is a stronger visual stop; use it when you want the item to read as clearly unavailable rather than merely 'premium'.
Caveats
The three mechanics overlap — an app can badge, lock, and offer an unlock CTA on the same feature — so shares sum to more than the count of distinct apps. All are company-deduped lower bounds from LLM synonym tags.source[1]
Real in-market screens
Screens from real, in-market apps, tracked by Lazyweb Research.
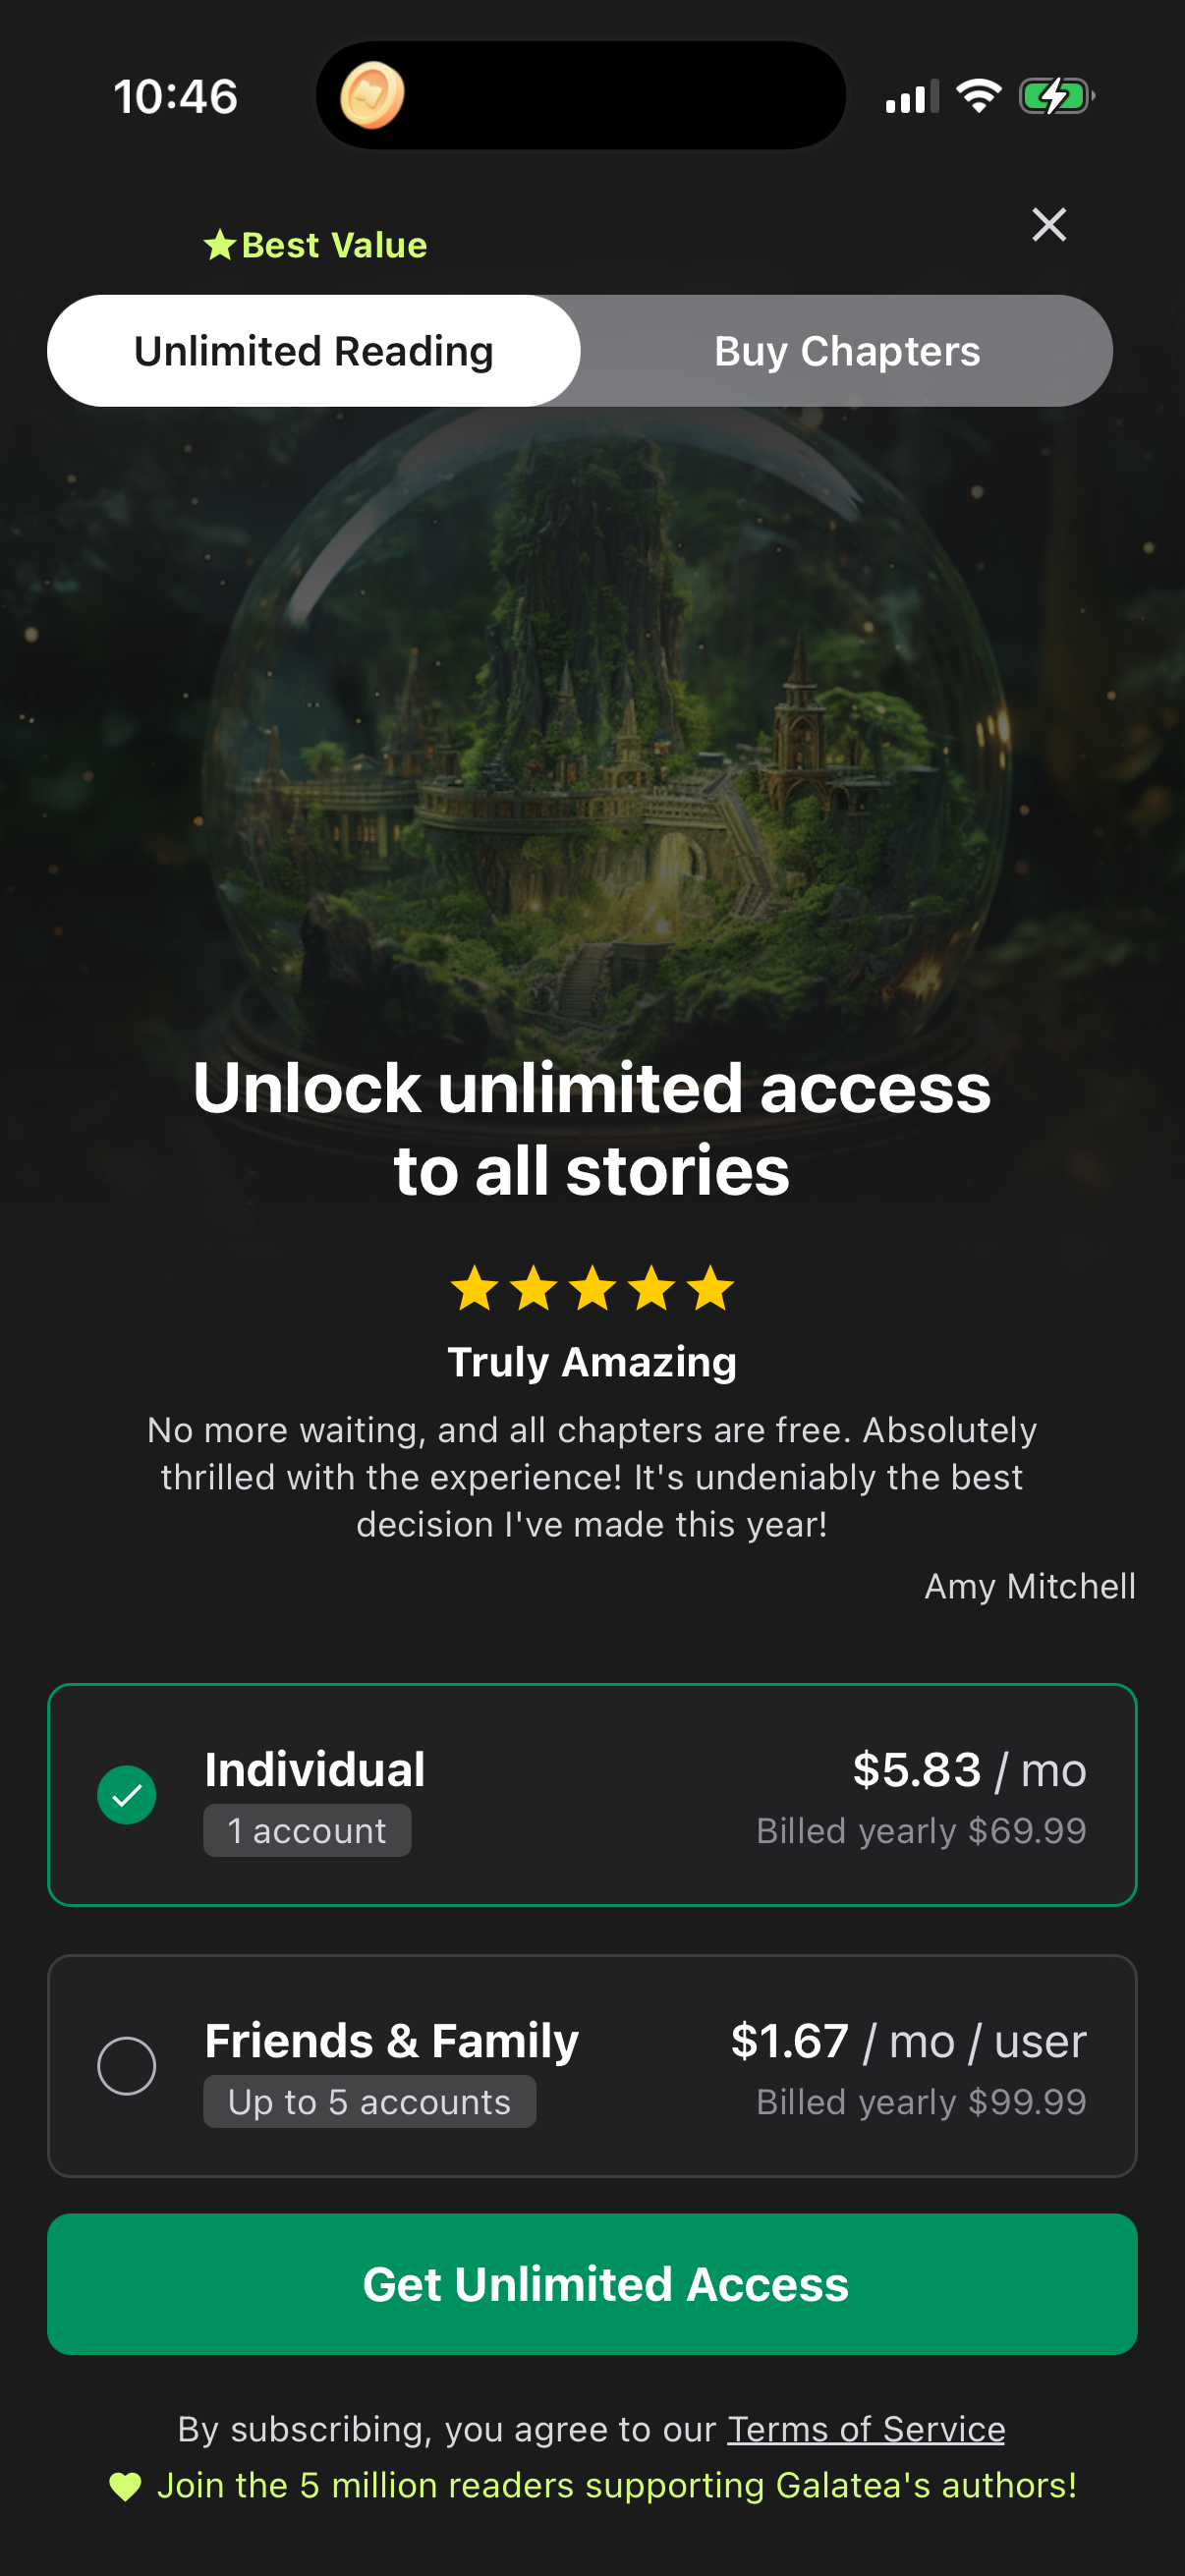
Galatea1206 × 2622opens the full image 
Doordash1206 × 2622opens the full image 
Etsy1206 × 2622opens the full image 
Michelin Guide1206 × 2622opens the full image
The numbers
| # | Stat | Computed from |
|---|---|---|
| 01 | 22% (176/809)s1 | premium_badge_label_prevalence: 176/809 |
| 02 | 20% (159/809)s2 | unlock_cta_prevalence: 159/809 |
| 03 | 12% (94/809)s3 | lock_icon_gating_prevalence: 94/809 |
Methodology
Universe: 809 tracked mobile apps with 44,873 tagged screenshots. Method: app-count prevalence (COUNT DISTINCT company) over tightened LLM synonym tag patterns, July 2026. Caveat: tag-based prevalence is a lower bound; raw single-word patterns (%lock%, %usage%, %blur%) were rejected for security/media/data-usage false positives.
Sources
- [1]
Lazyweb Research analysis of 809 apps (tracked mobile app corpus with screenshots), July 2026
Prevalence deduped by COUNT(DISTINCT company_name) over 44,873 tagged screenshots; tag patterns are LLM synonym phrases (tightened after spot-checking) so every stat is a lower bound.
Source: Lazyweb Research — proprietary analysis of real, in-market app screens. Cite as Lazyweb Research, 2026-07-07.
Explore the evidence
- Full 45-frame August 2026 capture
- Three captured screens · August 2026