How do cross-subsidized-funnel apps handle in-product upsell?
- By Ali Abouelatta
- n = 124
- Published
- Updated
- 2 min read
- monetization · upsell · saas · mobile · paywall
Short answer
They upsell in-product far less: only 15% of cross-subsidized-funnel apps (18/124) run an in-product upgrade banner, versus 56% of subscription apps and 43% of advertising apps.source[2] Other gating mechanics for this model fall below the reporting threshold entirely — unlock CTA (8 apps), lock gating (3), usage gating (1).source[2] If your model cross-subsidizes, heavy in-product gating would put you outside the category norm.
Only 15% of cross-subsidized-funnel apps (18/124) run an in-product upgrade banner — Lazyweb Research, July 2026.
Bar chart · Share
Share — Finding: the lightest-touch cohort
One block is about 2%
- Subscription
- 56%
- Advertising
- 43%
- Cross-subsidized Funnel
- 15%
Finding: the lightest-touch cohort
Upgrade-banner prevalence by model, with cross-subsidized funnel as the clear outlier:source[2]
| Business model | Apps | Upgrade banner | Share |
|---|---|---|---|
| Subscription | 417 | 232 | 56% |
| Advertising | 176 | 75 | 43% |
| Cross-subsidized Funnel | 124 | 18 | 15% |
For cross-subsidized-funnel apps, the other gating mechanics are too rare to express as percentages — unlock CTA is 8 apps, lock gating 3, usage gating 1.source[2] The upgrade banner is essentially the only in-product upsell pattern this cohort uses at any scale.
How to apply
If your product cross-subsidizes (the core is free/loss-led and revenue comes from an adjacent source), the market norm is minimal in-product gating — a single occasional upgrade banner at most. Aggressive feature locks or usage meters would be unusual for the model and risk undermining the free experience that drives the funnel. Keep the paid path present but quiet.
Caveats
Only the upgrade-banner cell (18/124) clears the N>=8 threshold for this model; unlock CTA (8), lock gating (3) and usage gating (1) are reported as raw counts and must not be turned into percentages.source[2] Figures are company-deduped lower bounds from LLM tags.source[2]
Real in-market screens
Screens from real, in-market apps, tracked by Lazyweb Research.
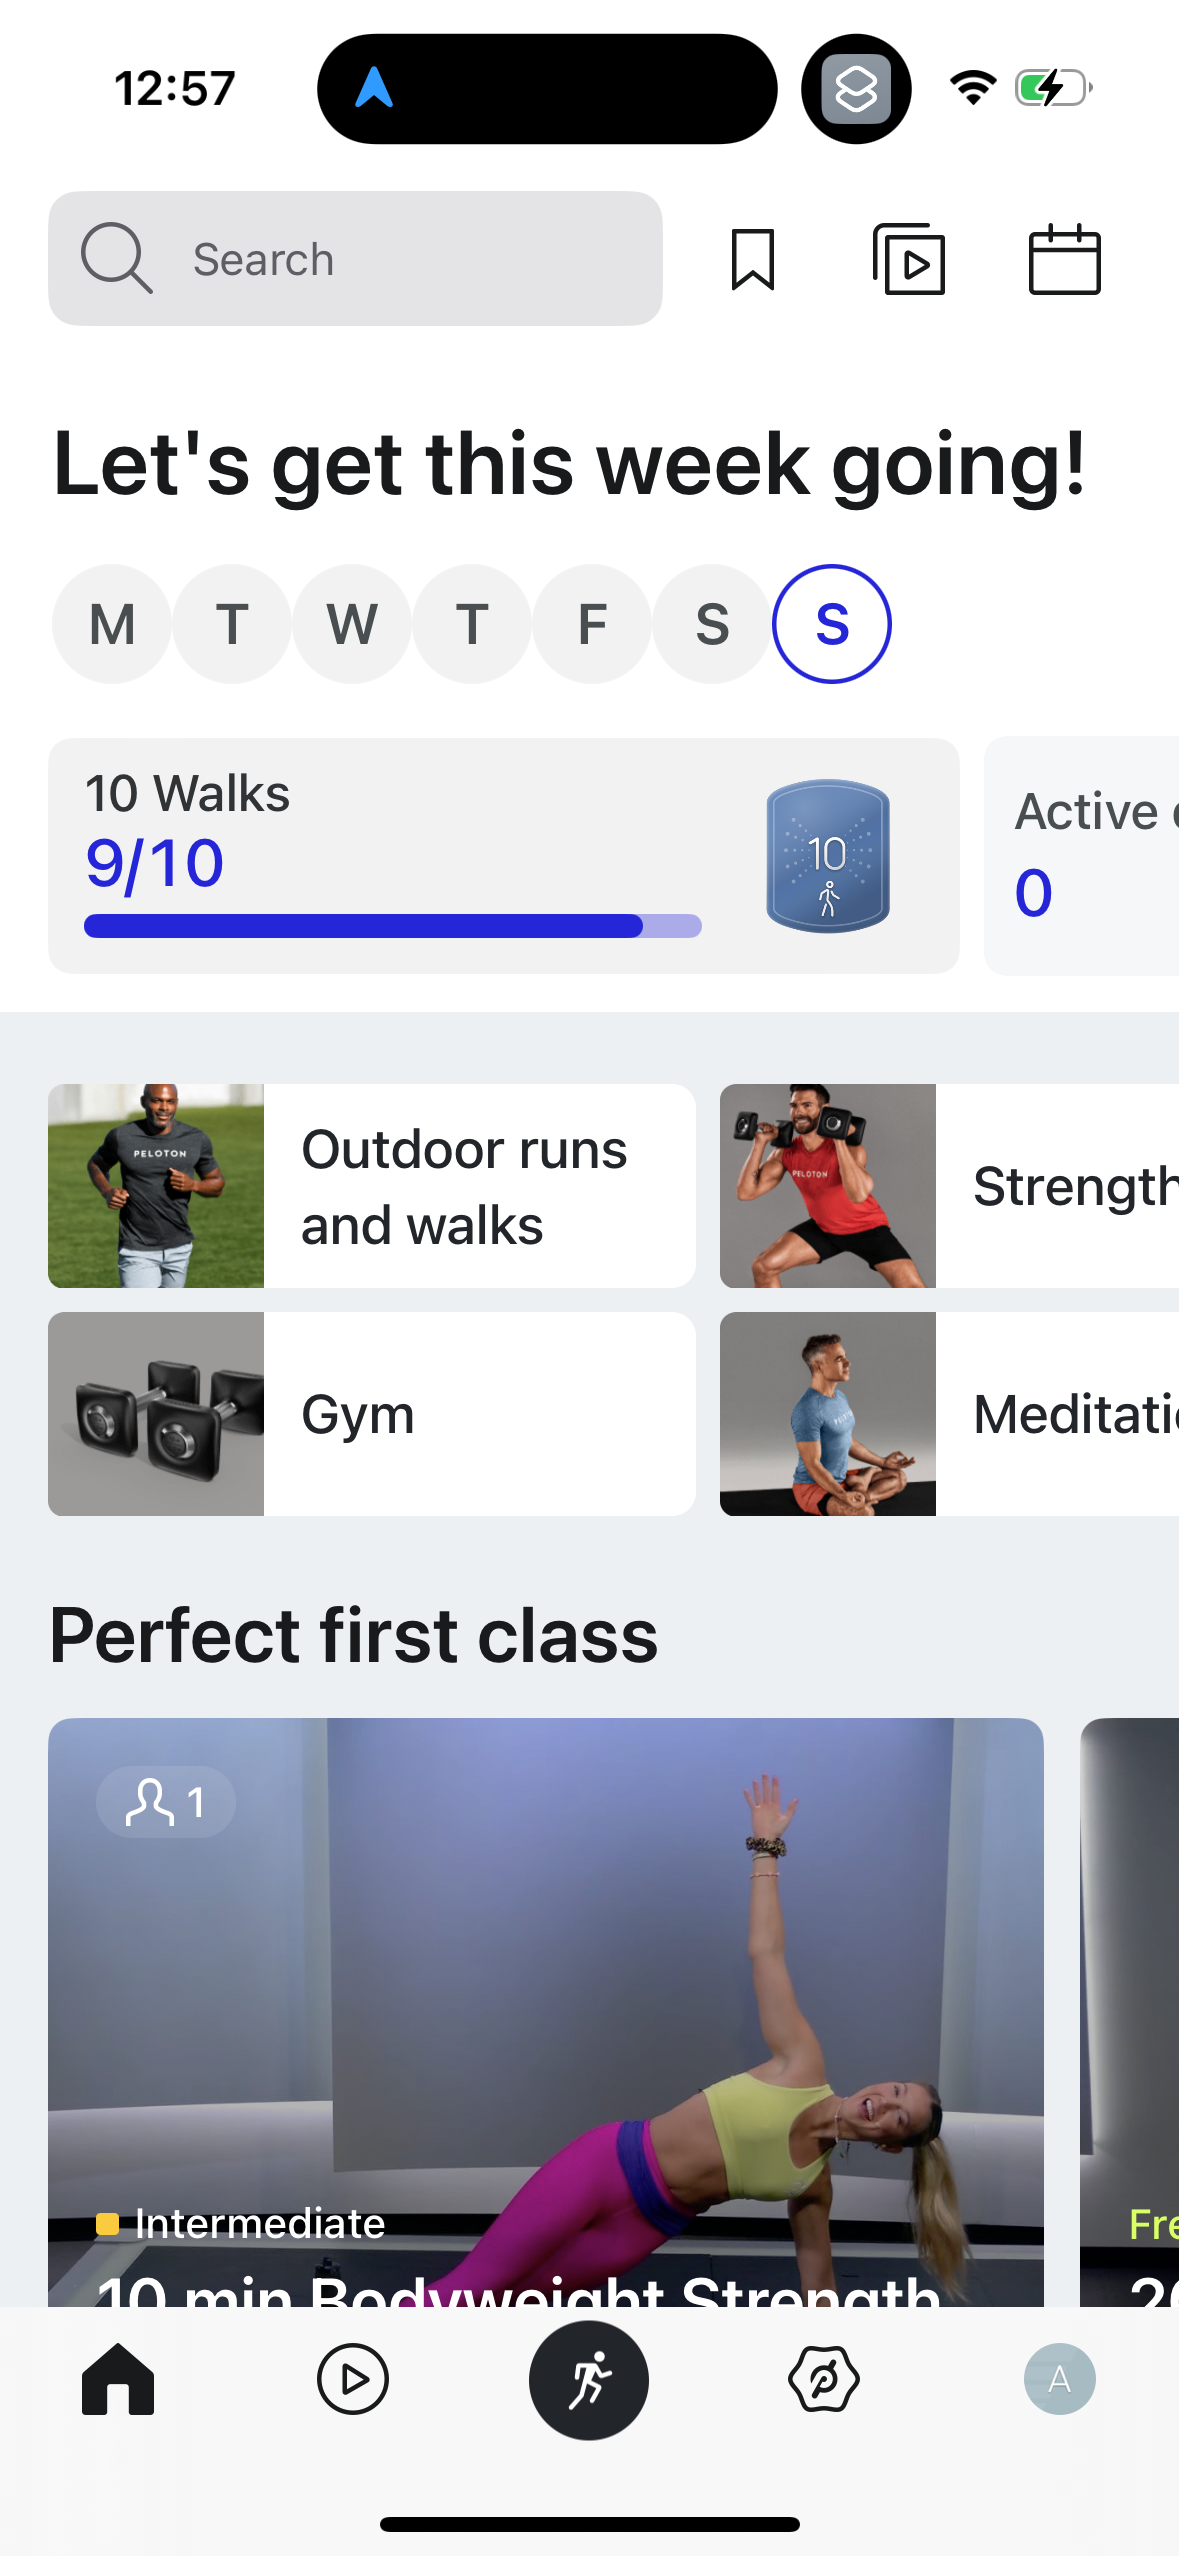
Peloton1179 × 2556opens the full image 
Omio1206 × 2622opens the full image 
Airchat1179 × 2556opens the full image 
Plantin1206 × 2622opens the full image
The numbers
| # | Stat | Computed from |
|---|---|---|
| 01 | 15% (18/124)s1 | bm_cross_subsidized_upgrade_banner: 18/124 |
| 02 | 56% (232/417)s2 | bm_subscription_upgrade_banner: 232/417 |
| 03 | 43% (75/176)s3 | bm_advertising_upgrade_banner: 75/176 |
| 04 | unlock=8, lock=3, usage=1 (counts)s4 | smallSampleWarnings: cross-subsidized funnel below-threshold counts |
Methodology
Universe: 809 tracked mobile apps with business-model attributes (Cross-subsidized Funnel=124, Subscription=417, Advertising=176). Method: mechanic x business-model cross-tab deduped by company, July 2026. Caveat: for this model only the upgrade-banner cell clears N=8; others are counts.
Sources
- [2]
Lazyweb Research analysis of 809 apps (tracked mobile app corpus, business-model cross-tab), July 2026
Business-model attributes populated on ~800 tracked apps (Subscription=417, Advertising=176, Cross-subsidized Funnel=124 in this cross-tab); each mechanic deduped by distinct company.
Source: Lazyweb Research — proprietary analysis of real, in-market app screens. Cite as Lazyweb Research, 2026-07-07.