Where do retention save-offers and downgrade upsells appear?
- By Ali Abouelatta
- n = 23,407
- Published
- Updated
- 2 min read
- cancellation · retention · upsell · monetization · mobile
Short answer
The cancellation flow is the concentrated surface: 332 of 23,407 canonical mobile screens are categorized as cancel-subscription screens, where save-offers and downgrade upsells appear.source[3] That's nearly 5x the 70 checkout-upsell screens.source[3] If you want to intercept churn with an upsell or discount, the cancel flow is where the corpus says that motion lives.
332 of 23,407 canonical mobile screens are cancel-subscription screens — the home of retention save-offers — Lazyweb Research, July 2026.
Finding
Canonical-screen counts for the two monetization-adjacent surfaces:source[3]
| Surface | Canonical screens | Relative size |
|---|---|---|
| Cancel subscription | 332 | ~5x |
| Checkout upsell | 70 | 1x |
Cancellation is a far larger surface than in-app checkout upsell, reflecting how much effort apps put into the last-chance moment — plan downgrades, pause options, and discount save-offers cluster here.
How to apply
Design the cancel flow as an upsell/retention surface, not just an exit: present a save-offer (discount, pause, downgrade to a cheaper tier) before confirming cancellation. Because it's a well-populated, expected surface (332 screens), users tolerate an offer here more than they would an interruptive banner elsewhere. Keep the offer honest and skippable to avoid dark-pattern backlash.
Caveats
Counts are absolute canonical-screen categorizations, not a share of screens (is_paywall NULL on 21,824/23,407) and not conversion.source[3] The presence of a cancel screen does not by itself confirm a save-offer is shown — it's where such offers are captured when present.
Real in-market screens
Screens from real, in-market apps, tracked by Lazyweb Research.

Goat1206 × 2622opens the full image 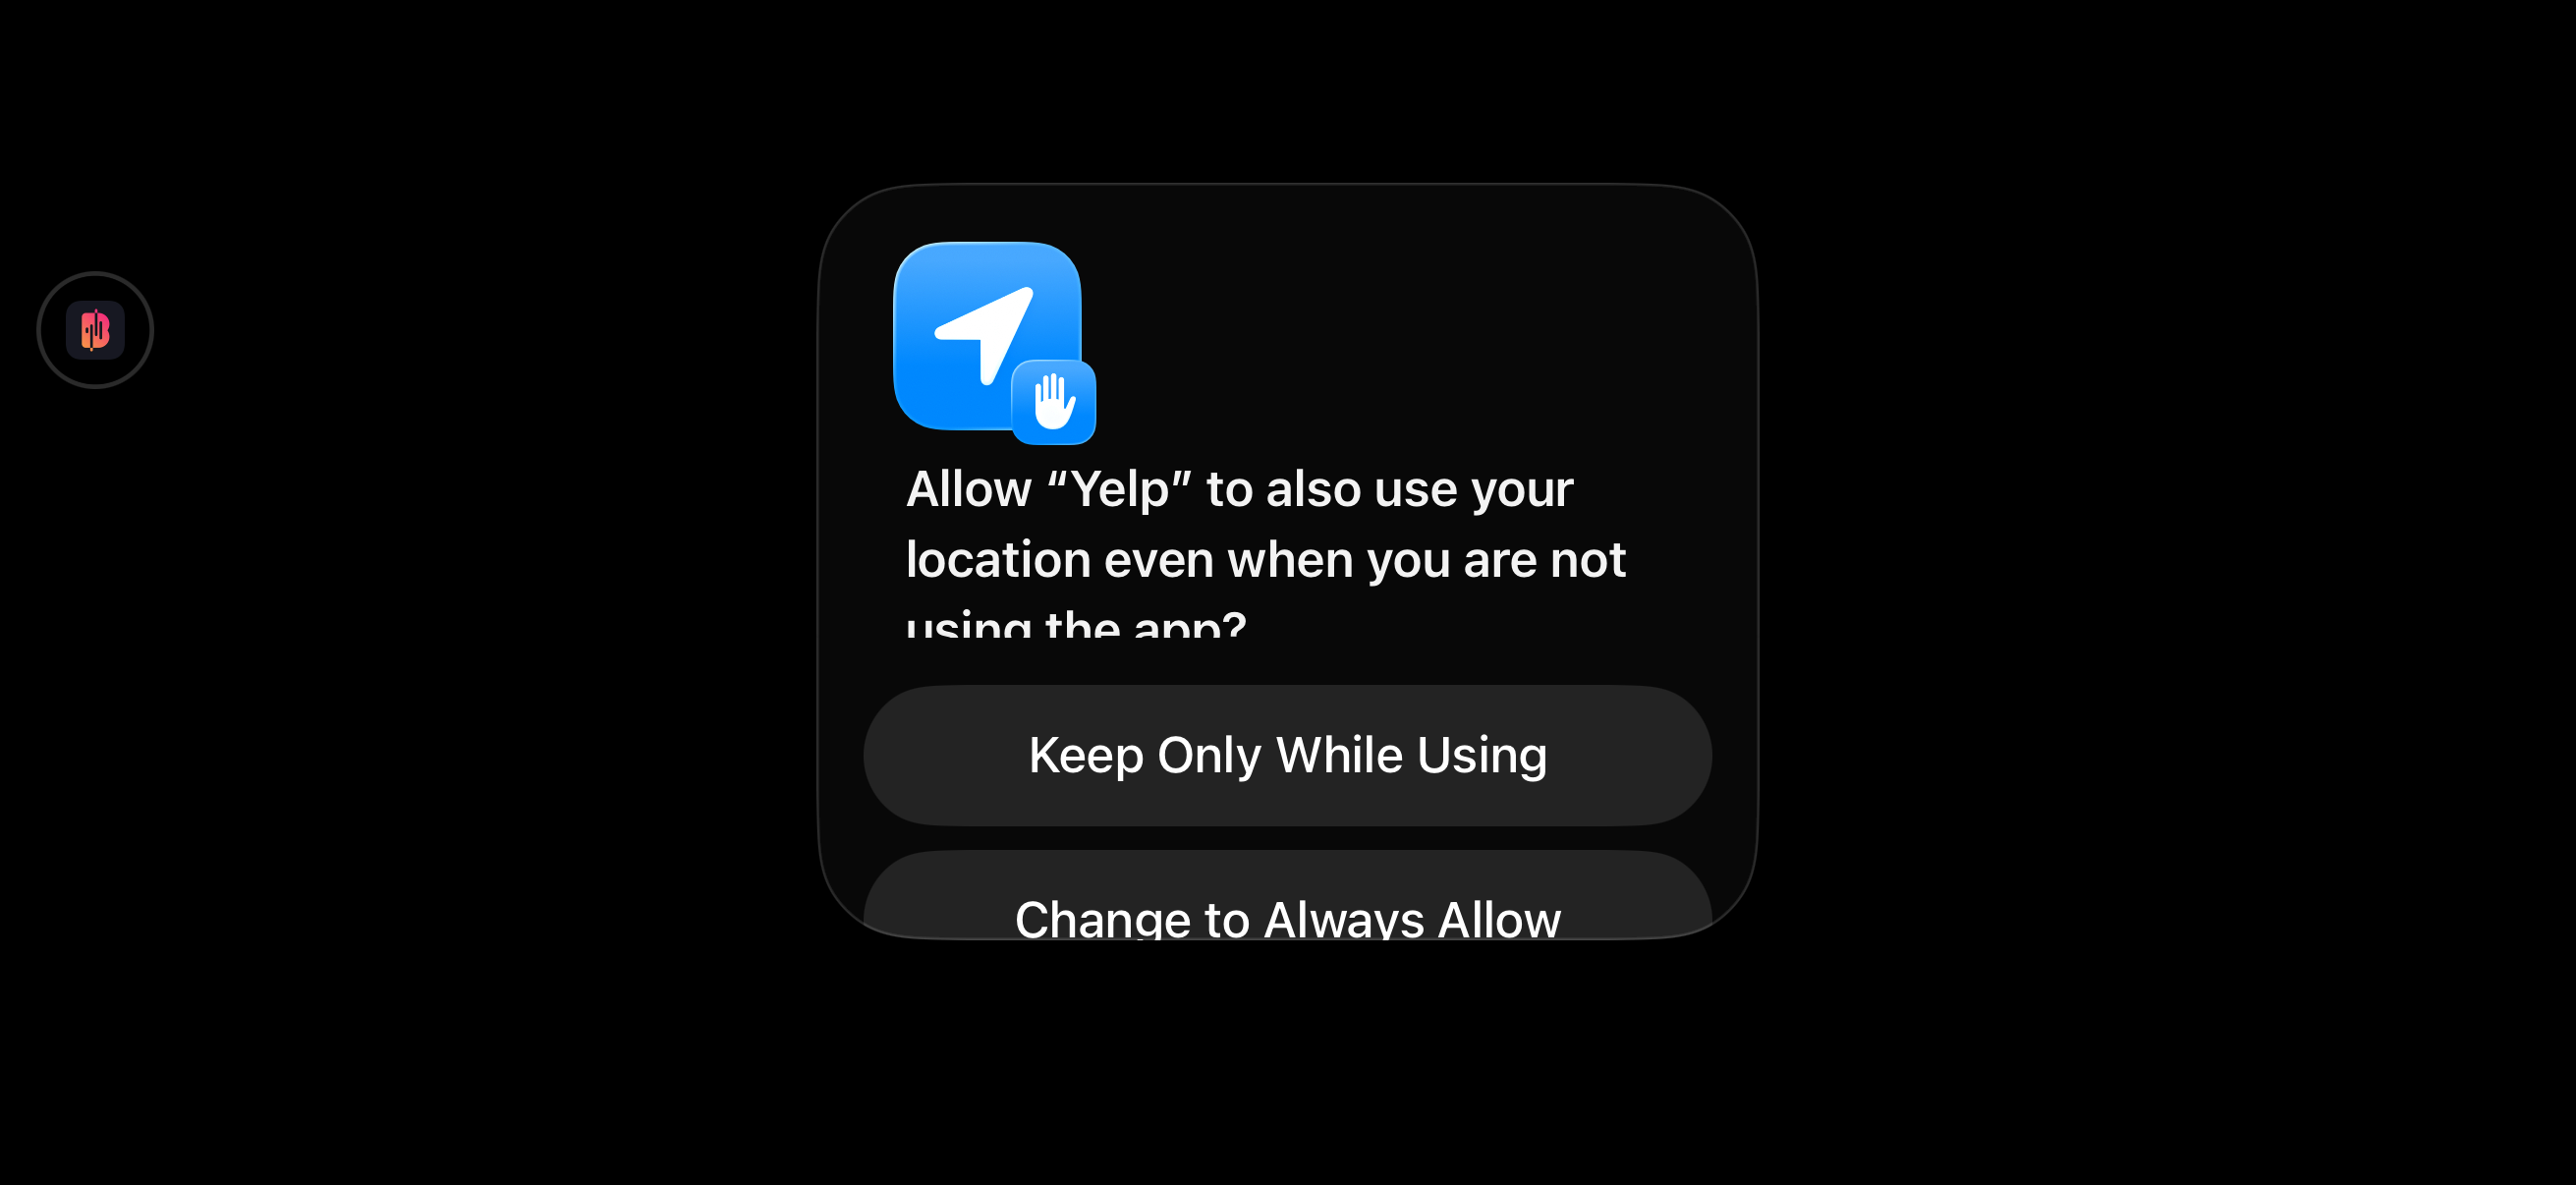
Yousician2622 × 1206opens the full image 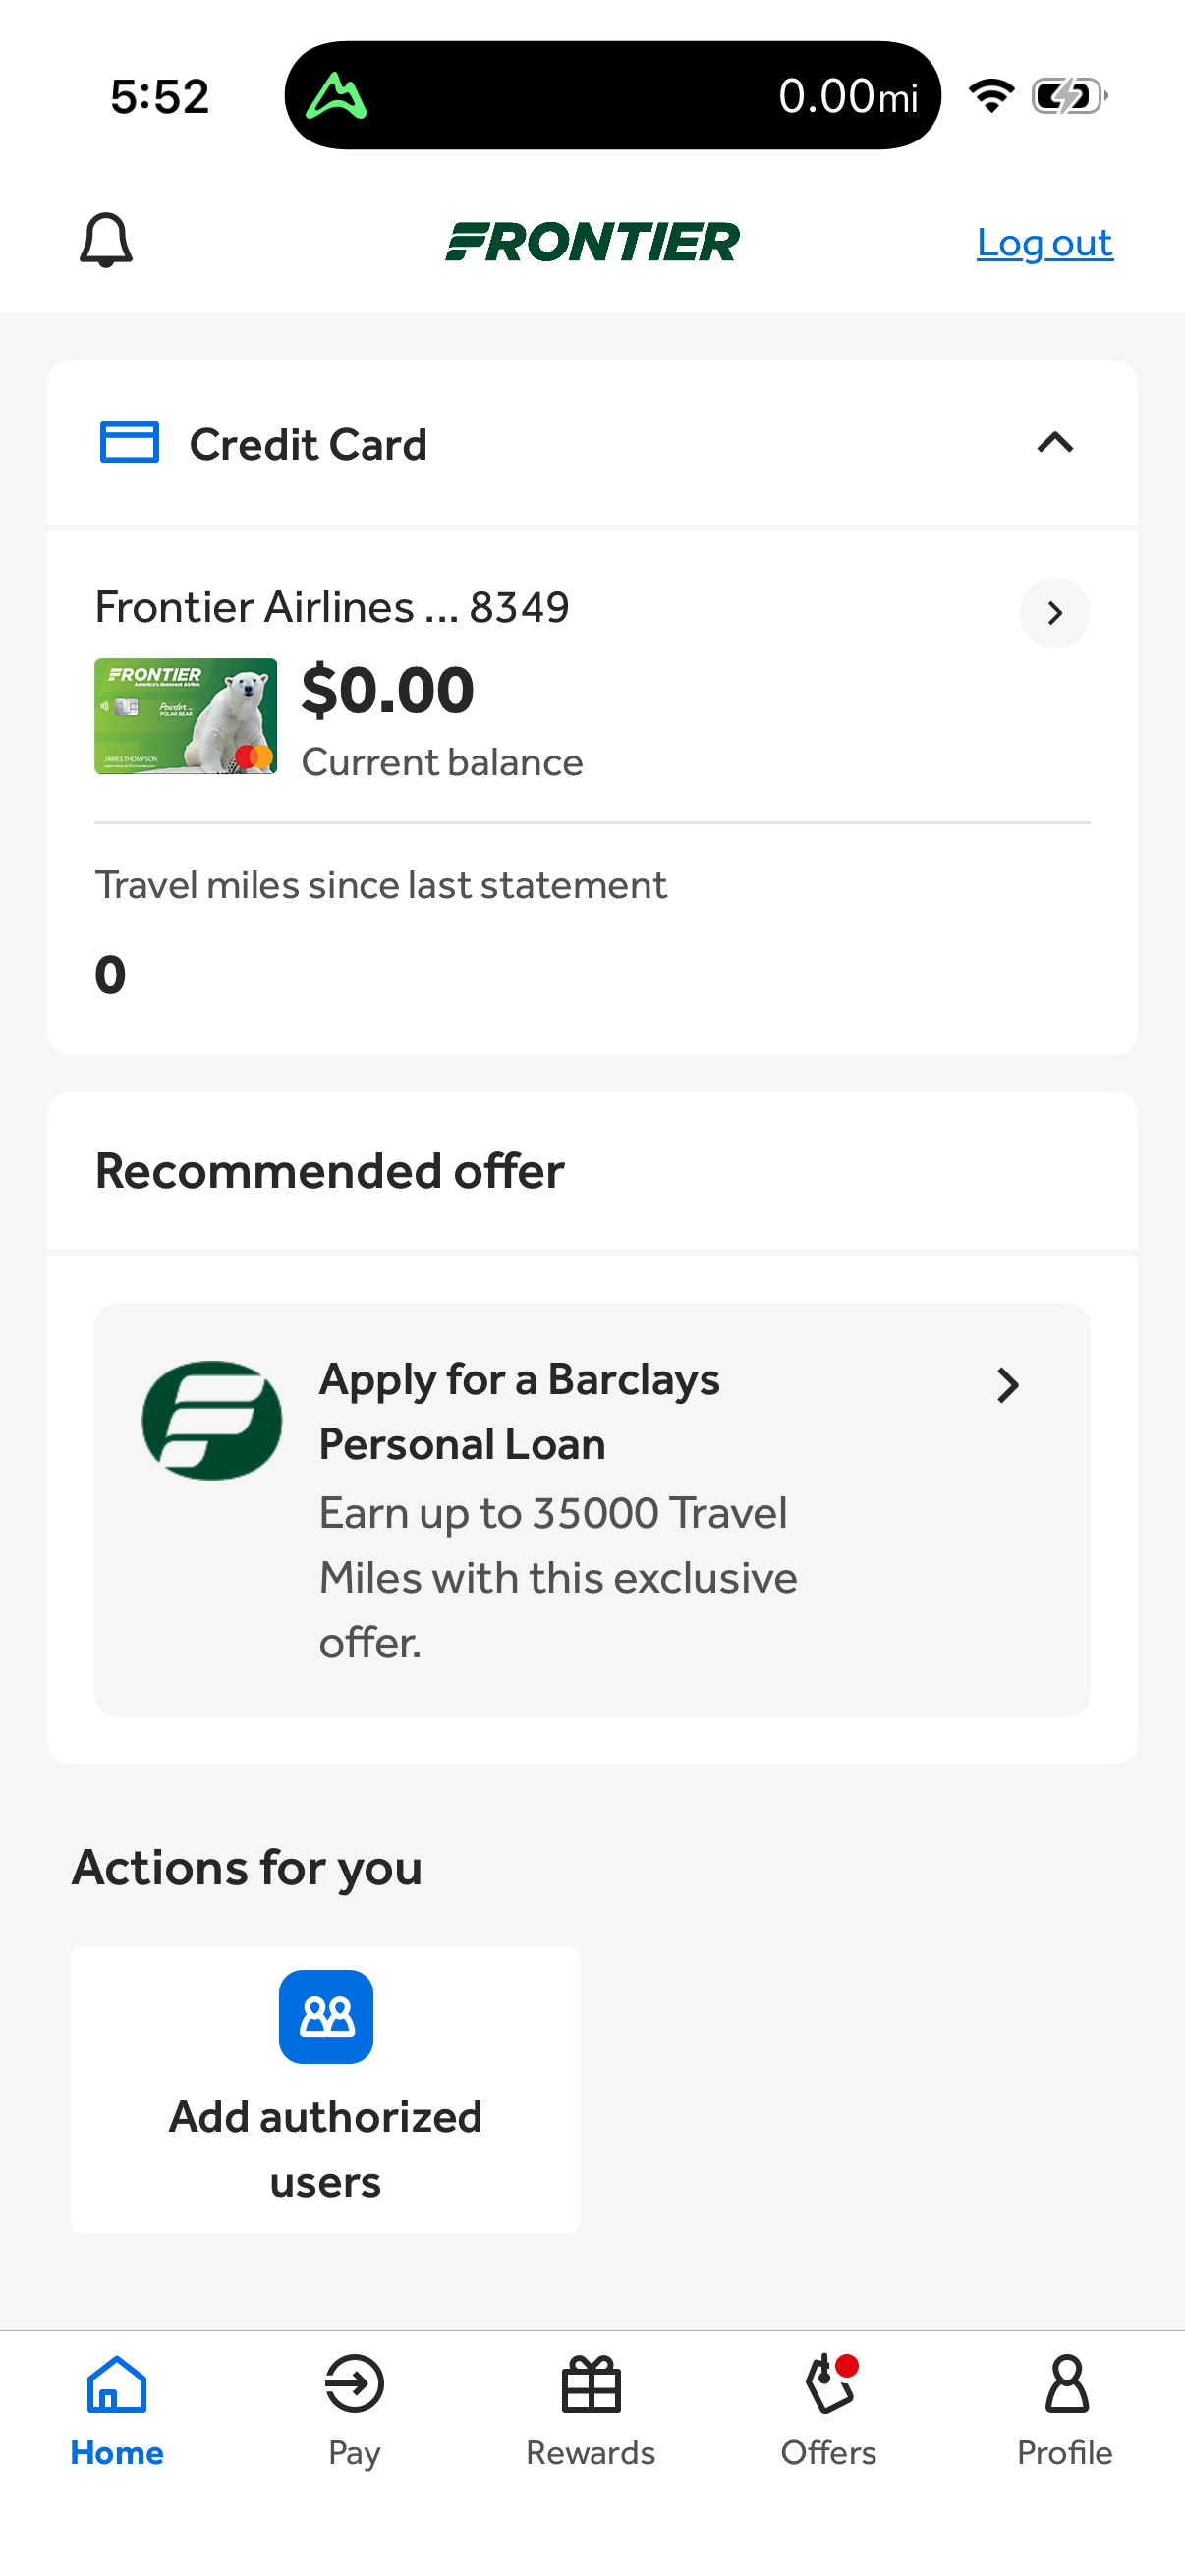
Barclays1206 × 2622opens the full image 
Sora1206 × 2622opens the full image
The numbers
| # | Stat | Computed from |
|---|---|---|
| 01 | 332 of 23,407s1 | cancel_subscription_screens: 332 canonical screens |
| 02 | 70 of 23,407s2 | checkout_upsell_screens: 70 canonical screens |
Methodology
Universe: 23,407 canonical mobile screens. Method: absolute count by screen category, July 2026. Caveat: absolute counts only; is_paywall NULL on 21,824/23,407 rows.
Sources
- [3]
Lazyweb Research analysis of 23,407 canonical mobile screens (tracked app corpus), July 2026
Canonical-screen category counts; is_paywall is NULL on 21,824/23,407 rows so gating is reported as app-count prevalence or absolute screen counts, never as a share of all screens.
Source: Lazyweb Research — proprietary analysis of real, in-market app screens. Cite as Lazyweb Research, 2026-07-07.