How common are checkout-upsell (order-bump) screens in mobile apps?
- By Ali Abouelatta
- n = 23,407
- Published
- Updated
- 2 min read
- checkout · upsell · cancellation · monetization · mobile · retention
Short answer
Checkout-upsell screens are rare in the mobile corpus: only 70 canonical screens across 23,407 are categorized as 'checkout upsell'.source[3] By comparison, cancel-subscription screens — where retention save-offers live — number 332.source[3] Order-bump-style upsells are a small, specialized surface on mobile; the bigger in-product upsell action happens on banners, feature gates, and settings.
Just 70 of 23,407 canonical mobile screens are checkout-upsell screens — Lazyweb Research, July 2026.
Finding
Absolute canonical-screen counts (not shares of all screens):source[3]
| Screen category | Canonical screens |
|---|---|
| Checkout upsell | 70 |
| Cancel subscription | 332 |
Cancel-subscription screens outnumber checkout-upsell screens roughly 5-to-1, which fits mobile's reality: most purchase flows run through the app-store sheet, leaving little room for an in-app order bump, while cancellation flows are where apps concentrate save-offers and downgrade upsells.
How to apply
On mobile, don't over-invest in a classic checkout order bump — the surface barely exists in the corpus (70 screens). Put upsell energy where it actually lives: in-product banners, feature gates, settings entries, and the cancellation flow (332 screens), which is a proven place to present a save-offer or plan switch before the user leaves.
Caveats
These are absolute canonical-screen counts, deliberately not expressed as a share of all screens because is_paywall is NULL on 21,824/23,407 rows.source[3] Counts reflect how the corpus is categorized, not conversion or revenue.
Real in-market screens
Screens from real, in-market apps, tracked by Lazyweb Research.
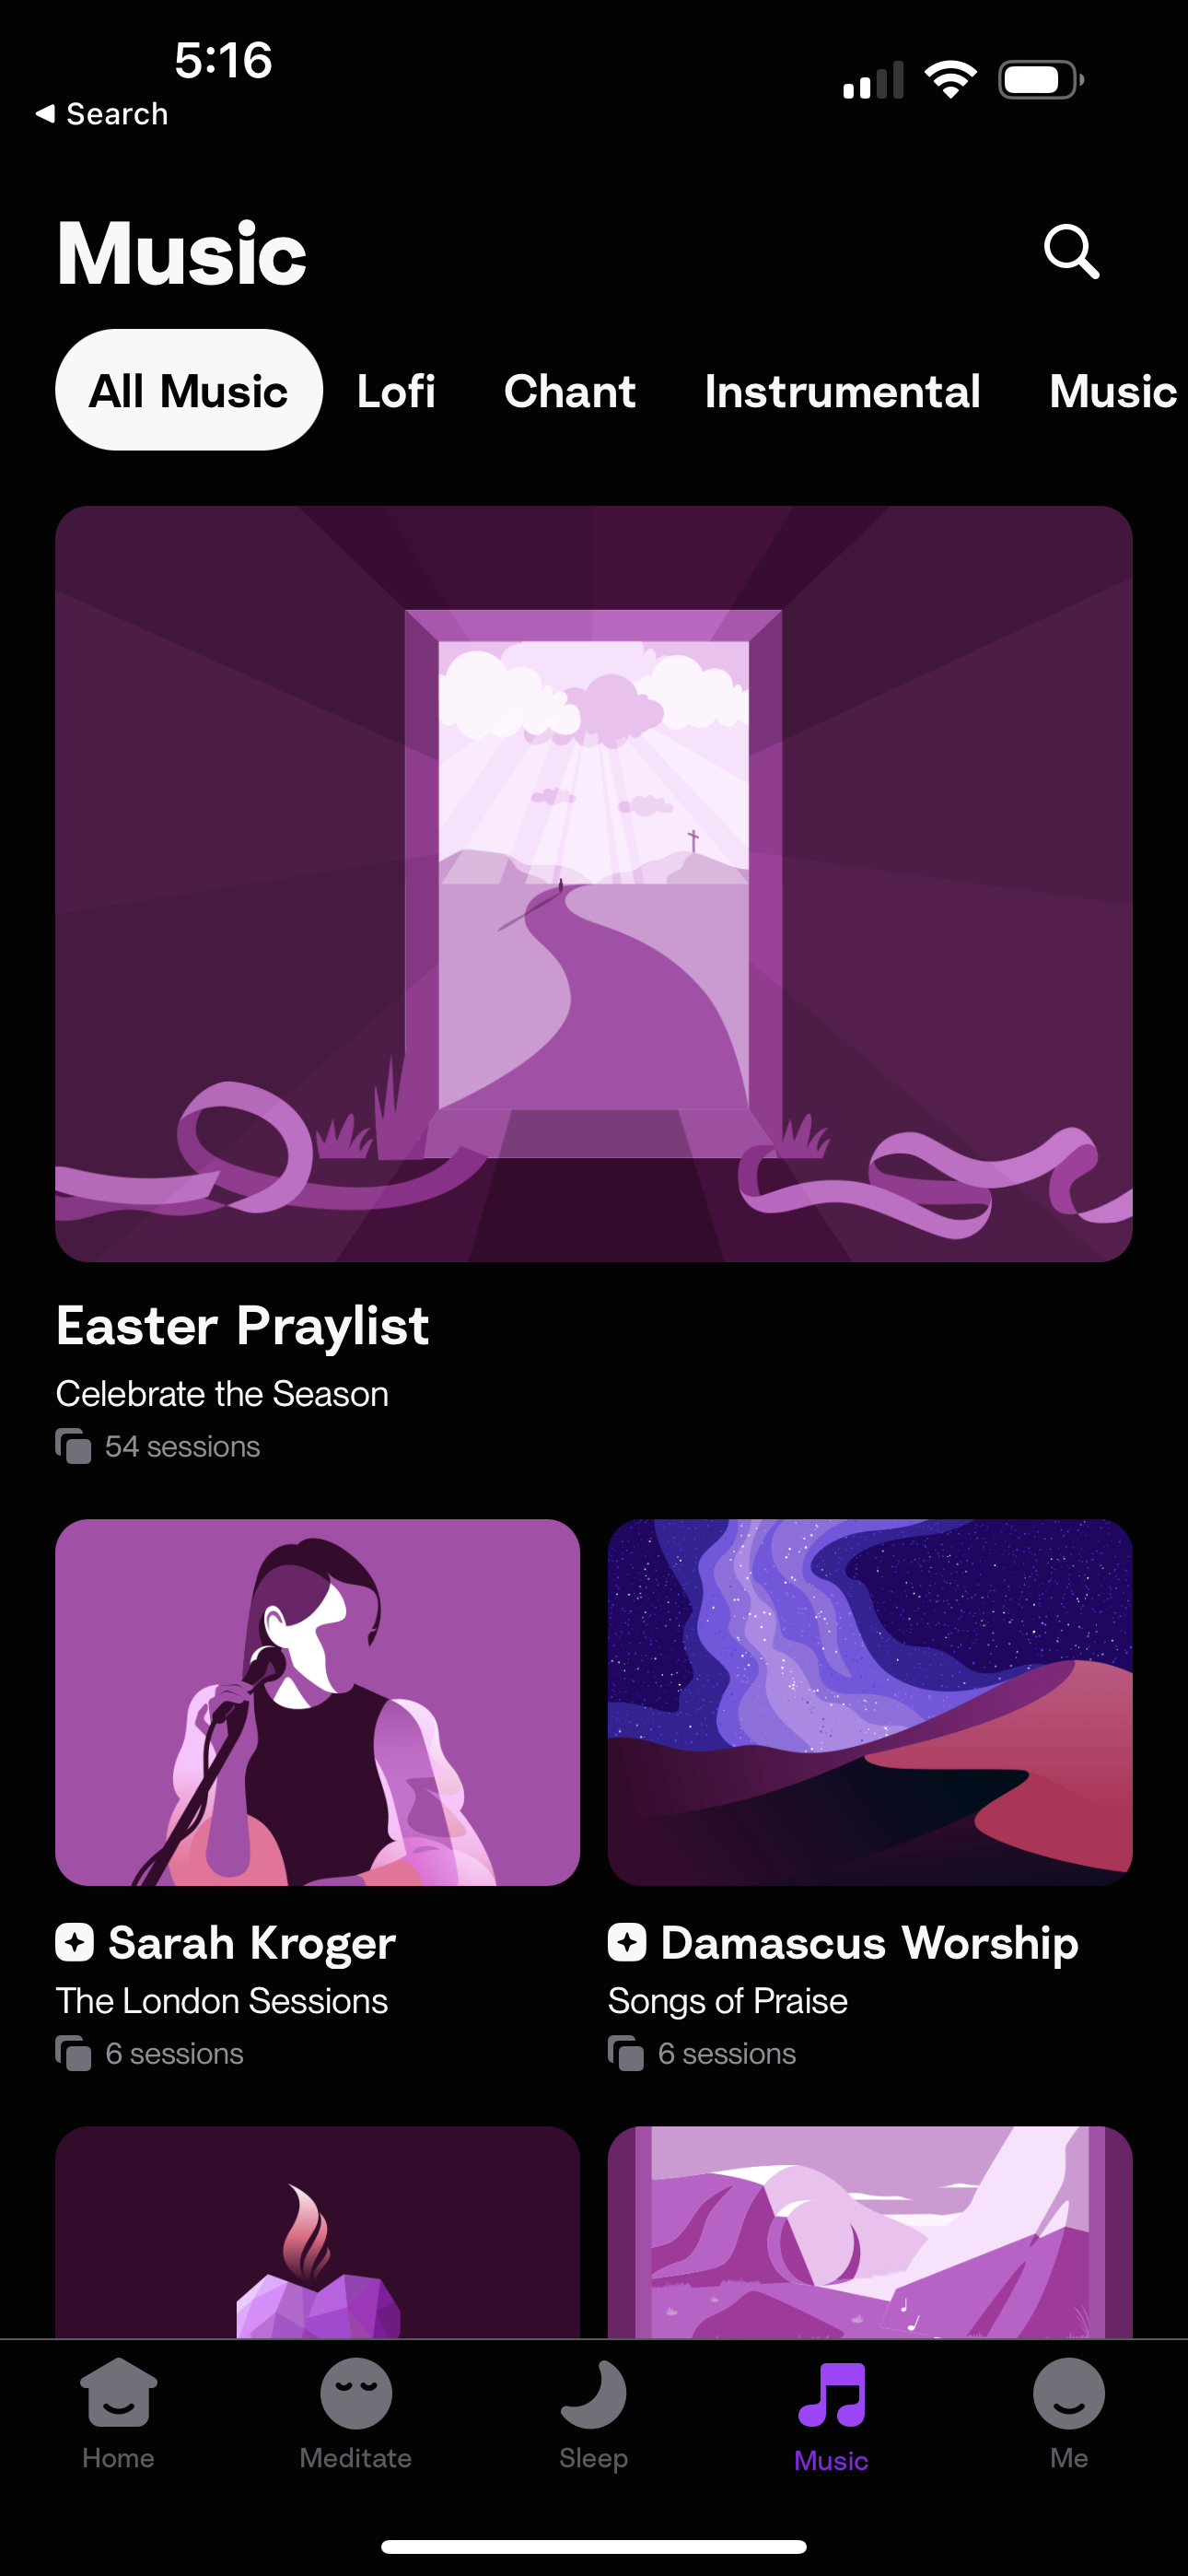
Hallow1290 × 2796opens the full image 
Squad2622 × 1206opens the full image 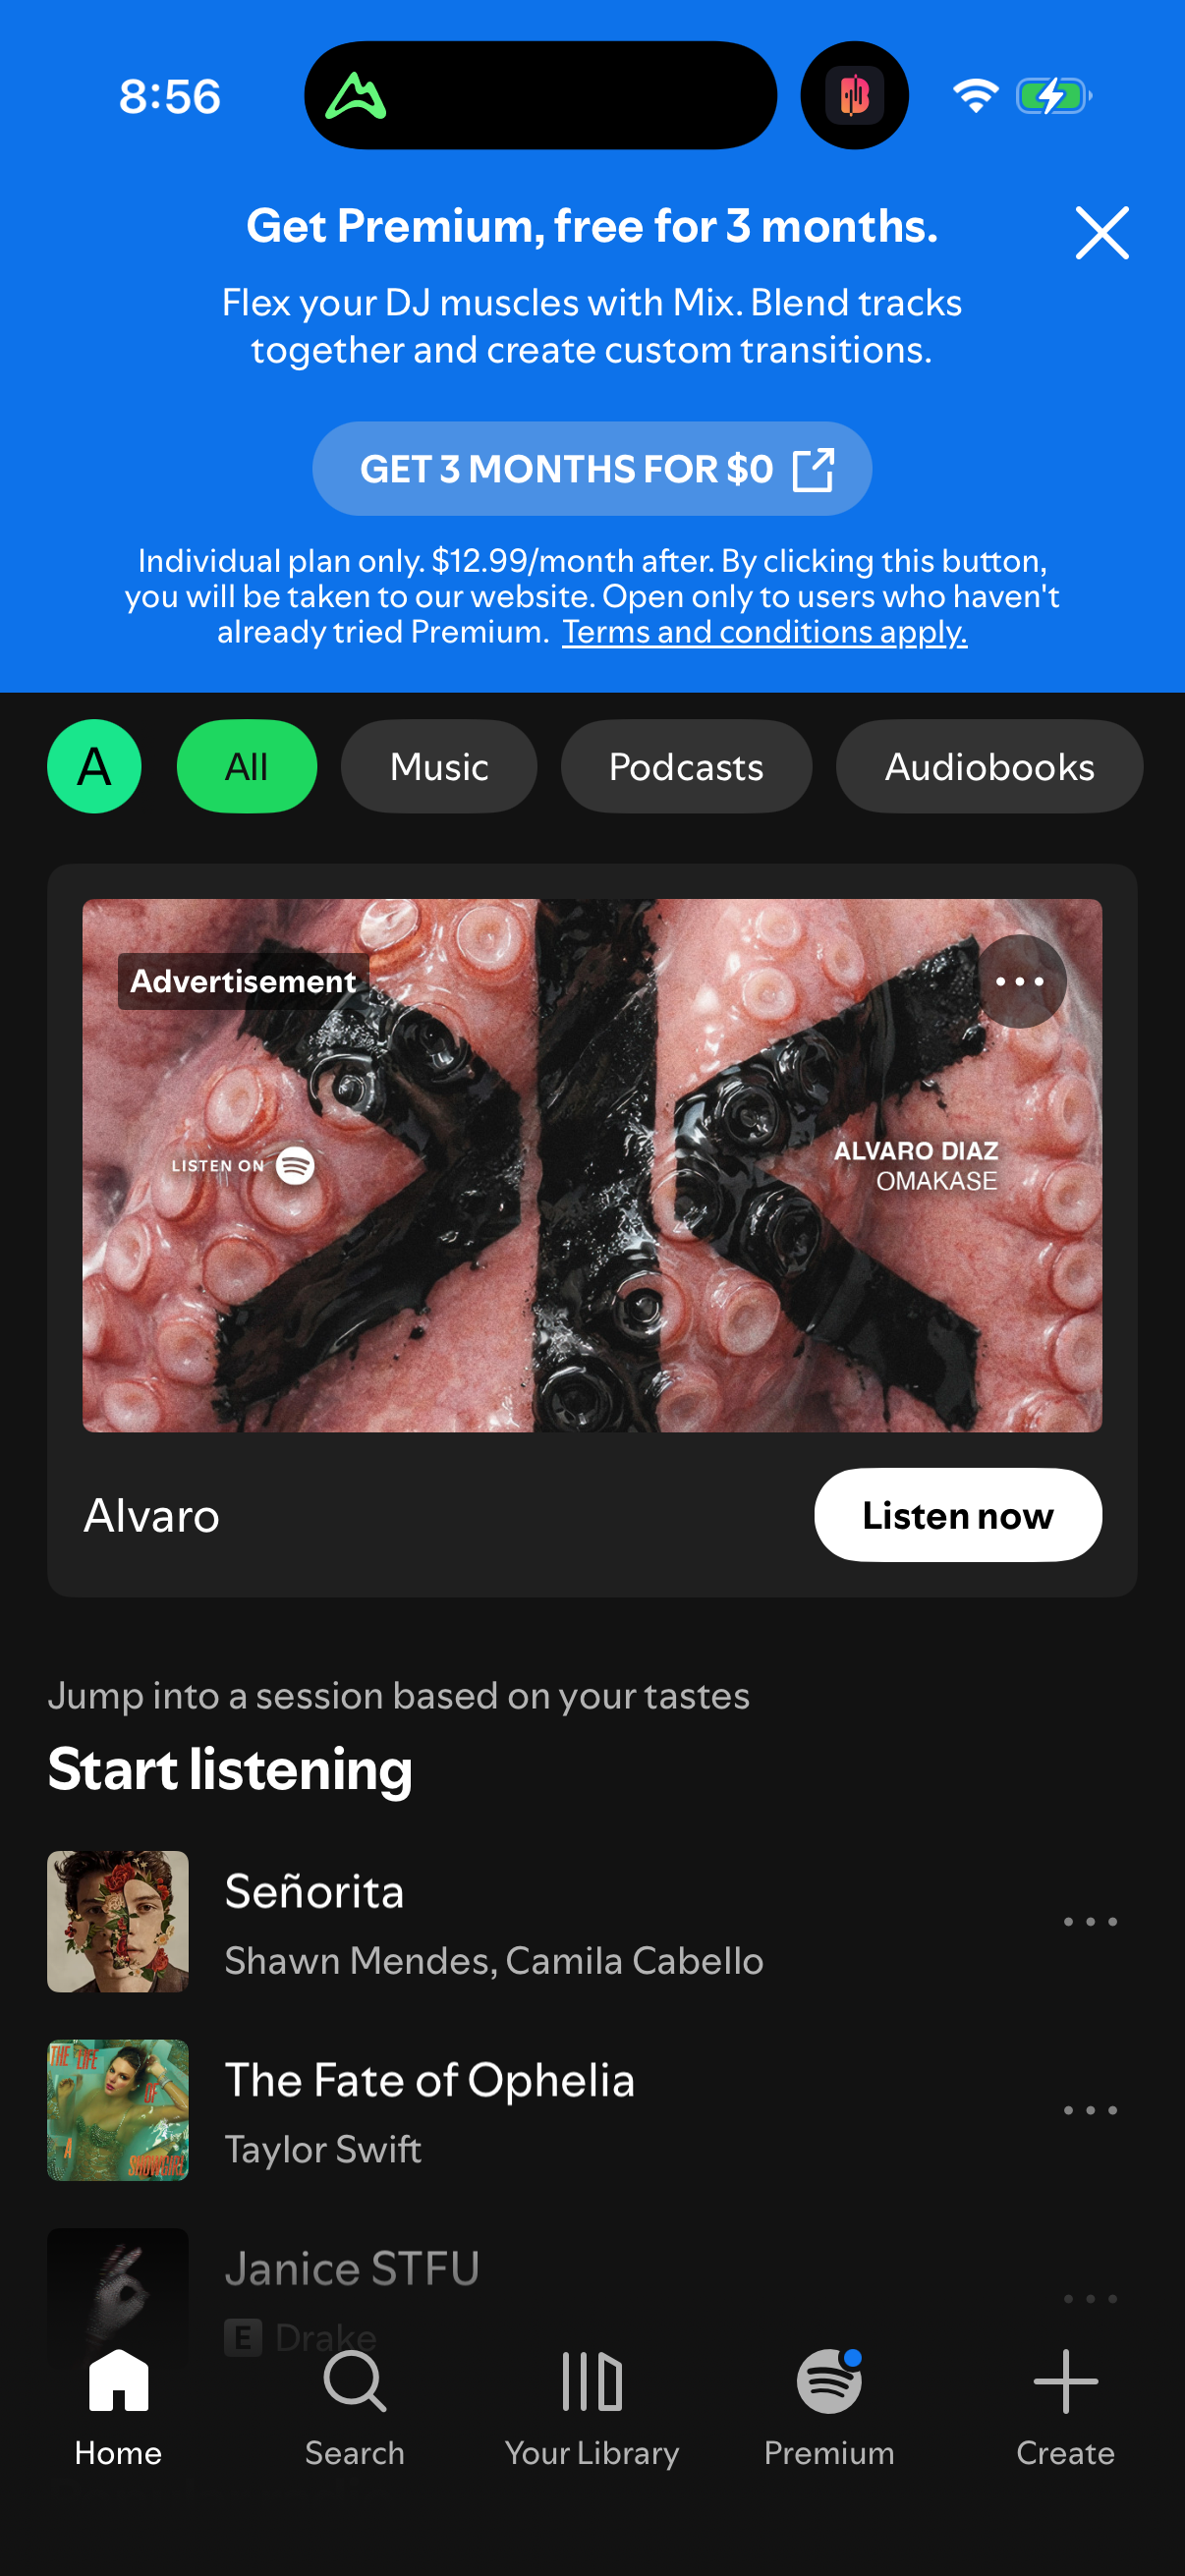
Spotify1206 × 2622opens the full image 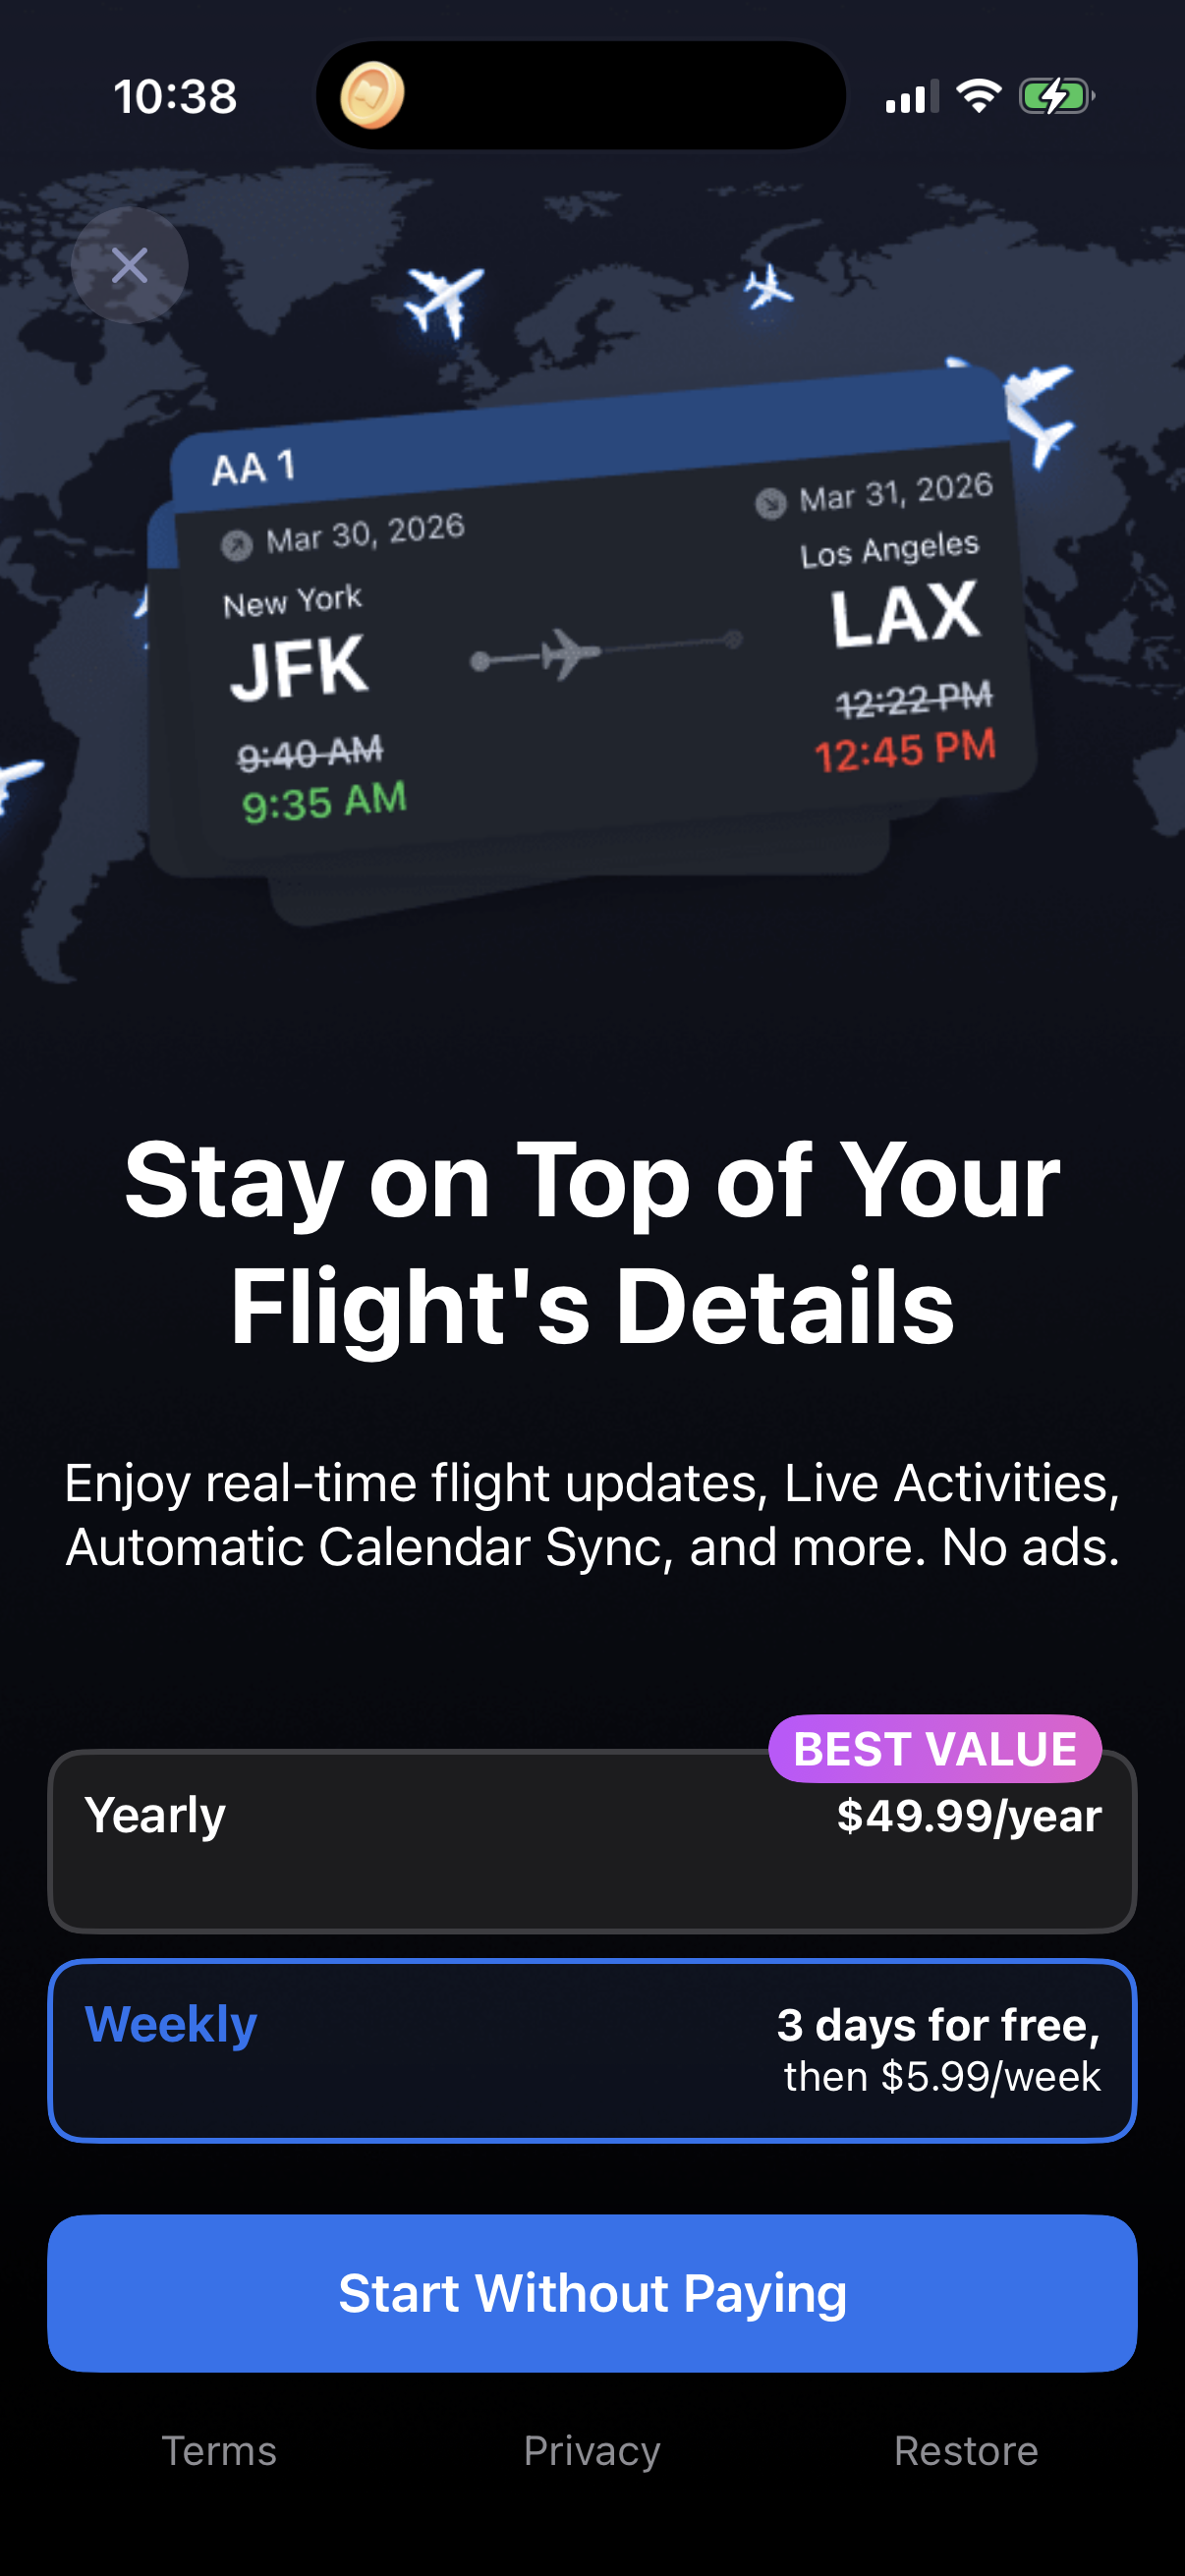
Flight Tracker1206 × 2622opens the full image
The numbers
| # | Stat | Computed from |
|---|---|---|
| 01 | 70 of 23,407s1 | checkout_upsell_screens: 70 canonical screens |
| 02 | 332 of 23,407s2 | cancel_subscription_screens: 332 canonical screens |
| 03 | 21,824/23,407 NULLs3 | smallSampleWarnings: sc_canonical.is_paywall NULL on 21,824/23,407 |
Methodology
Universe: 23,407 canonical mobile screens across the tracked app corpus. Method: absolute count by screen category, July 2026. Caveat: is_paywall is NULL on 21,824/23,407 rows, so gating is reported as absolute counts, never as a share of all screens.
Sources
- [3]
Lazyweb Research analysis of 23,407 canonical mobile screens (tracked app corpus), July 2026
Canonical-screen category counts; is_paywall is NULL on 21,824/23,407 rows so gating is reported as app-count prevalence or absolute screen counts, never as a share of all screens.
Source: Lazyweb Research — proprietary analysis of real, in-market app screens. Cite as Lazyweb Research, 2026-07-07.