What Page Areas Are Finance Companies A/B Testing?
- By Ali Abouelatta
- n = 70
- Published
- Updated
- 2 min read
- experiments · landing-page · ux-patterns · web · saas
Short answer
Across 70 area-annotated experiments from finance companies tracked by Lazyweb Research (38 experiments, 11 companies), the hero leads (16 annotations), then value props (14) and offer (10) source[1]. Finance is the smallest category that still qualifies for a percentage cut (70 annotations), so treat the ordering as directional source[1]source[2].
Finance companies test HERO most (16 of 70 area annotations), then value props (14) and offer (10) — Lazyweb Research analysis of 11 finance apps, July 2026.
Bar chart · Annotations
Annotations — Finance top tested areas
One block is about 0.6 Annotations
- HERO
- 16
- VALUE PROPS
- 14
- OFFER
- 10
The finding: hero and value props over offer
Finance contributes 70 annotations across 38 experiments and 11 companies — right at the n>=70 threshold to qualify for a category cut source[1]source[2]. Its top areas are HERO (16), VALUE PROPS (14), and OFFER (10) source[1]. Compared with subscription-entertainment categories, finance leans more on the hero and value-prop story and less on discount framing — consistent with trust- and clarity-driven products source[1].
Finance top tested areas
Cells with n>=8 source[1]:
| Area | Annotations |
|---|---|
| HERO | 16 |
| VALUE PROPS | 14 |
| OFFER | 10 |
A representative hero move from the finance side of the corpus: replacing two navigational chooser cards with a live interactive currency-comparison widget (amount input, mid-market rate) above a provider table — turning a routing decision into a working tool source[3].
How to apply it
For a fintech or finance product, the peer pattern favors hero and value-prop testing over aggressive discounting source[1]. The observed hero move — swap a navigation choice for a pre-loaded working tool so visitors get the answer instantly — is a strong pattern for search-intent traffic source[3]. Given VALUE PROPS' lower high-impact share (15.6%) corpus-wide, expect these to be steady rather than dramatic movers source[4].
Caveats
At 70 annotations from 11 companies, finance is the thinnest qualifying category — treat area ordering as directional, not settled source[2]. Only n>=8 cells shown source[1]. The hero example is a single observed diff with inferred rationale source[3].
Real in-market screens
Screens from real, in-market apps, tracked by Lazyweb Research.

Freenote1206 × 2622opens the full image 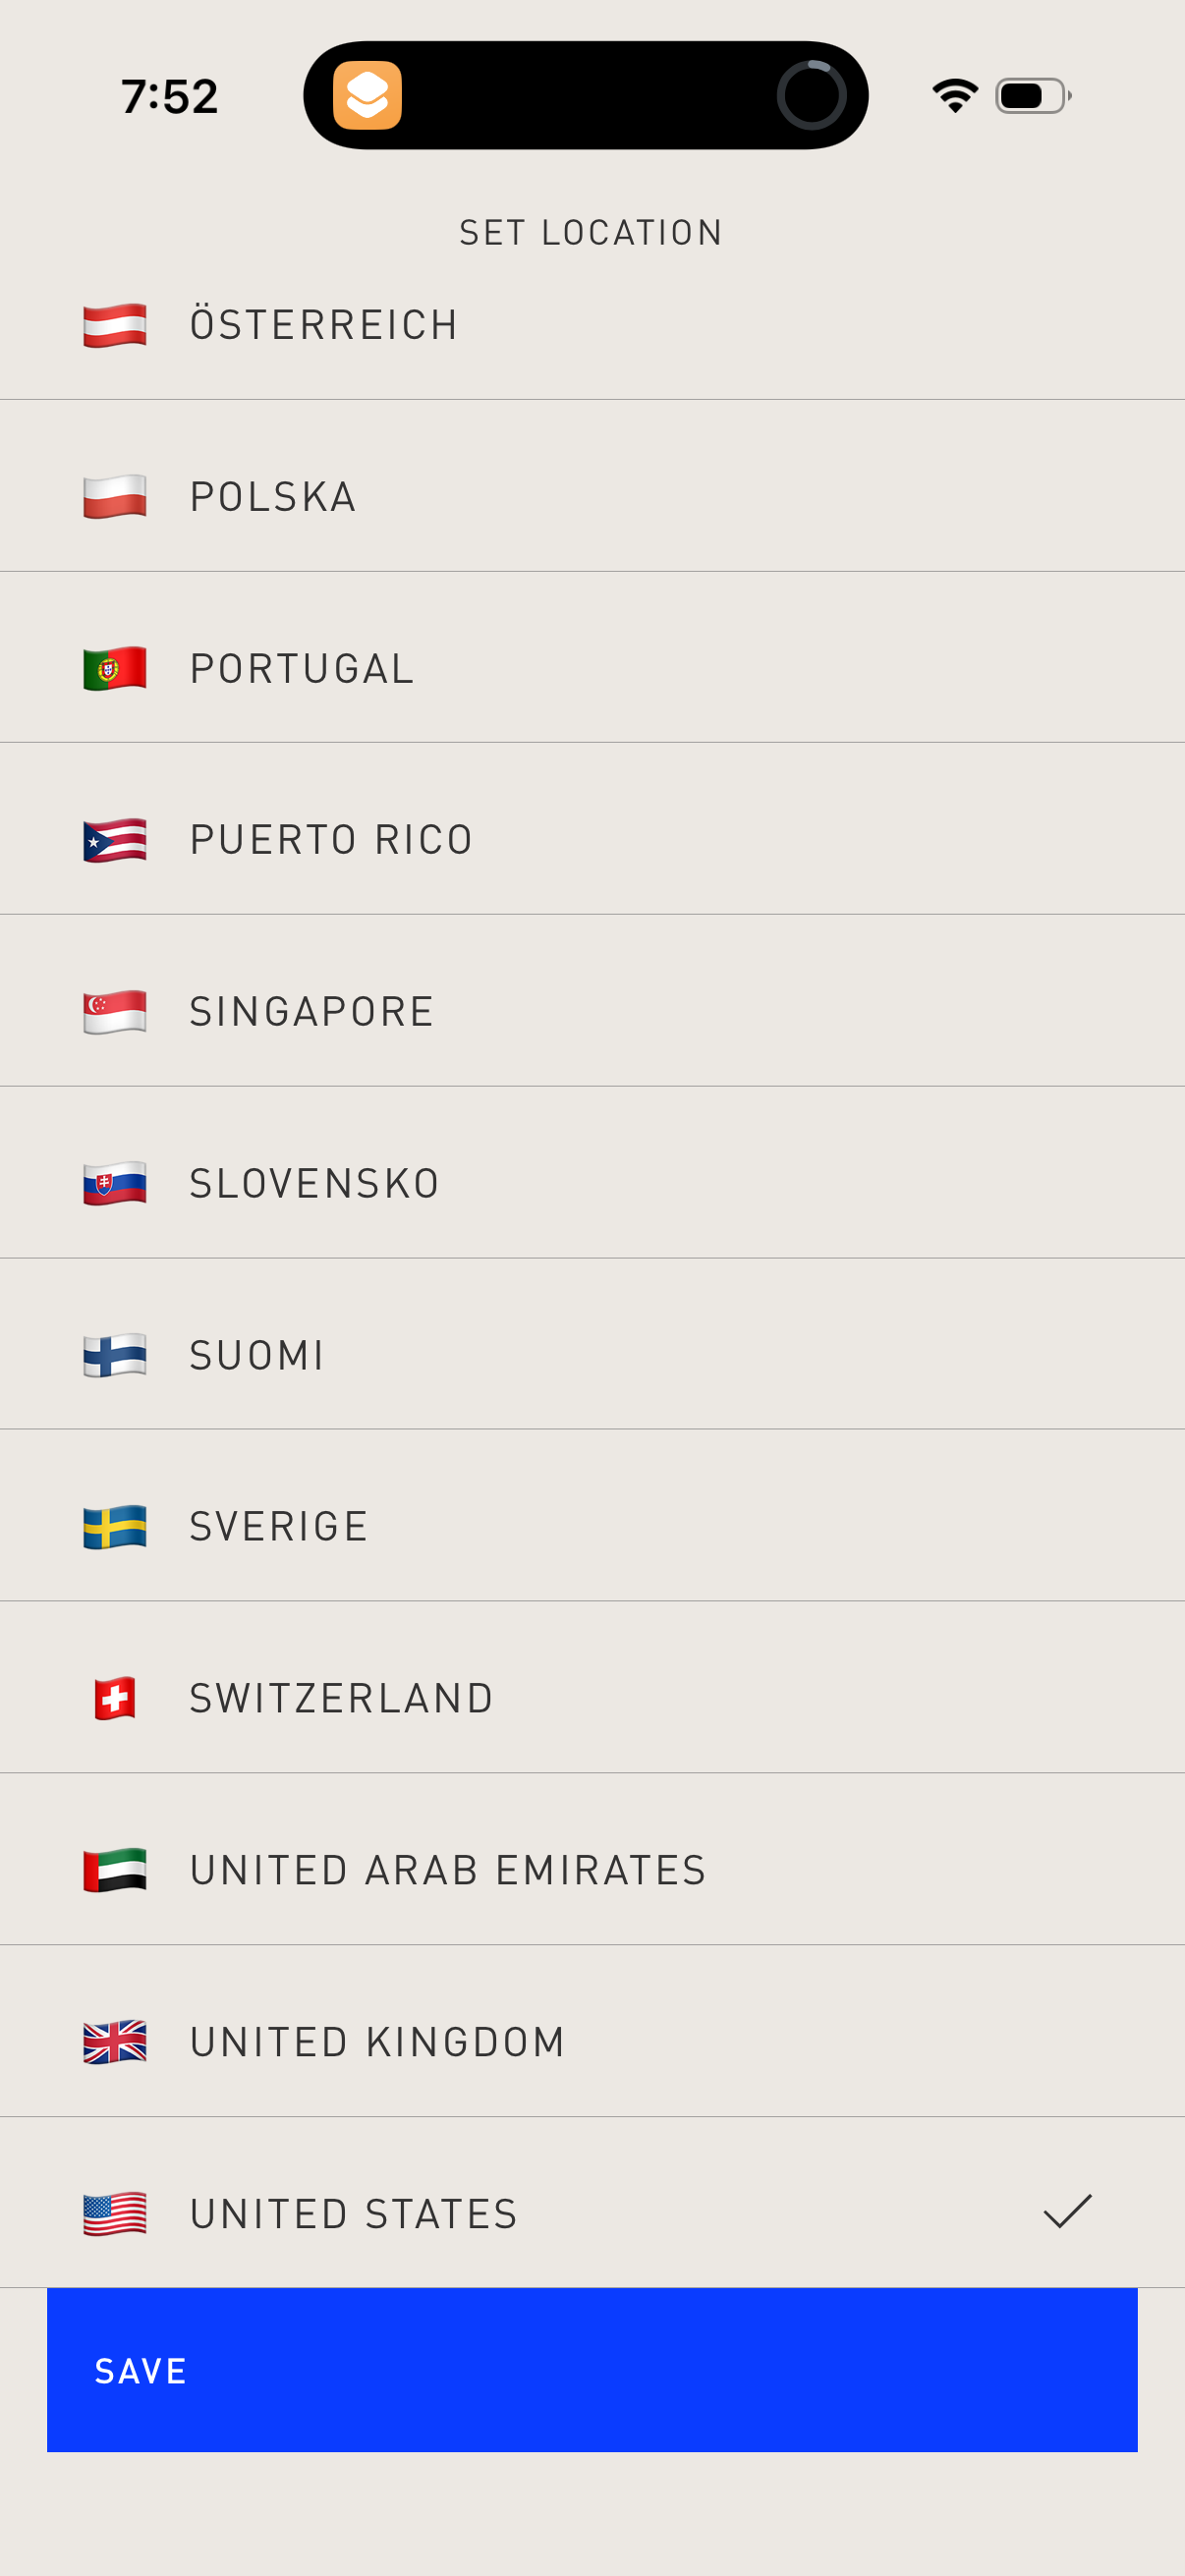
Confirmed1206 × 2622opens the full image 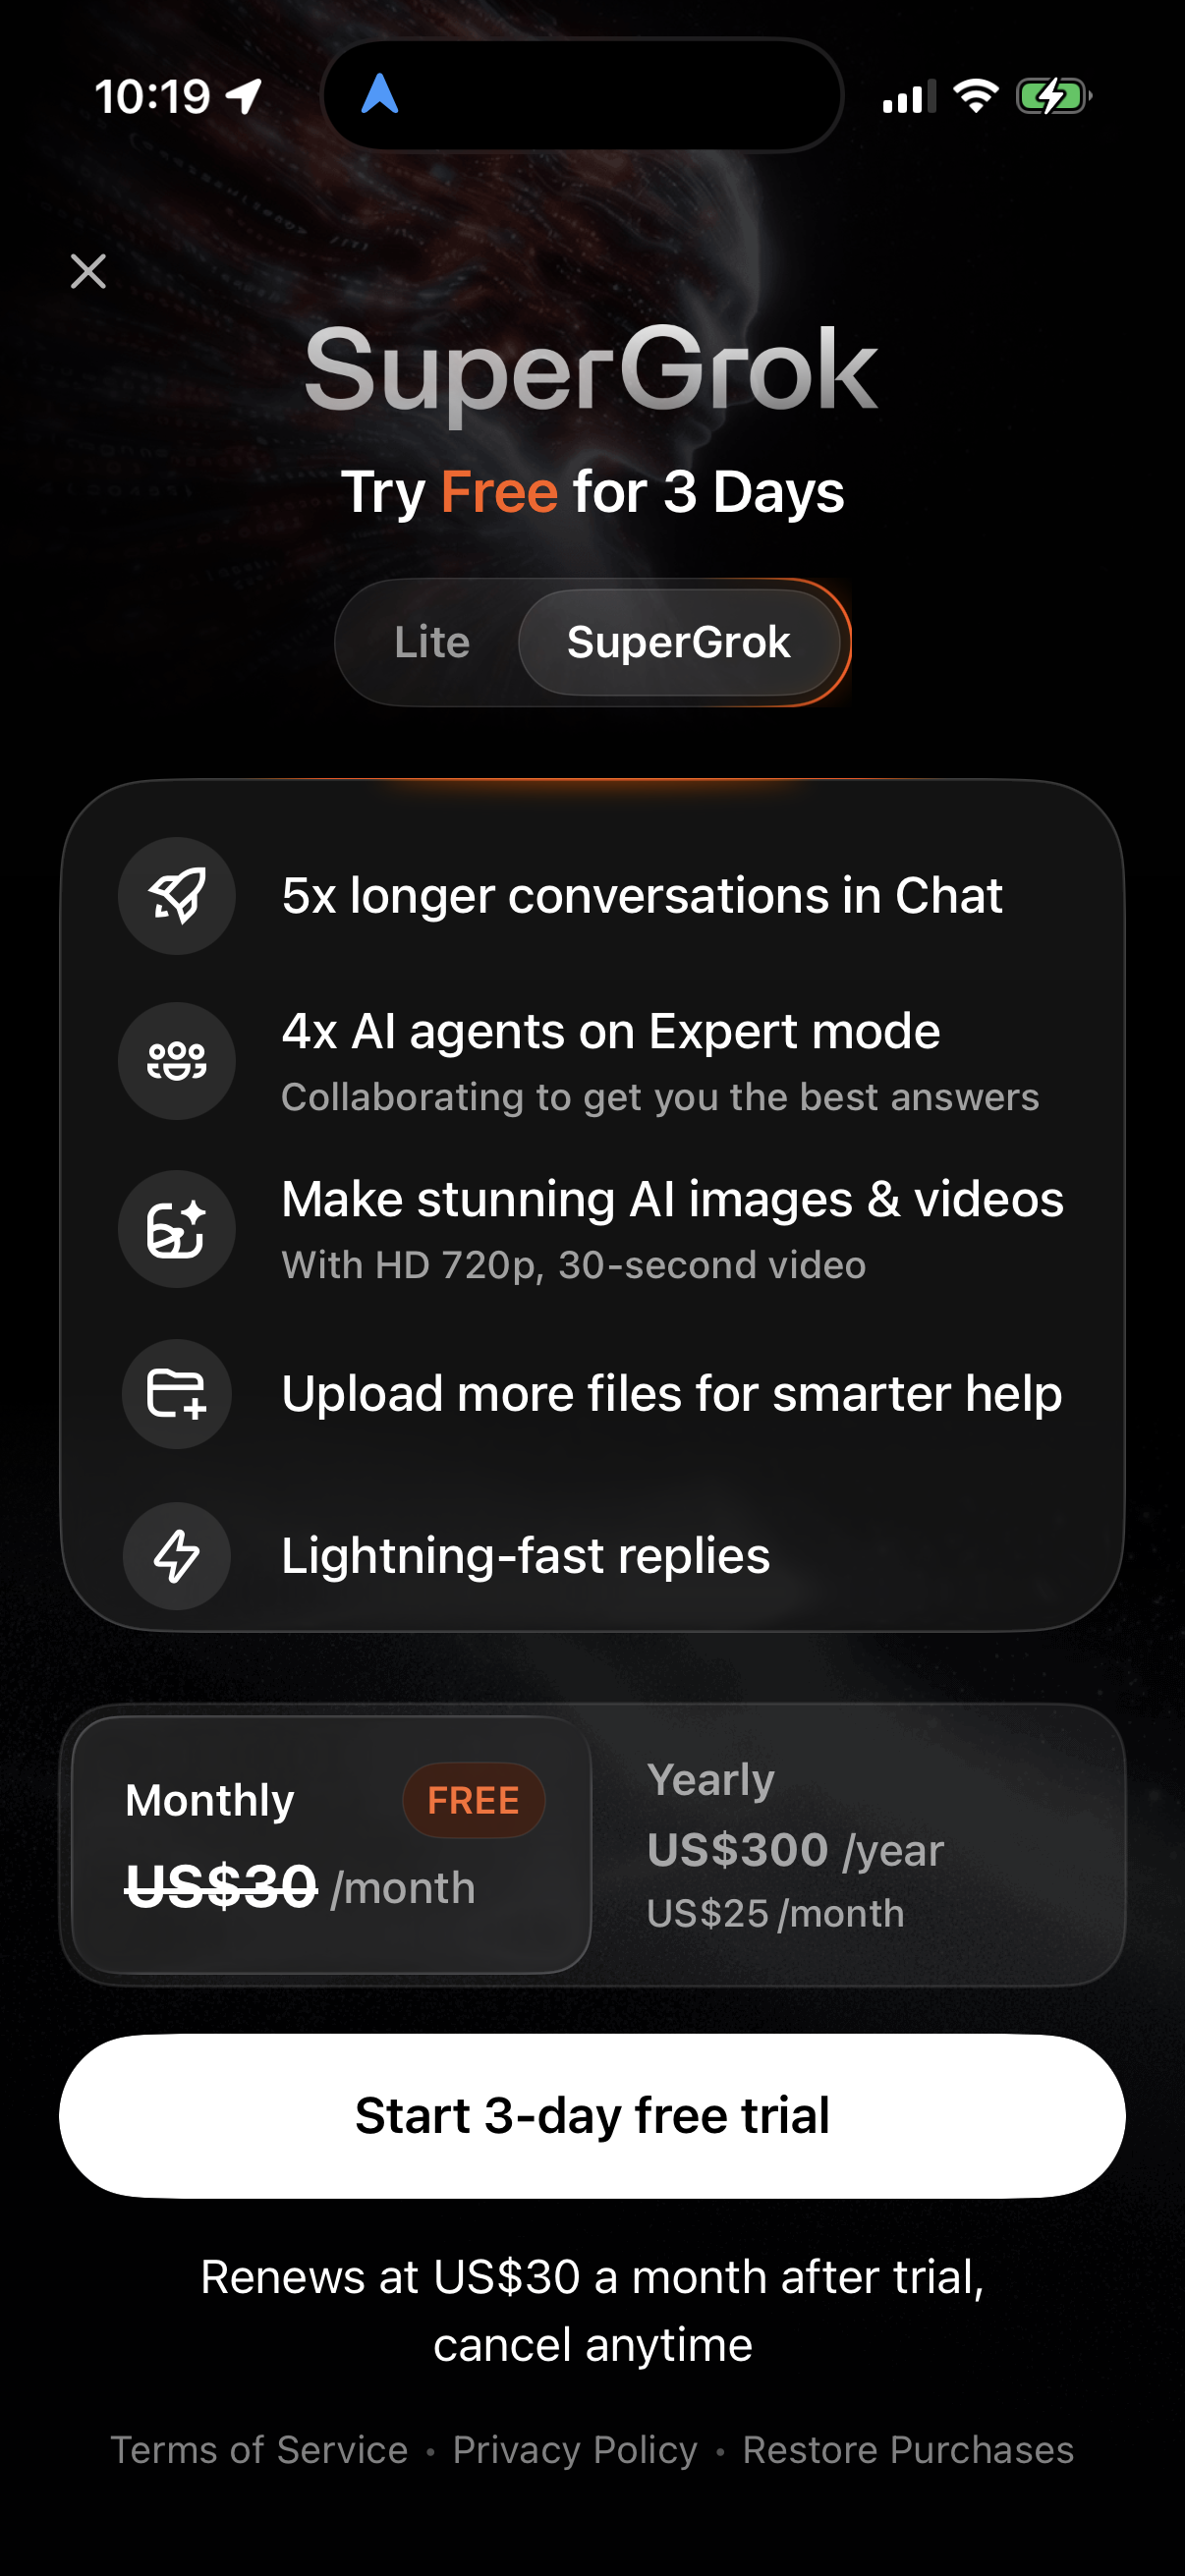
Grok1206 × 2622opens the full image 
Copilot1170 × 2532opens the full image
The numbers
| # | Stat | Computed from |
|---|---|---|
| [1] | Finance: 70 annotations, 38 experiments, 11 companies; top areas HERO 16, VALUE PROPS 14, OFFER 10 | category_totals; category_top_area |
| [2] | Finance (70 annotations) is the smallest n>=70 qualifying category | category_totals |
| [3] | Example hero move: Wise replaced two chooser cards with a live GBP-to-EUR comparison widget plus a provider table | qualitative HERO wise |
| [4] | VALUE PROPS high-impact share 15.6% corpus-wide | high_impact_share_by_area |
Methodology
Universe is 70 area annotations from 11 finance-categorized companies within 2,160 annotations over 1,126 detected experiments in the ~800 tracked-apps corpus. Thinnest qualifying category; areas LLM-annotated from observed before/after screenshots, July 2026; only n>=8 cells reported.
Sources
- [1]
Lazyweb Research analysis of 70 finance-company experiments (11 apps), July 2026
Area annotations for finance companies within 2,160 annotations.
- [2]
Lazyweb Research analysis of category annotation totals (~800 tracked apps), July 2026
Annotations by app-store category; 70 is the qualifying threshold.
- [3]
Lazyweb Research analysis of 2,160 annotated experiments (~800 tracked apps), July 2026
Named example is a single observed diff with inferred rationale.
- [4]
Lazyweb Research analysis of per-area high-impact share (n>=30 areas), July 2026
Model-assigned impact 4+/5 shares.
Source: Lazyweb Research — proprietary analysis of real, in-market app screens. Cite as Lazyweb Research, 2026-07-07.