Which app categories actually use streak screens?
- By Ali Abouelatta
- n = 809
- Published
- Updated
- 2 min read
- mobile · retention · ux-patterns · experiments
Short answer
Streaks are essentially a two-category pattern: 50% of Health & Fitness apps (28 of 56) and 51% of Education apps (19 of 37) have a streak screen, versus 2% in Finance, News, and Travel.source[1] Overall only 12% of apps have one.source[2] If your app isn't in a daily-habit vertical, streaks are the exception, not the norm.
Health & Fitness (50%) and Education (51%) carry streaks; Finance, News, Travel each <=2% — July 2026.
The finding
The concentration is stark. Half of Health & Fitness apps (28/56, 50%) and just over half of Education apps (19/37, 51%) have a streak screen.source[1] The next-highest verticals are Social Networking (6/40, 15%) and Sports (3/22, 14%) — already a big drop.source[1] At the bottom, Finance (1/47), News (1/46), and Travel (1/41) each sit at roughly 2%.source[1] Against the 12% overall base, fitness and education are ~4x over-indexed while transactional and content categories are near-zero.source[2]
How to apply this
Use vertical as your first filter for whether a streak makes sense. If you build in fitness, habit-tracking, or learning, a streak is a peer-standard retention mechanic and its absence is conspicuous. Anywhere else, the near-zero adoption in Finance, News, and Travel is a signal that daily-streak pressure doesn't fit episodic usage — copying it would fight your natural cadence. Streaks reward daily return; only adopt them where daily return is the goal.
Caveats
Numerators outside the top two verticals are single digits (1-6), so those percentages are directional; lean on the absolute counts.source[1] Lower bound on capture applies. Verticals below 20 apps excluded; deduped by company over 809.source[3]
Real in-market screens
Screens from real, in-market apps, tracked by Lazyweb Research.
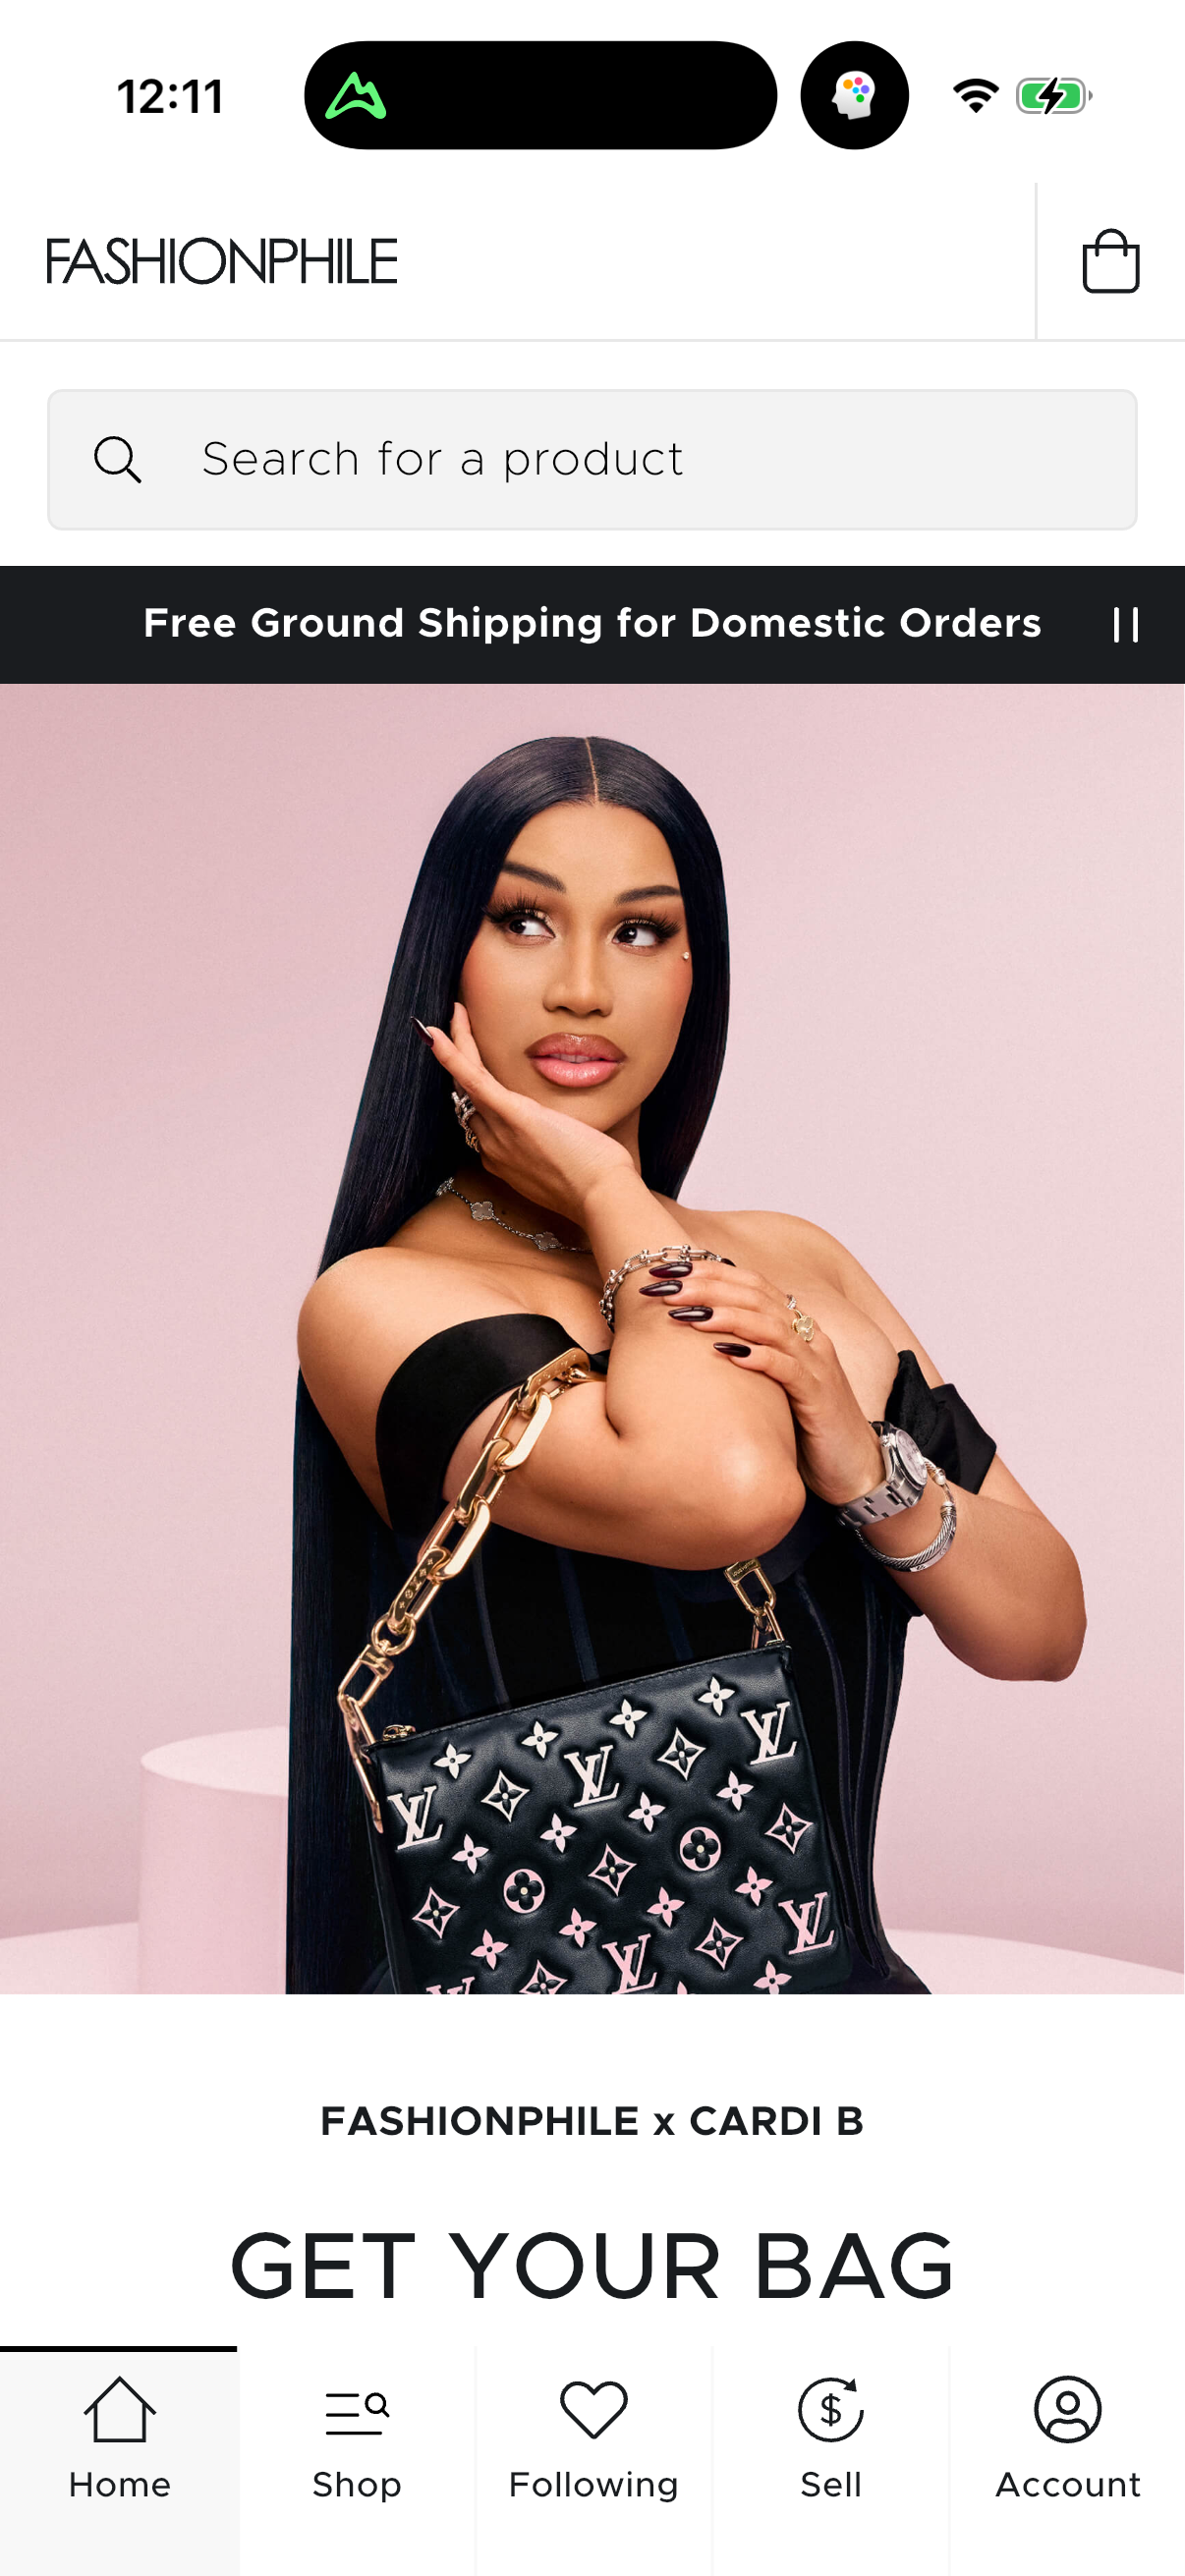
Fashionphile1206 × 2622opens the full image 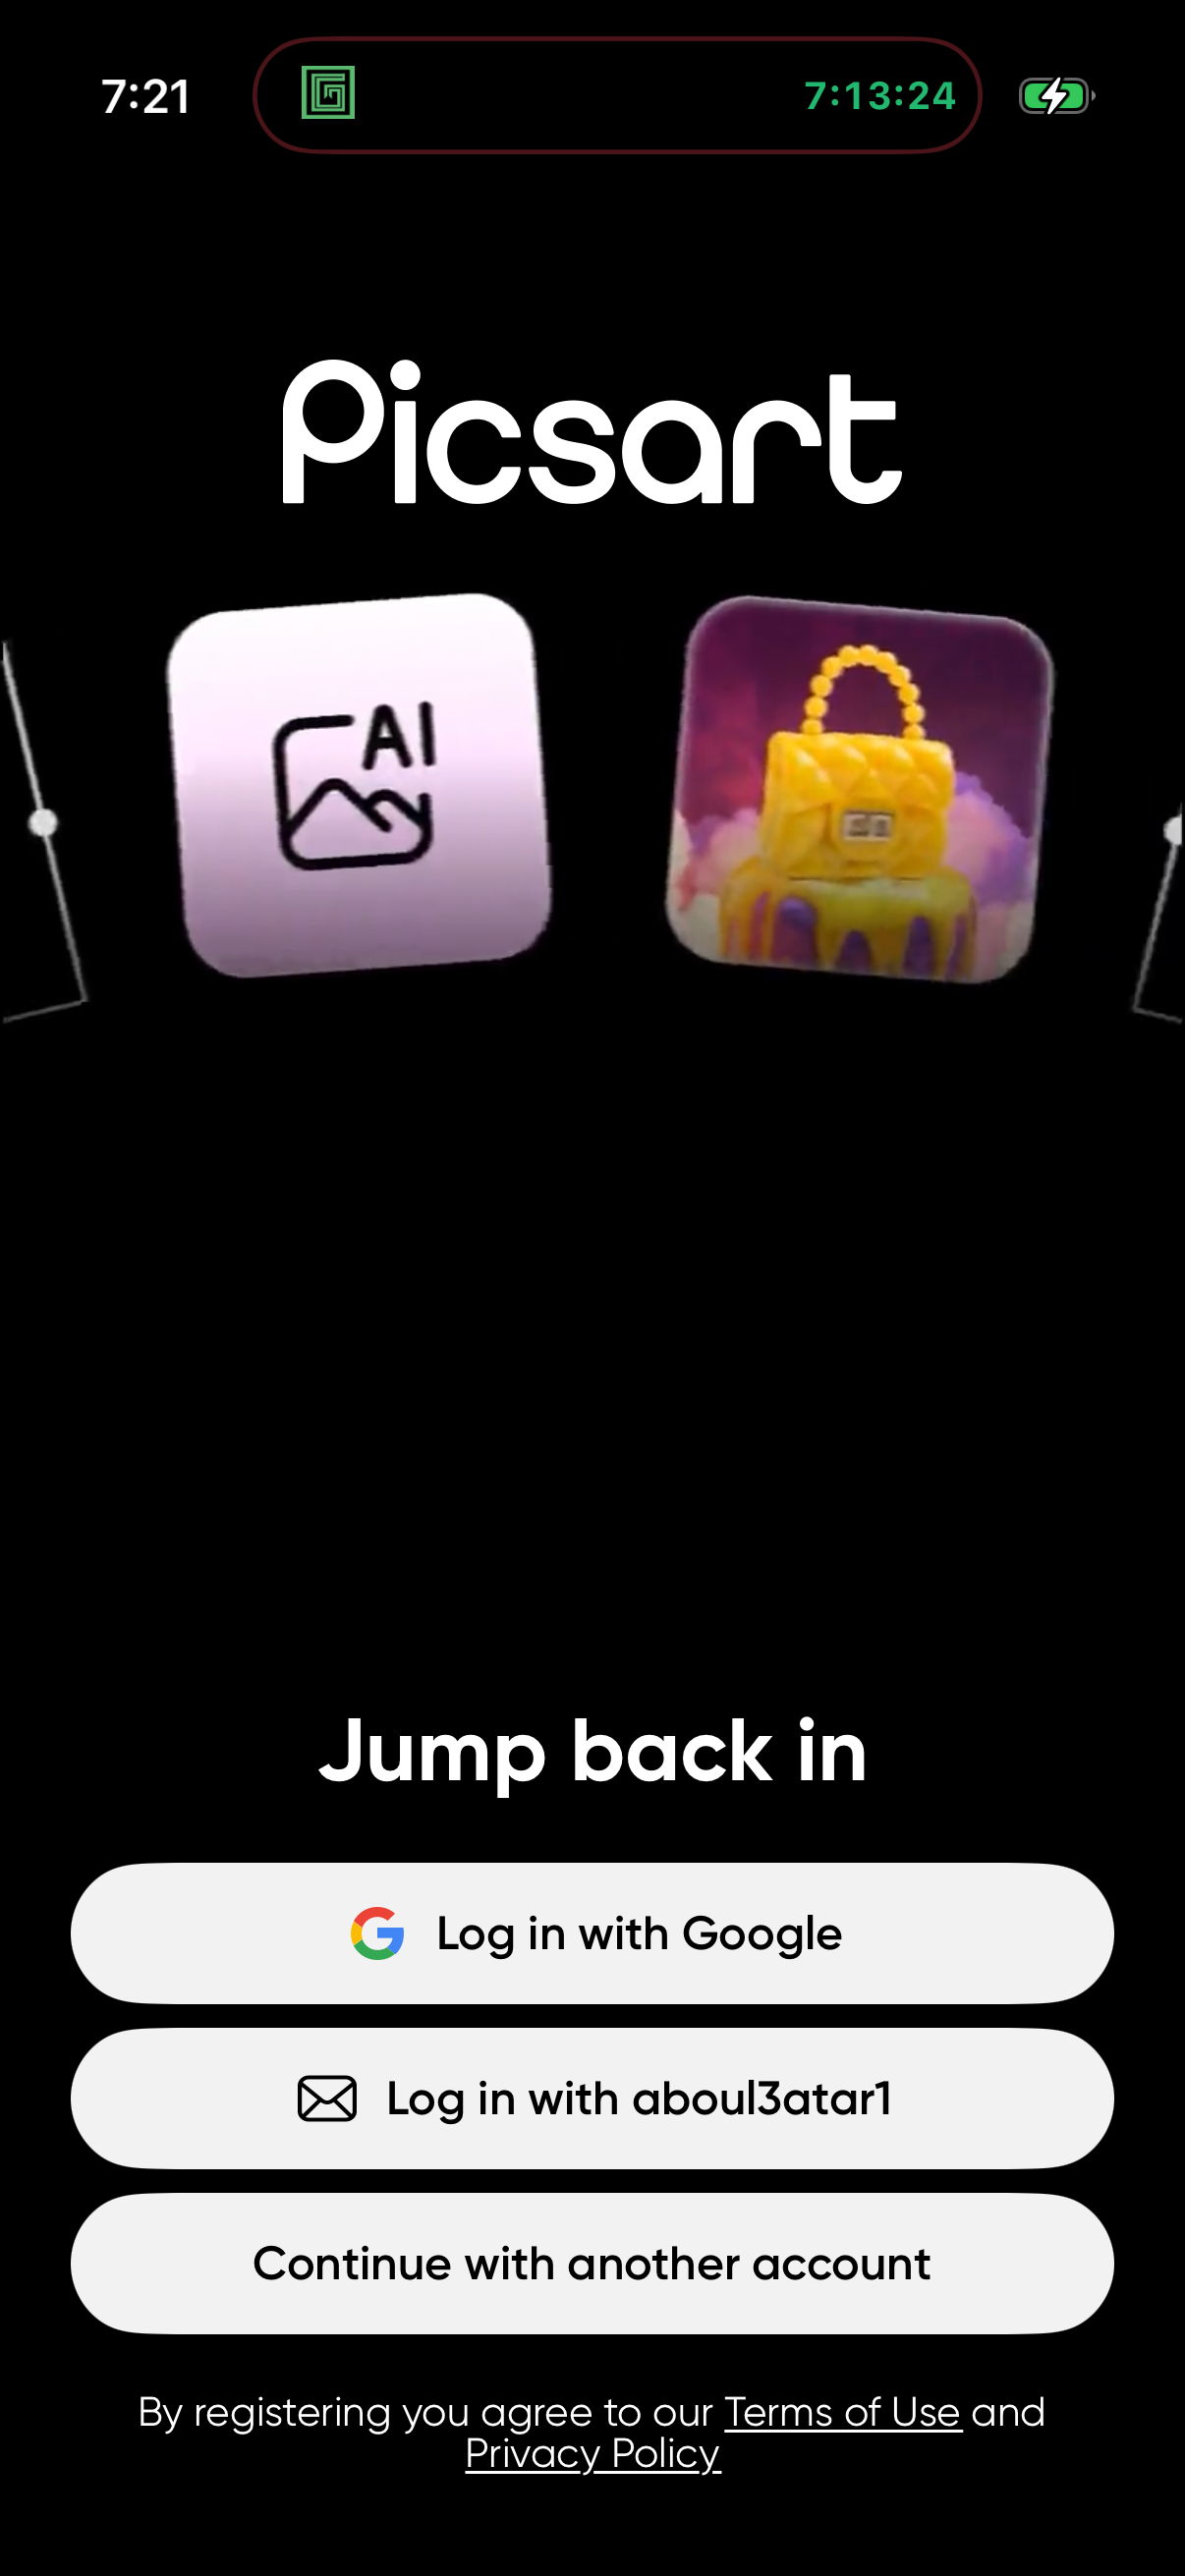
Picsart1206 × 2622opens the full image 
Priority Pass1206 × 2622opens the full image 
Troutroutes602 × 1308opens the full image
The numbers
| # | Stat | Computed from |
|---|---|---|
| [1] | Health & Fitness 28/56 (50%), Education 19/37 (51%), Social Networking 6/40 (15%), Sports 3/22 (14%), Entertainment 4/30 (13%), Productivity 7/64 (11%), Music 3/28 (11%), Shopping 3/44 (7%), Travel 1/41 (2%), News 1/46 (2%), Finance 1/47 (2%) | streaks_by_category |
| [2] | 94 of 809 apps (11.6%) overall have a streak screen | prevalence_streaks |
| [3] | Universe 809 apps; per-vertical cuts n>=20 | universe_denominators |
Methodology
Universe: 809 mobile apps; per-vertical cuts limited to n>=20 apps. Method: streak tag match deduped by company per category, July 2026. Caveat: small numerators outside fitness/education.
Sources
- [1]
Lazyweb Research analysis of 809 mobile apps (apps with >=1 captured screenshot), July 2026
Per-vertical bool_or of streak tags; denominators apps-with-screens per category, n>=20; small numerators outside top two verticals.
- [2]
Lazyweb Research analysis of 809 mobile apps (apps with >=1 captured screenshot), July 2026
94 distinct companies with a streak tag match over 809.
- [3]
Lazyweb Research analysis of 809 mobile apps (apps with >=1 captured screenshot), July 2026
Lower bound; verticals below 20 apps excluded.
Source: Lazyweb Research — proprietary analysis of real, in-market app screens. Cite as Lazyweb Research, 2026-07-07.