Which screens do almost every mobile app have, and which are actually rare?
- By Ali Abouelatta
- n = 809
- Published
- Updated
- 2 min read
- mobile · ux-patterns · design · onboarding · saas
Short answer
Across 809 tracked apps (median 41 captured screens each), the most universal non-home screen is settings, in 71% (578 of 809) of apps.source[1] After that, prevalence drops fast: profile 58% (469), search 56% (450), then most 'expected' patterns like paywalls (38%), checkout (33%), and referral (25%) are minorities.source[2] Only a handful of screens are near-universal — most patterns you assume 'everyone has' are actually present in fewer than half of apps.
Settings is the most universal non-home screen: 578 of 809 tracked apps (71%) have one — July 2026.
Bar chart · % of 809
% of 809 — The prevalence ladder
One block is about 2.5%
- Settings
- 71%
- Profile / account
- 58%
- Search
- 56%
- In-flow upsell (broad)
- 46%
- Empty state
- 46%
- Social login
- 41%
- Notification primer
- 40%
- Paywall
- 38%
- Checkout / cart
- 33%
- Referral / invite
- 25%
The prevalence ladder
Ranked by share of the ~800 tracked apps with a captured screen of each type:
| Screen pattern | Apps | % of 809 |
|---|---|---|
| Settings | 578 | 71% |
| Profile / account | 469 | 58% |
| Search | 450 | 56% |
| In-flow upsell (broad) | 374 | 46% |
| Empty state | 370 | 46% |
| Social login | 329 | 41% |
| Notification primer | 323 | 40% |
| Paywall | 305 | 38% |
| Checkout / cart | 270 | 33% |
| Referral / invite | 205 | 25% |
Settings, profile, and search are the only patterns above 50%.source[1]source[2] Everything associated with monetization or growth is a minority pattern.source[2]
How to apply this
Use this as a de-biasing check before you build. If a stakeholder says 'every app has X,' the honest answer for most X is 'fewer than half do.' Settings and profile are table-stakes; a paywall, referral, or checkout screen is a deliberate choice made by a minority, not a default you're missing.source[2] Prioritize the near-universal screens for polish (they touch every user) and treat the long tail as bets tied to your business model, not obligations.
Caveats
These are lower bounds. Prevalence reflects only screens Lazyweb captured (median 41 per app), so an app may have a screen we never captured.source[3] Read every figure as 'N of ~800 tracked apps have a captured X screen,' not 'only N apps have X.' Tag matches are LLM synonym phrases deduped by company.source[3]
Real in-market screens
Screens from real, in-market apps, tracked by Lazyweb Research.
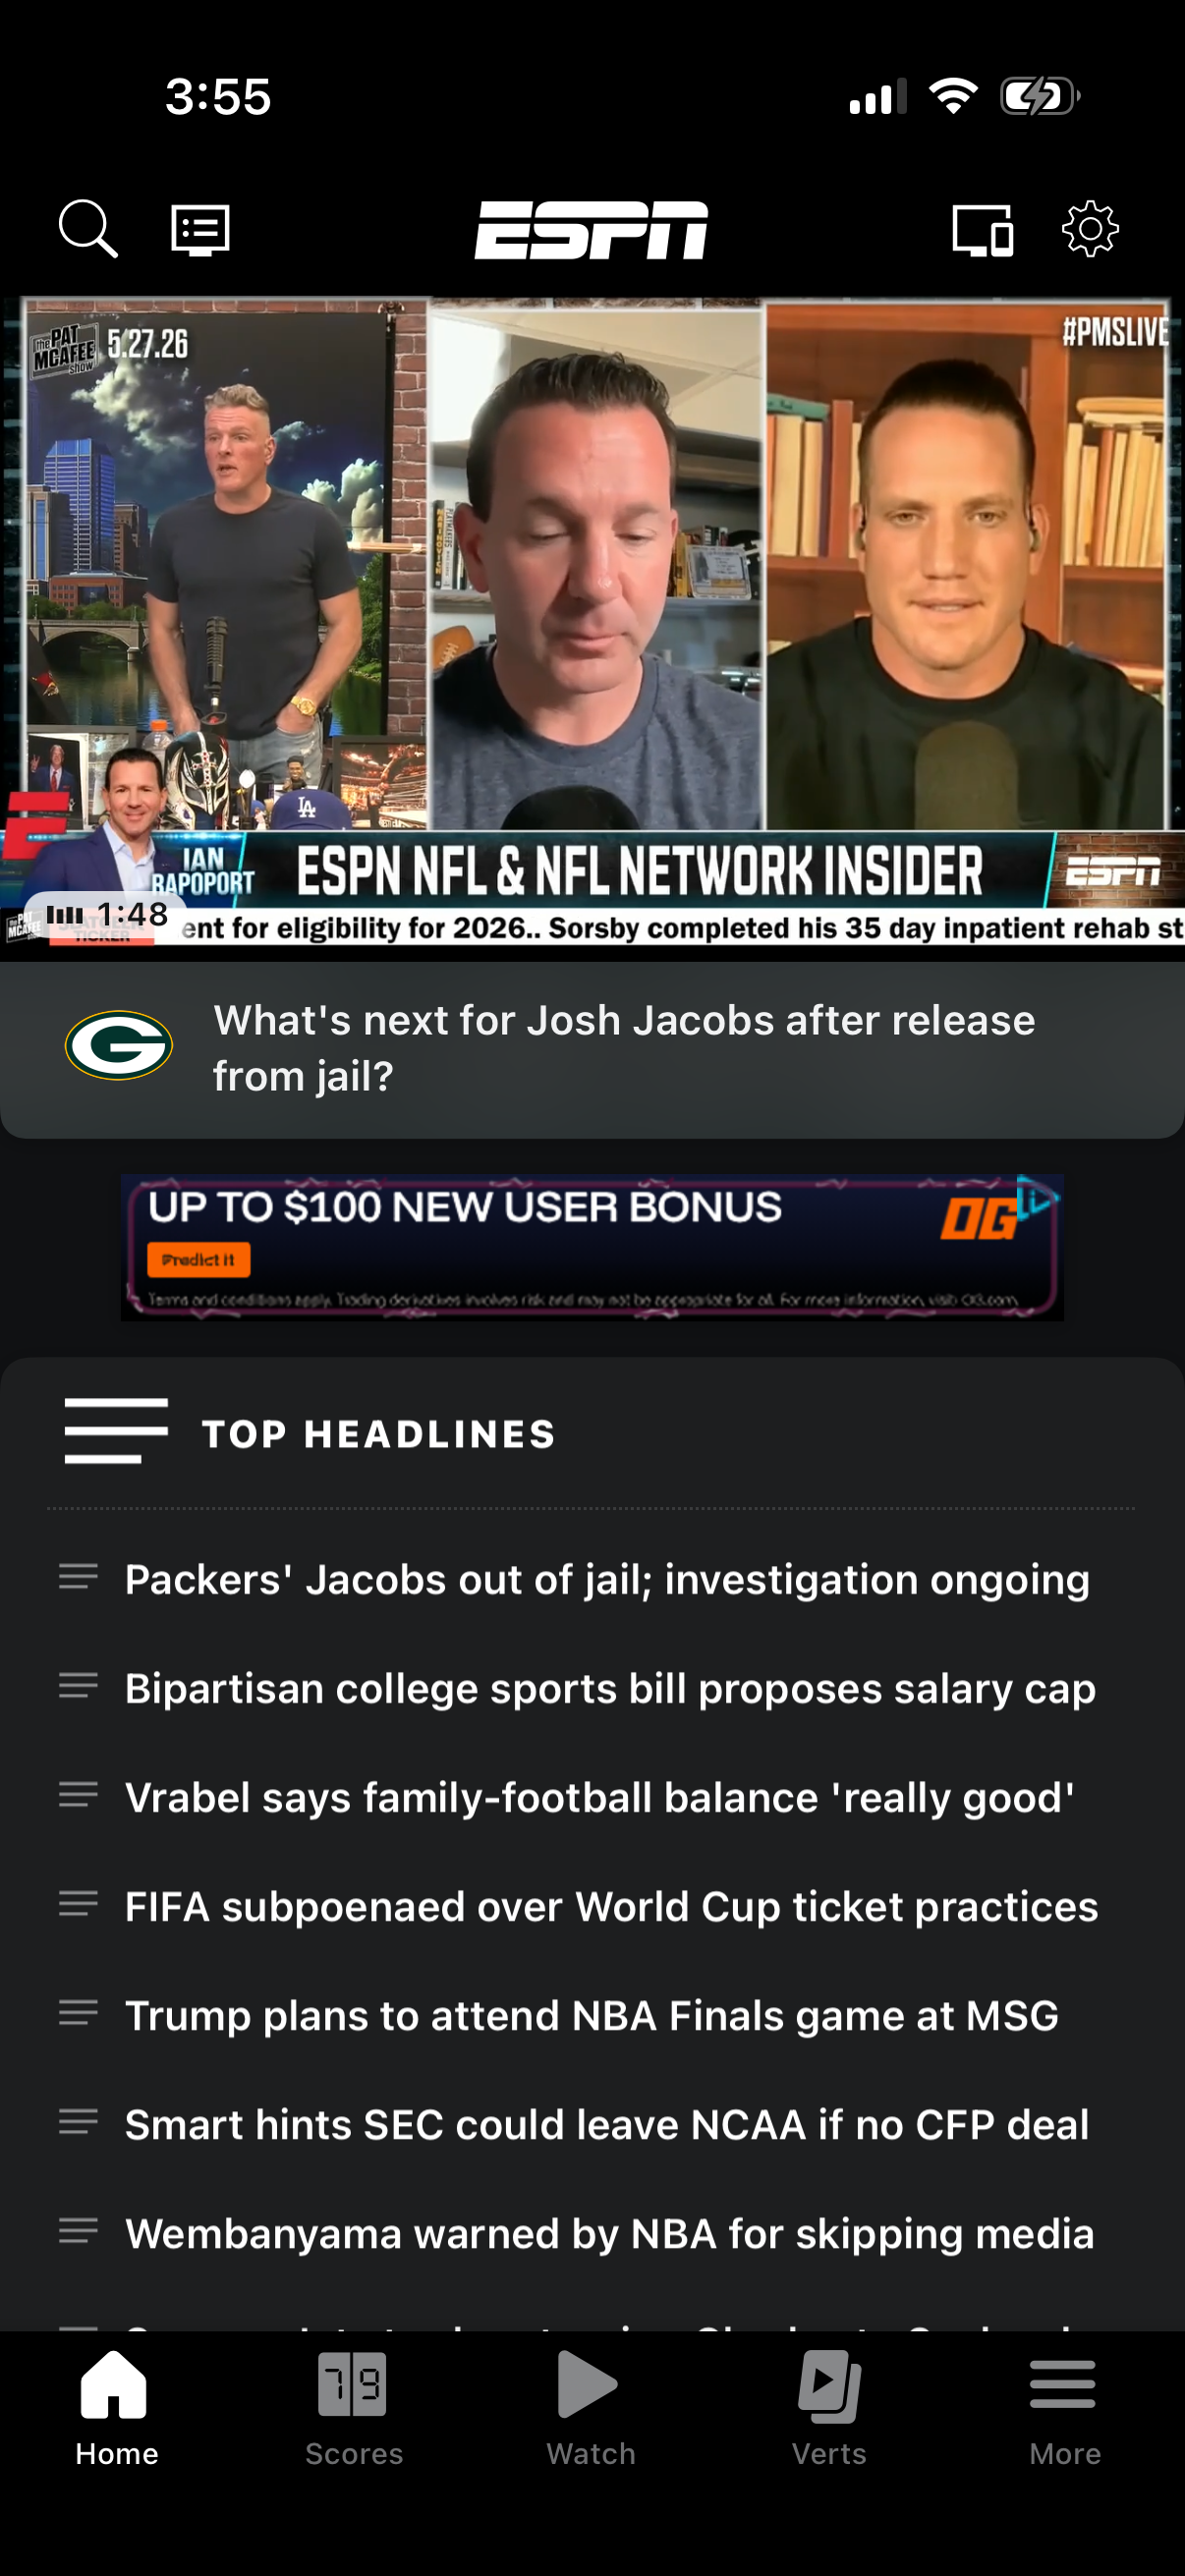
Espn1206 × 2622opens the full image 
Expedia1290 × 2796opens the full image 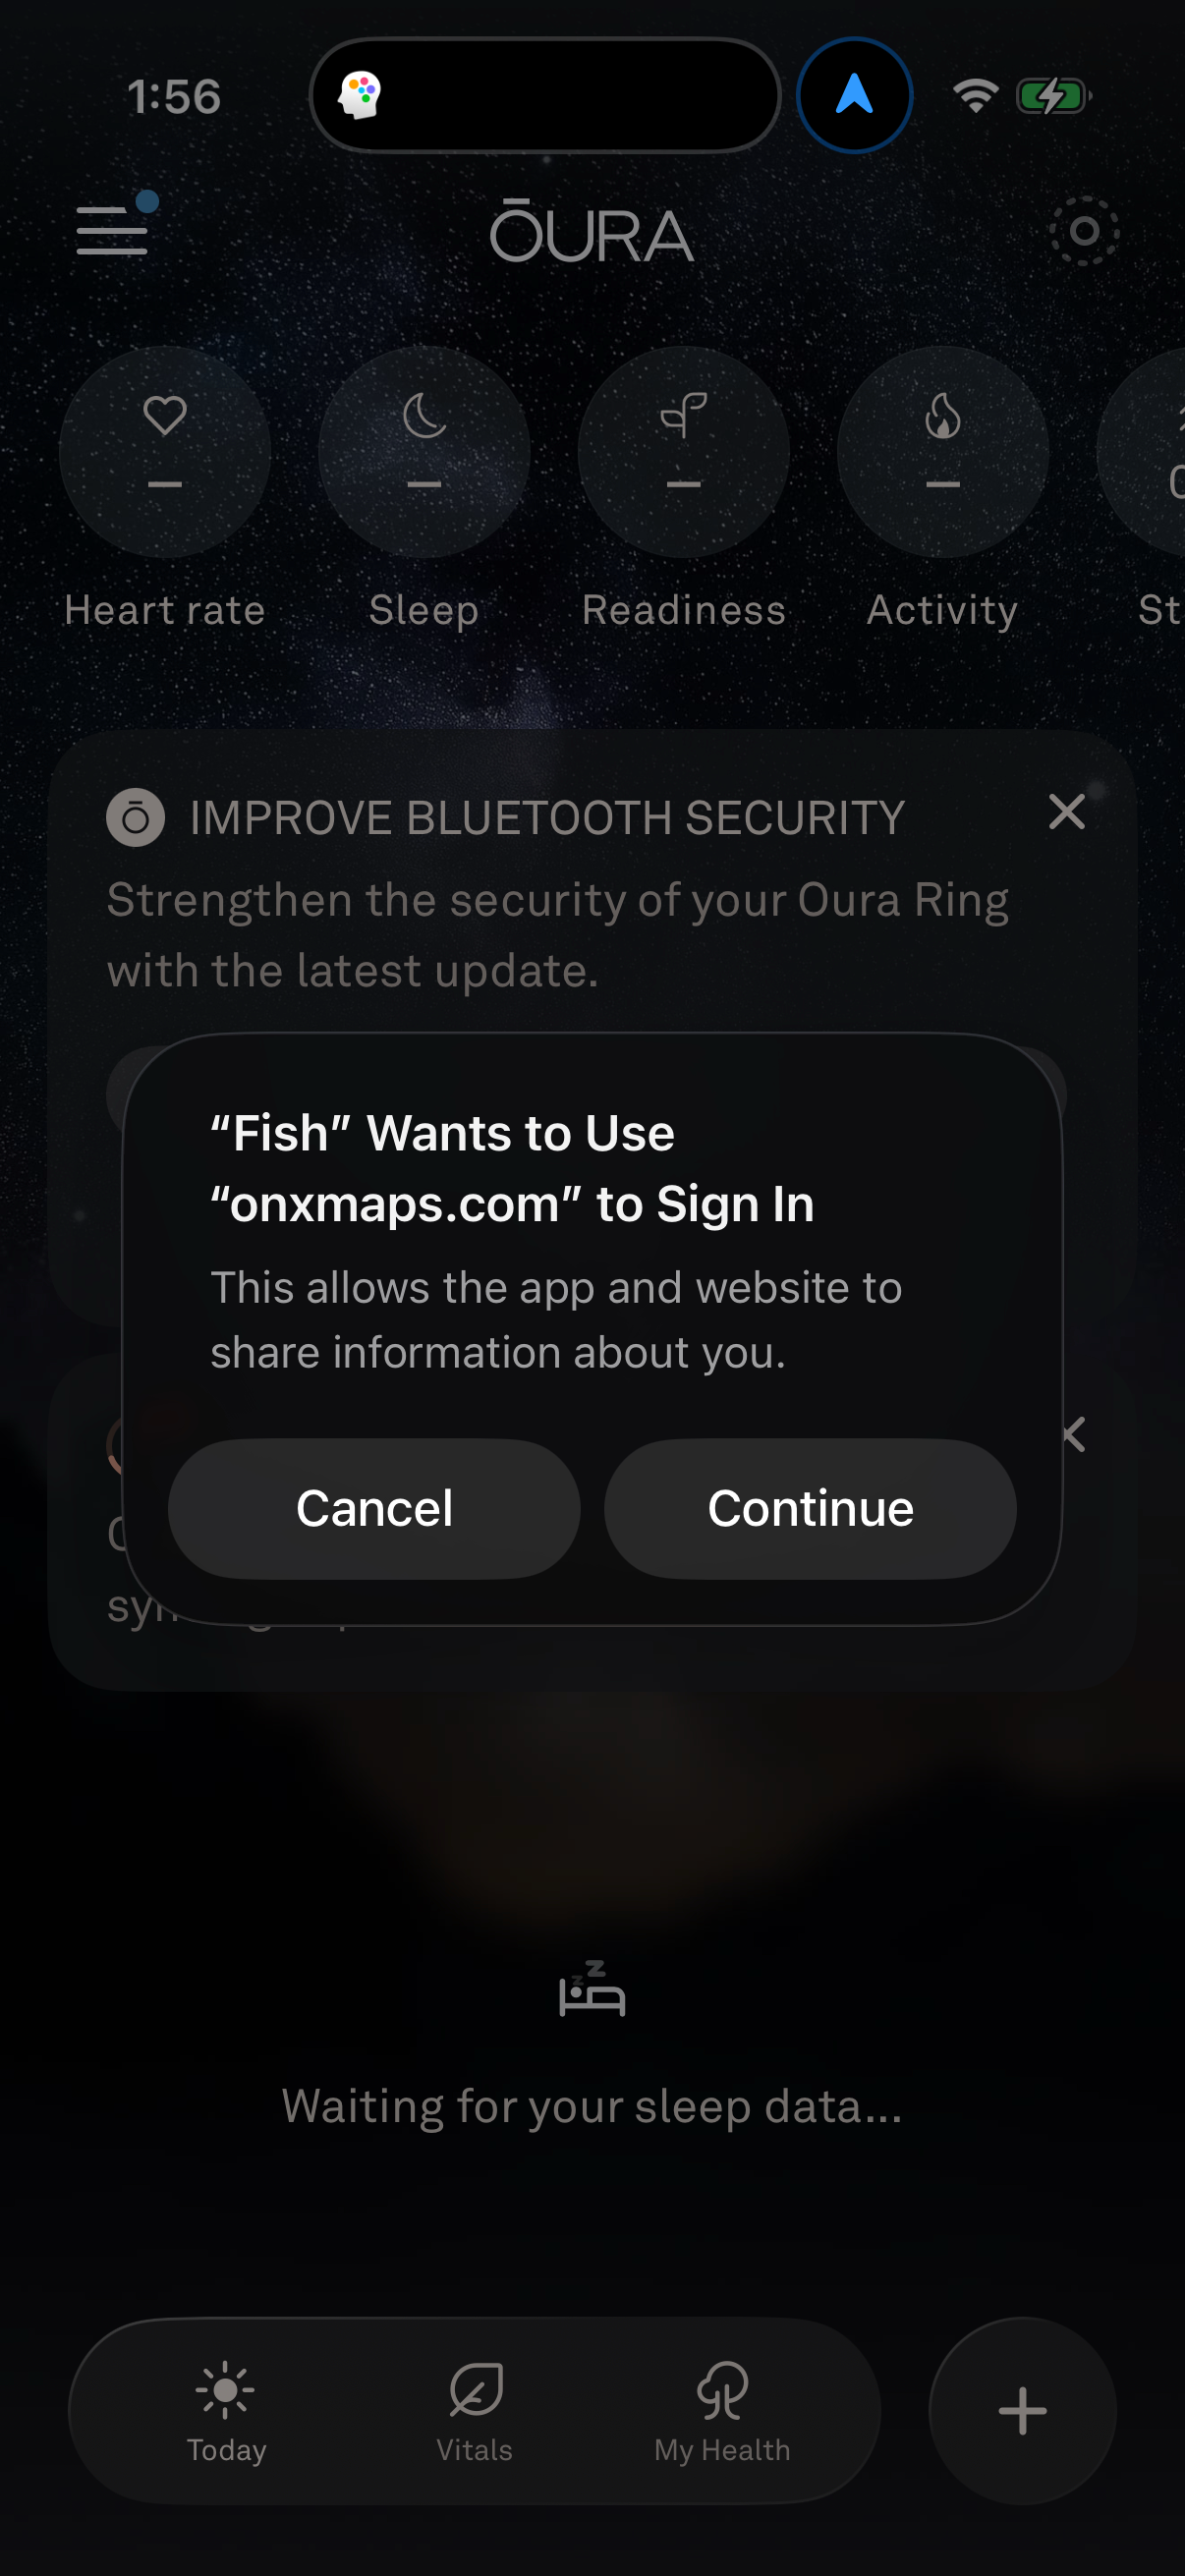
Oura1206 × 2622opens the full image 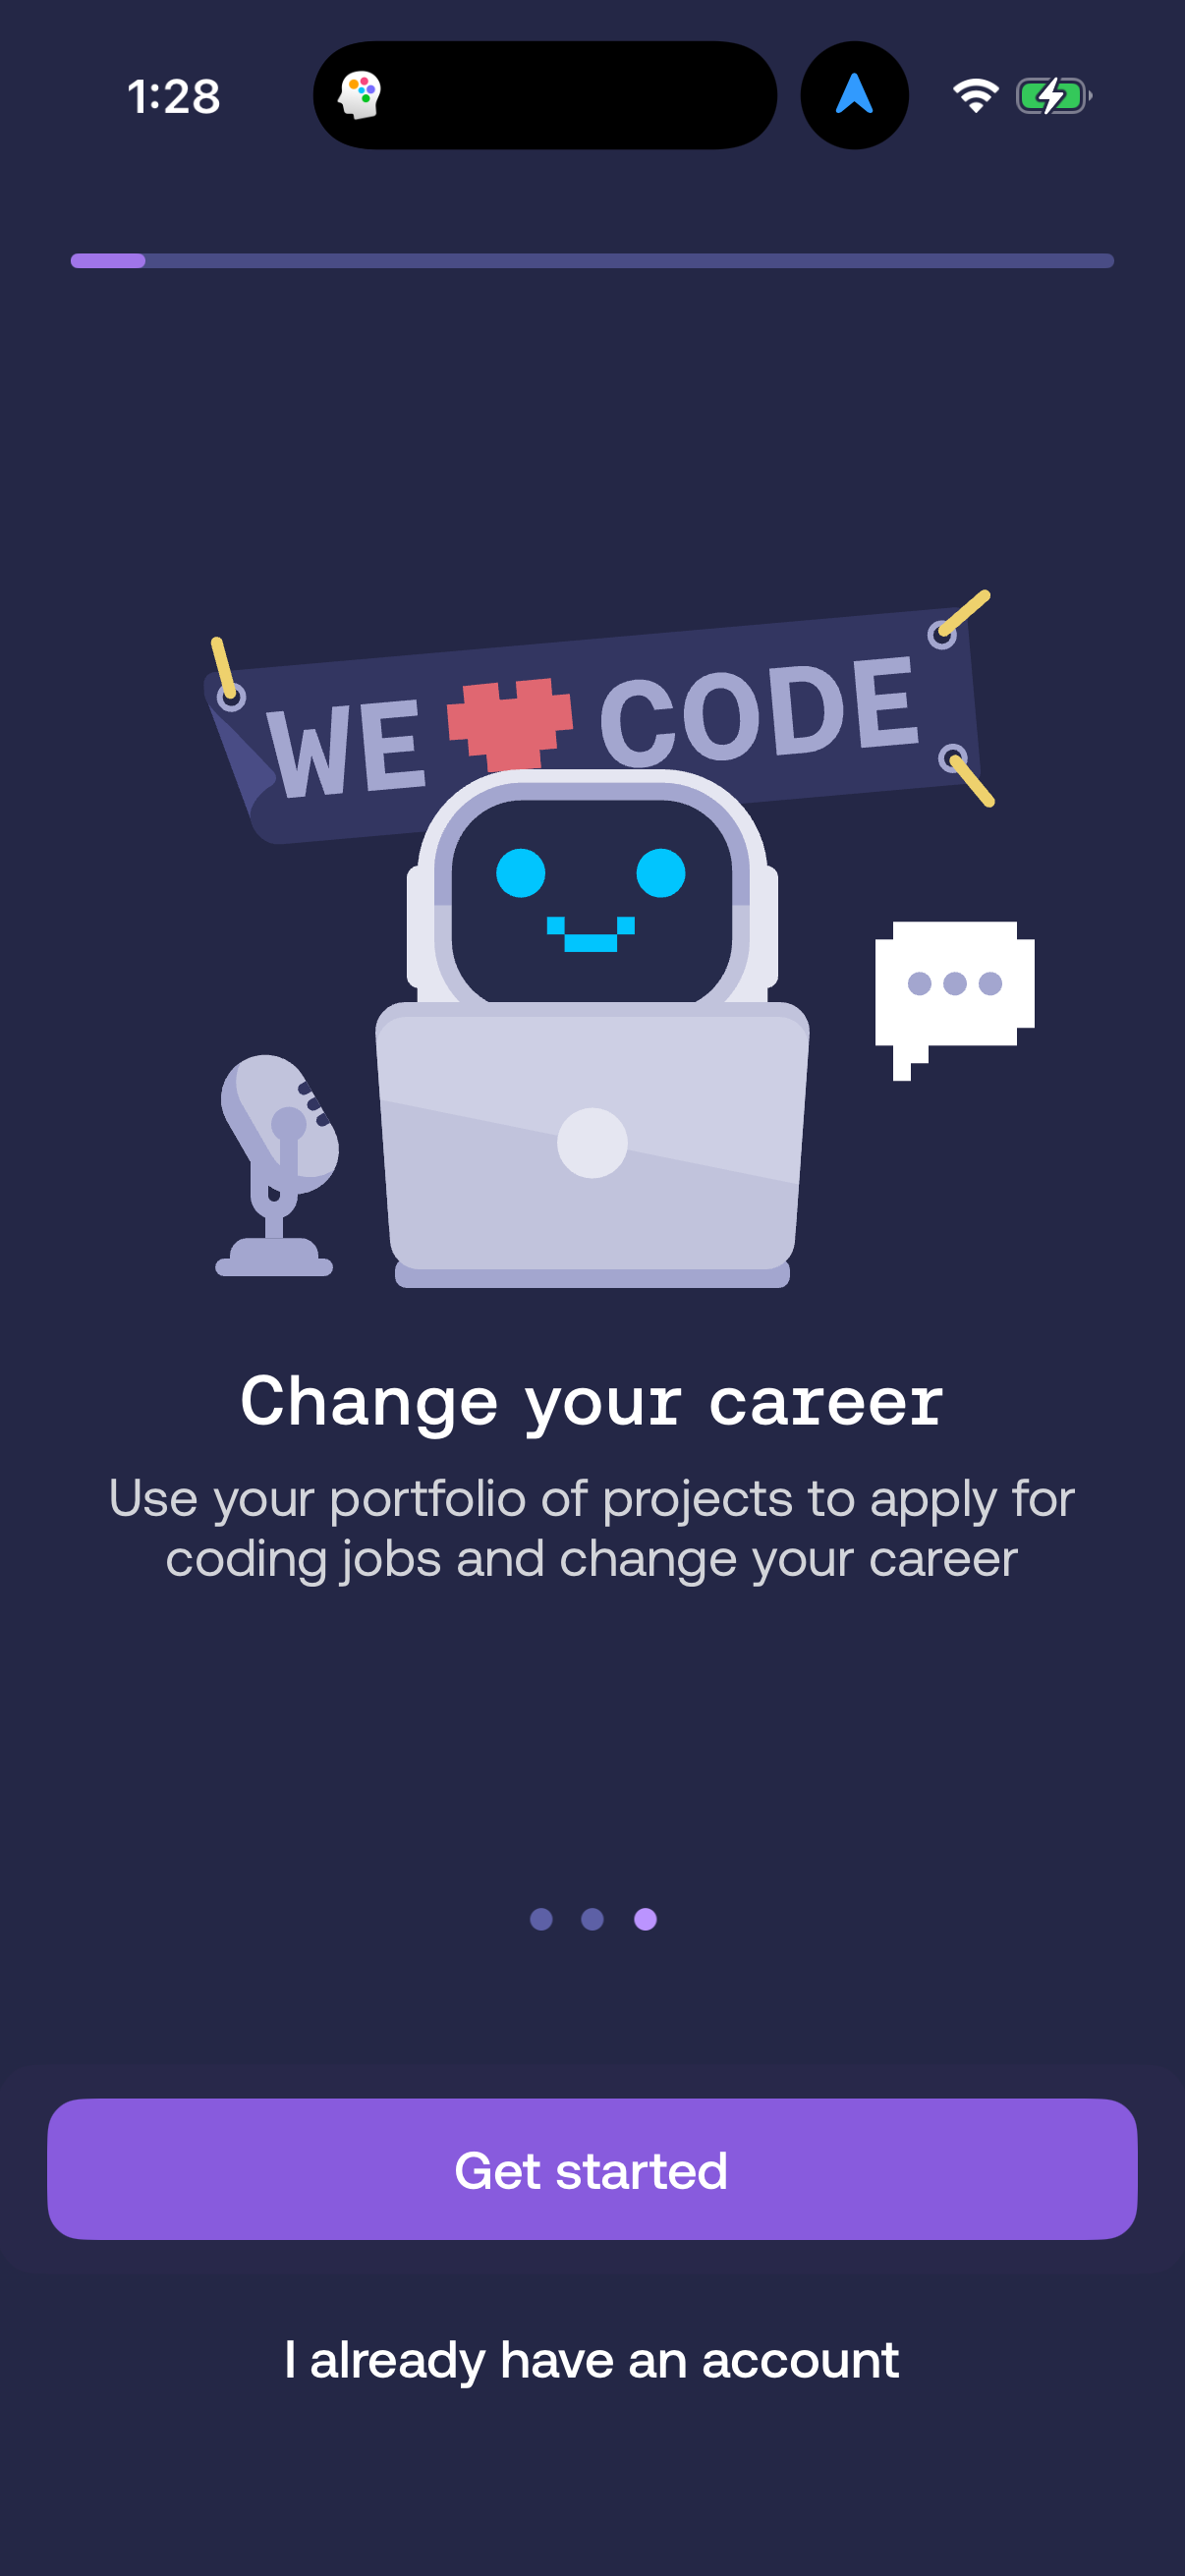
Mimo1206 × 2622opens the full image
The numbers
| # | Stat | Computed from |
|---|---|---|
| [1] | 578 of 809 apps (71.4%) have a settings screen | prevalence_settings_screen |
| [2] | profile 469 (58.0%), search 450 (55.6%), in-flow upsell 374 (46.2%), empty state 370 (45.7%), social login 329 (40.7%), notification primer 323 (39.9%), paywall 305 (37.7%), checkout 270 (33.4%), referral 205 (25.3%) | prevalence_profile_screen, prevalence_search_screen, prevalence_checkout_upsell, prevalence_empty_state, prevalence_social_login, prevalence_notification_primer, prevalence_paywall_screen, prevalence_checkout_cart, prevalence_referral_invite |
| [3] | Universe: 809 apps with >=1 screenshot, median 41 captured screens per app; tags deduped by company | universe_denominators |
Methodology
Universe: 809 mobile apps with at least one captured screenshot (median 41 screens/app). Method: per-pattern tag match deduped by COUNT(DISTINCT company_name) across 44,873 tagged screenshots, July 2026. Caveat: prevalence is a lower bound on true product prevalence.
Sources
- [1]
Lazyweb Research analysis of 809 mobile apps (apps with >=1 captured screenshot), July 2026
Prevalence = COUNT(DISTINCT company_name) with a tag match, over an 809-app base.
- [2]
Lazyweb Research analysis of 809 mobile apps (apps with >=1 captured screenshot), July 2026
Per-pattern tag matches deduped by company across 44,873 tagged screenshots.
- [3]
Lazyweb Research analysis of 809 mobile apps (apps with >=1 captured screenshot), July 2026
Prevalence is a lower bound: median 41 screens captured per app; 751 apps have tag data, reported over 809 for a conservative base.
Source: Lazyweb Research — proprietary analysis of real, in-market app screens. Cite as Lazyweb Research, 2026-07-07.
Explore the evidence
- Full 45-frame August 2026 capture
- Three captured screens · August 2026