Which app categories are most likely to have a referral program?
- By Ali Abouelatta
- n = 809
- Published
- Updated
- 2 min read
- mobile · retention · monetization · ux-patterns · experiments
Short answer
Referral density peaks in Social Networking and Health & Fitness at 50% each (20/40 and 28/56), followed by Travel at 42% (17/41).source[1] The floor is News at 13% (6/46) and Productivity at 16% (10/64).source[1] Against a 25% overall base, social, fitness, and travel apps are roughly 2x over-indexed on referral.source[2]
Social Networking and Health & Fitness lead referral adoption at 50% each — July 2026.
The finding
Ranked by referral density among categories with n>=20 apps: Social Networking 50% (20/40), Health & Fitness 50% (28/56), Travel 42% (17/41), Education 38% (14/37), Food & Drink 37% (10/27), Finance 32% (15/47), Lifestyle 31% (11/35), Shopping 27% (12/44), Productivity 16% (10/64), News 13% (6/46).source[1] The overall rate is 25%, so the top three categories run at roughly double the corpus average, and News/Productivity at about half.source[2]
How to apply this
Referral fits products with a built-in reason to bring in another person. Social apps get more valuable with each friend; fitness apps thrive on accountability partners; travel benefits from group coordination — hence their 42-50% adoption.source[1] Content-consumption apps (News) and solo tools (Productivity) sit at the bottom because inviting a friend doesn't obviously improve the sender's experience. Before building referral, ask whether your user gains something real by inviting someone; the density data says that's the differentiator.
Caveats
Lower bound on capture applies.source[3] Some vertical numerators are moderate (News 6, Food & Drink 10) — read counts alongside percentages. Verticals below 20 apps excluded; deduped by company over 809.source[3]
Real in-market screens
Screens from real, in-market apps, tracked by Lazyweb Research.
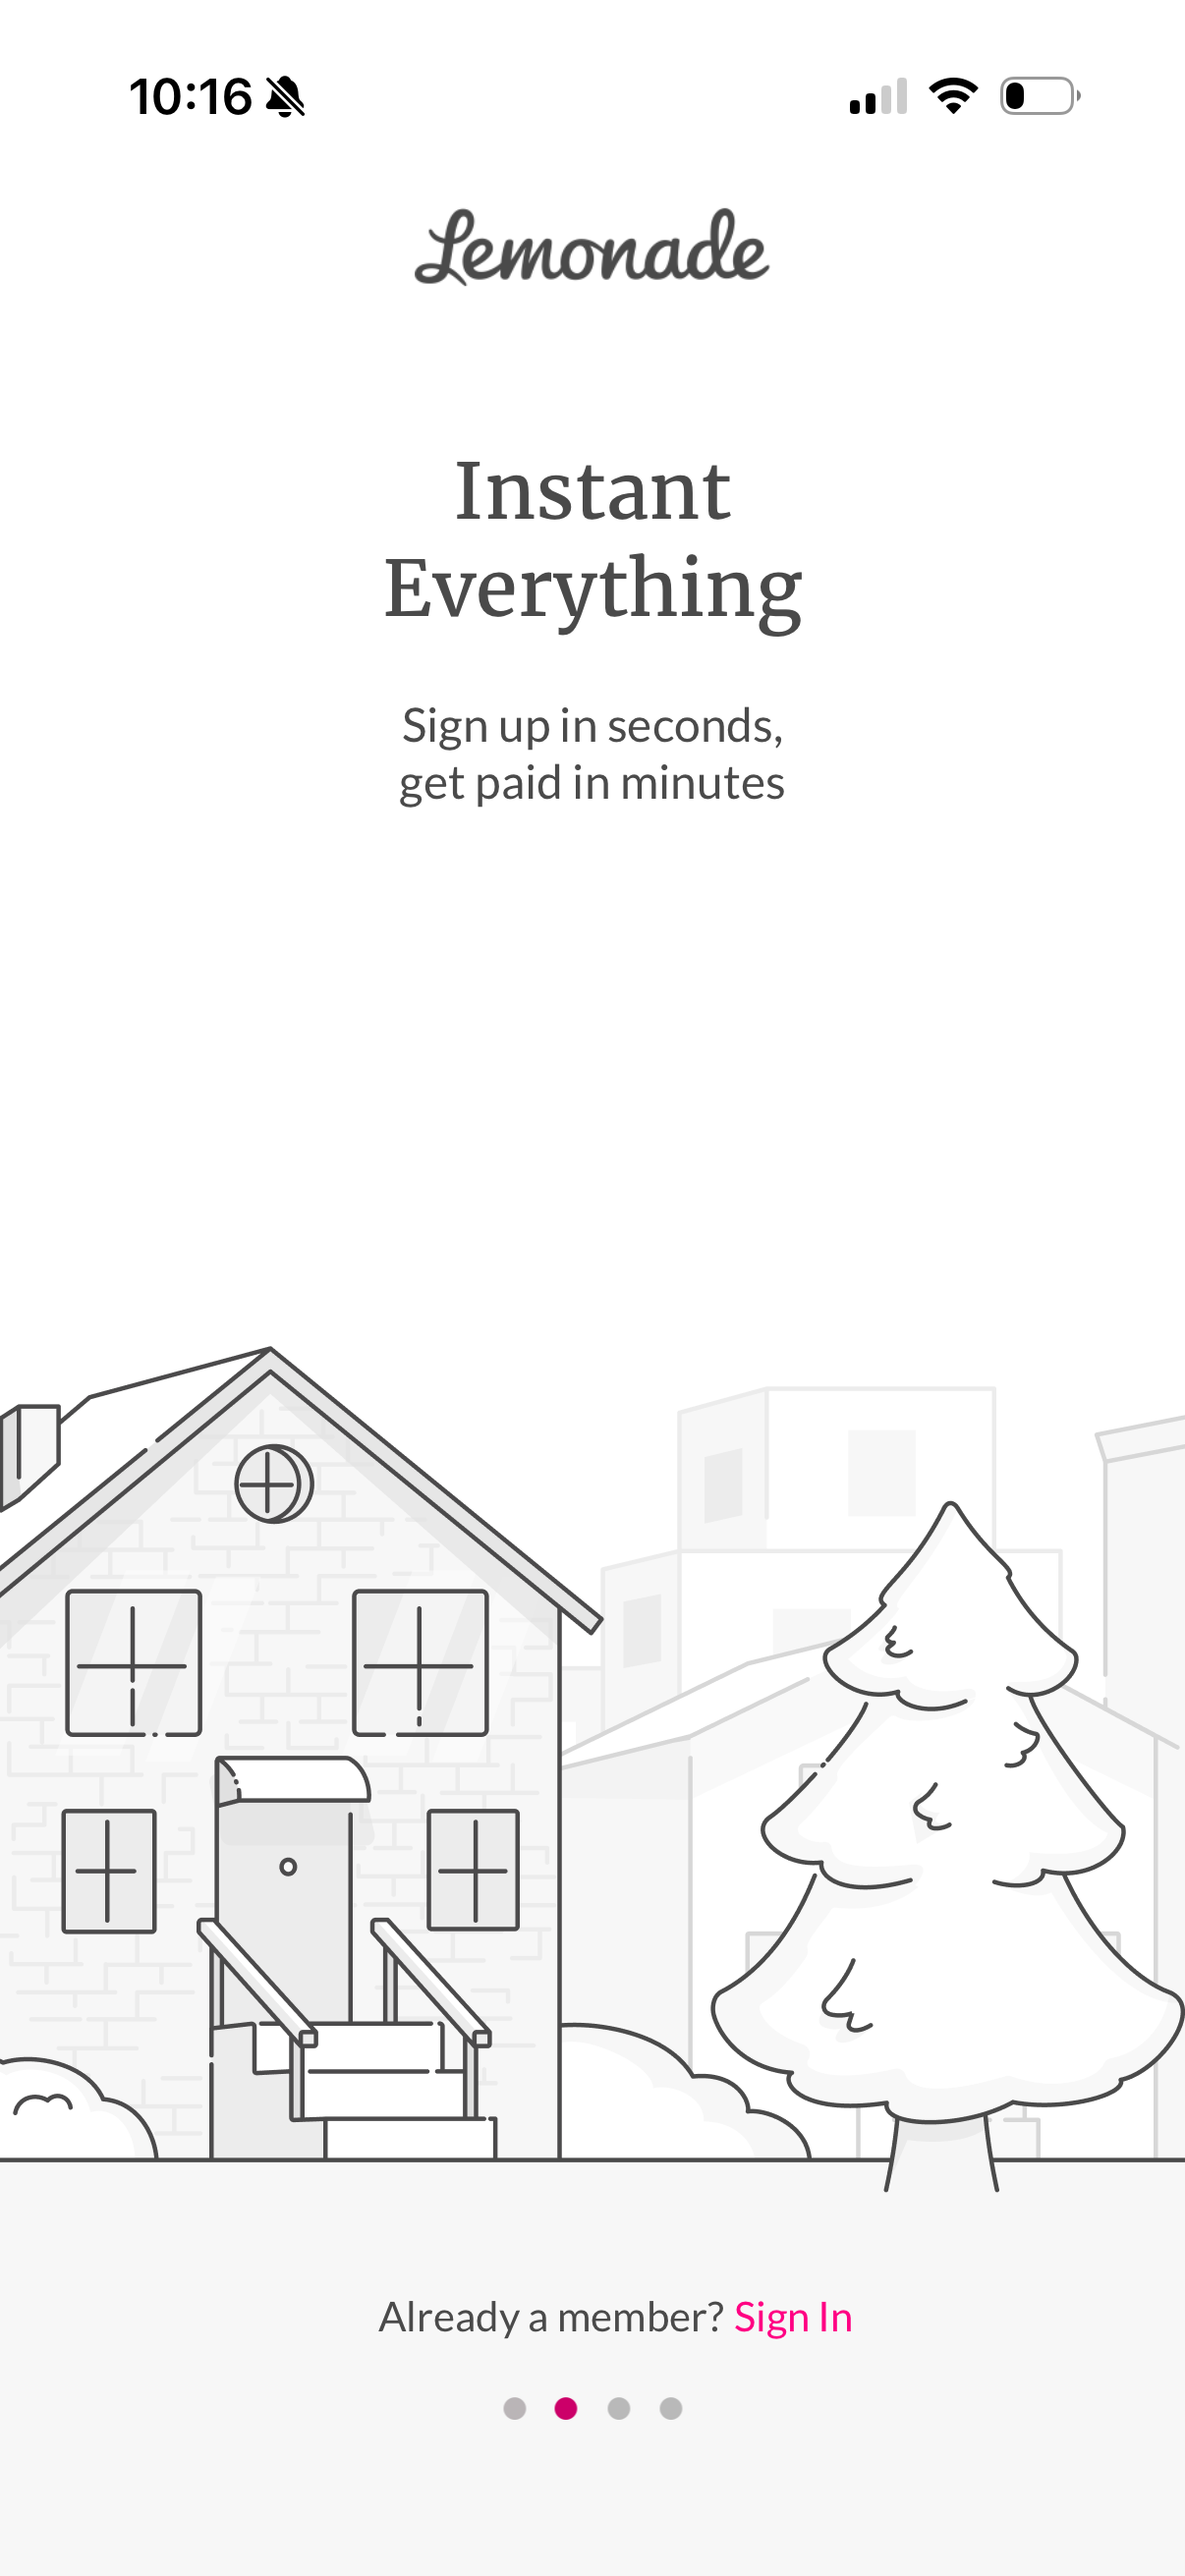
Lemonade1206 × 2622opens the full image 
Alias1206 × 2622opens the full image 
Bofa1179 × 2556opens the full image 
Snorelab1206 × 2622opens the full image
The numbers
| # | Stat | Computed from |
|---|---|---|
| [1] | Social Networking 20/40 (50%), Health & Fitness 28/56 (50%), Travel 17/41 (42%), Education 14/37 (38%), Food & Drink 10/27 (37%), Finance 15/47 (32%), Lifestyle 11/35 (31%), Shopping 12/44 (27%), Productivity 10/64 (16%), News 6/46 (13%) | referral_by_category |
| [2] | 205 of 809 apps (25.3%) overall have a referral surface | prevalence_referral_invite |
| [3] | Universe 809 apps; per-vertical cuts n>=20 | universe_denominators |
Methodology
Universe: 809 mobile apps; per-vertical cuts limited to n>=20 apps. Method: referral/invite tag match deduped by company per category, July 2026. Caveat: lower bound.
Sources
- [1]
Lazyweb Research analysis of 809 mobile apps (apps with >=1 captured screenshot), July 2026
Per-vertical bool_or of referral/invite tags; denominators apps-with-screens per category, n>=20.
- [2]
Lazyweb Research analysis of 809 mobile apps (apps with >=1 captured screenshot), July 2026
205 distinct companies with a referral/invite tag match over 809.
- [3]
Lazyweb Research analysis of 809 mobile apps (apps with >=1 captured screenshot), July 2026
Lower bound; verticals below 20 apps excluded.
Source: Lazyweb Research — proprietary analysis of real, in-market app screens. Cite as Lazyweb Research, 2026-07-07.