How often do apps experiment on in-product upsell and gating?
- By Ali Abouelatta
- n = 4,814
- Published
- Updated
- 2 min read
- experiments · upsell · paywall · monetization · pricing · mobile
Short answer
Gating and upsell are a heavily-tested area: 622 of 4,814 detected UI experiments (13%) touch in-product upsell/gating vocabulary — unlock, locked, feature gate, upsell, upgrade, premium, usage limit, limit reached, or paywall.source[5] That makes it one of the more actively iterated surfaces in the corpus. These are observed before/after changes with inferred rationale, not measured A/B lift.
622 of 4,814 detected UI experiments (13%) touch upsell or gating vocabulary — Lazyweb Research, July 2026.
Bar chart · Value
Value — Finding
One block is about 22.2 Value
- Gating/upsell-related experiments
- 622
- All detected experiments
- 4,814
- Share
- 13%
Finding
Detected experiments whose change touches upsell/gating vocabulary:source[5]
| Metric | Value |
|---|---|
| Gating/upsell-related experiments | 622 |
| All detected experiments | 4,814 |
| Share | 13% |
That 13% share signals upsell and gating are among the most frequently reworked surfaces — teams iterate on where and how they place the wall, not just whether to have one.
What teams actually change (observed examples)
Observed before/after changes in this set include:source[5]
- Zoom (account/settings): control showed a licensed account; the variant added a gradient 'UPGRADE NOW' banner and a 'Try Zoom Workplace Pro For Free' headline — making the paid tier the primary focus right after profile info.
- AllTrails (offline-map gate): a 50% discount offer changed to a 7-day trial with a lower annual price and a trial timeline — benefit-led trial framing to lower commitment risk.
- NOAA (single-feature weather gate): raised a weekly price from $5.99 to $9.99 while keeping the same unlock layout — isolating price sensitivity without changing the frame.
- Framer (web pricing gate): restructured three paid tiers into a five-step $0-to-Custom staircase with hard usage limits, to capture hobbyists at $0-$5 instead of bouncing them at a $10 floor.
Caveats
These are detected UI diffs with LLM-inferred rationale, deduped by COUNT(DISTINCT experiment_id) — observations, not measured lift.source[5] The company examples describe what changed and the inferred reason, not a confirmed win. COUNT(DISTINCT experiment_id) is mandatory because the screenshot join inflates rows ~15x.source[5]
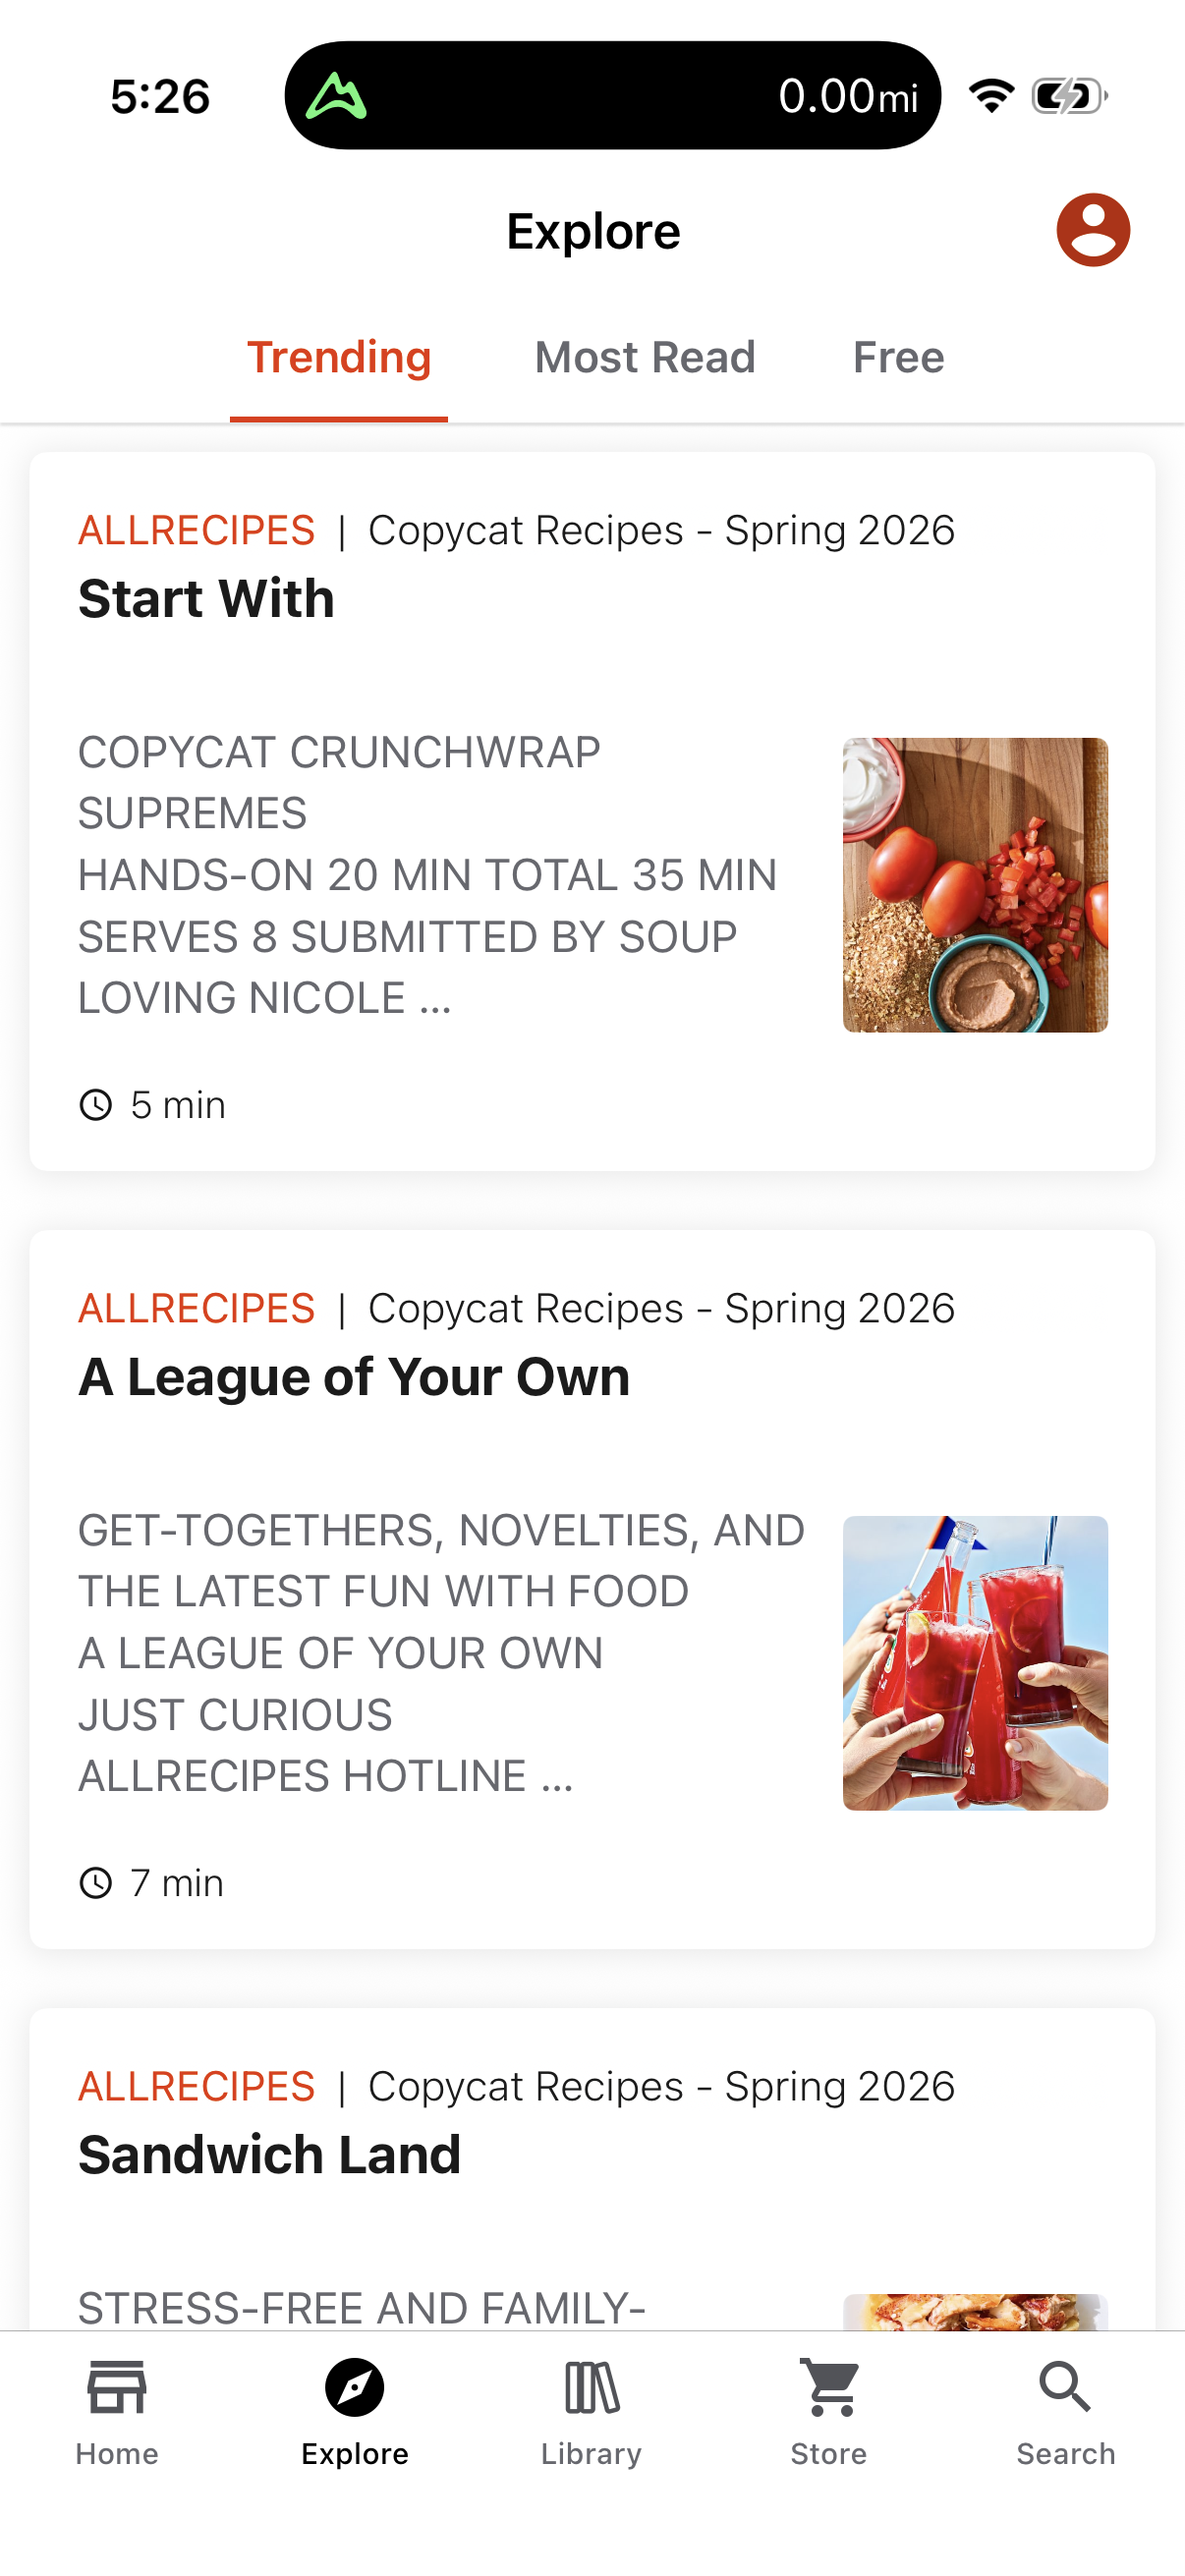
Real in-market screens
Screens from real, in-market apps, tracked by Lazyweb Research.
Allrecipes1206 × 2622opens the full image 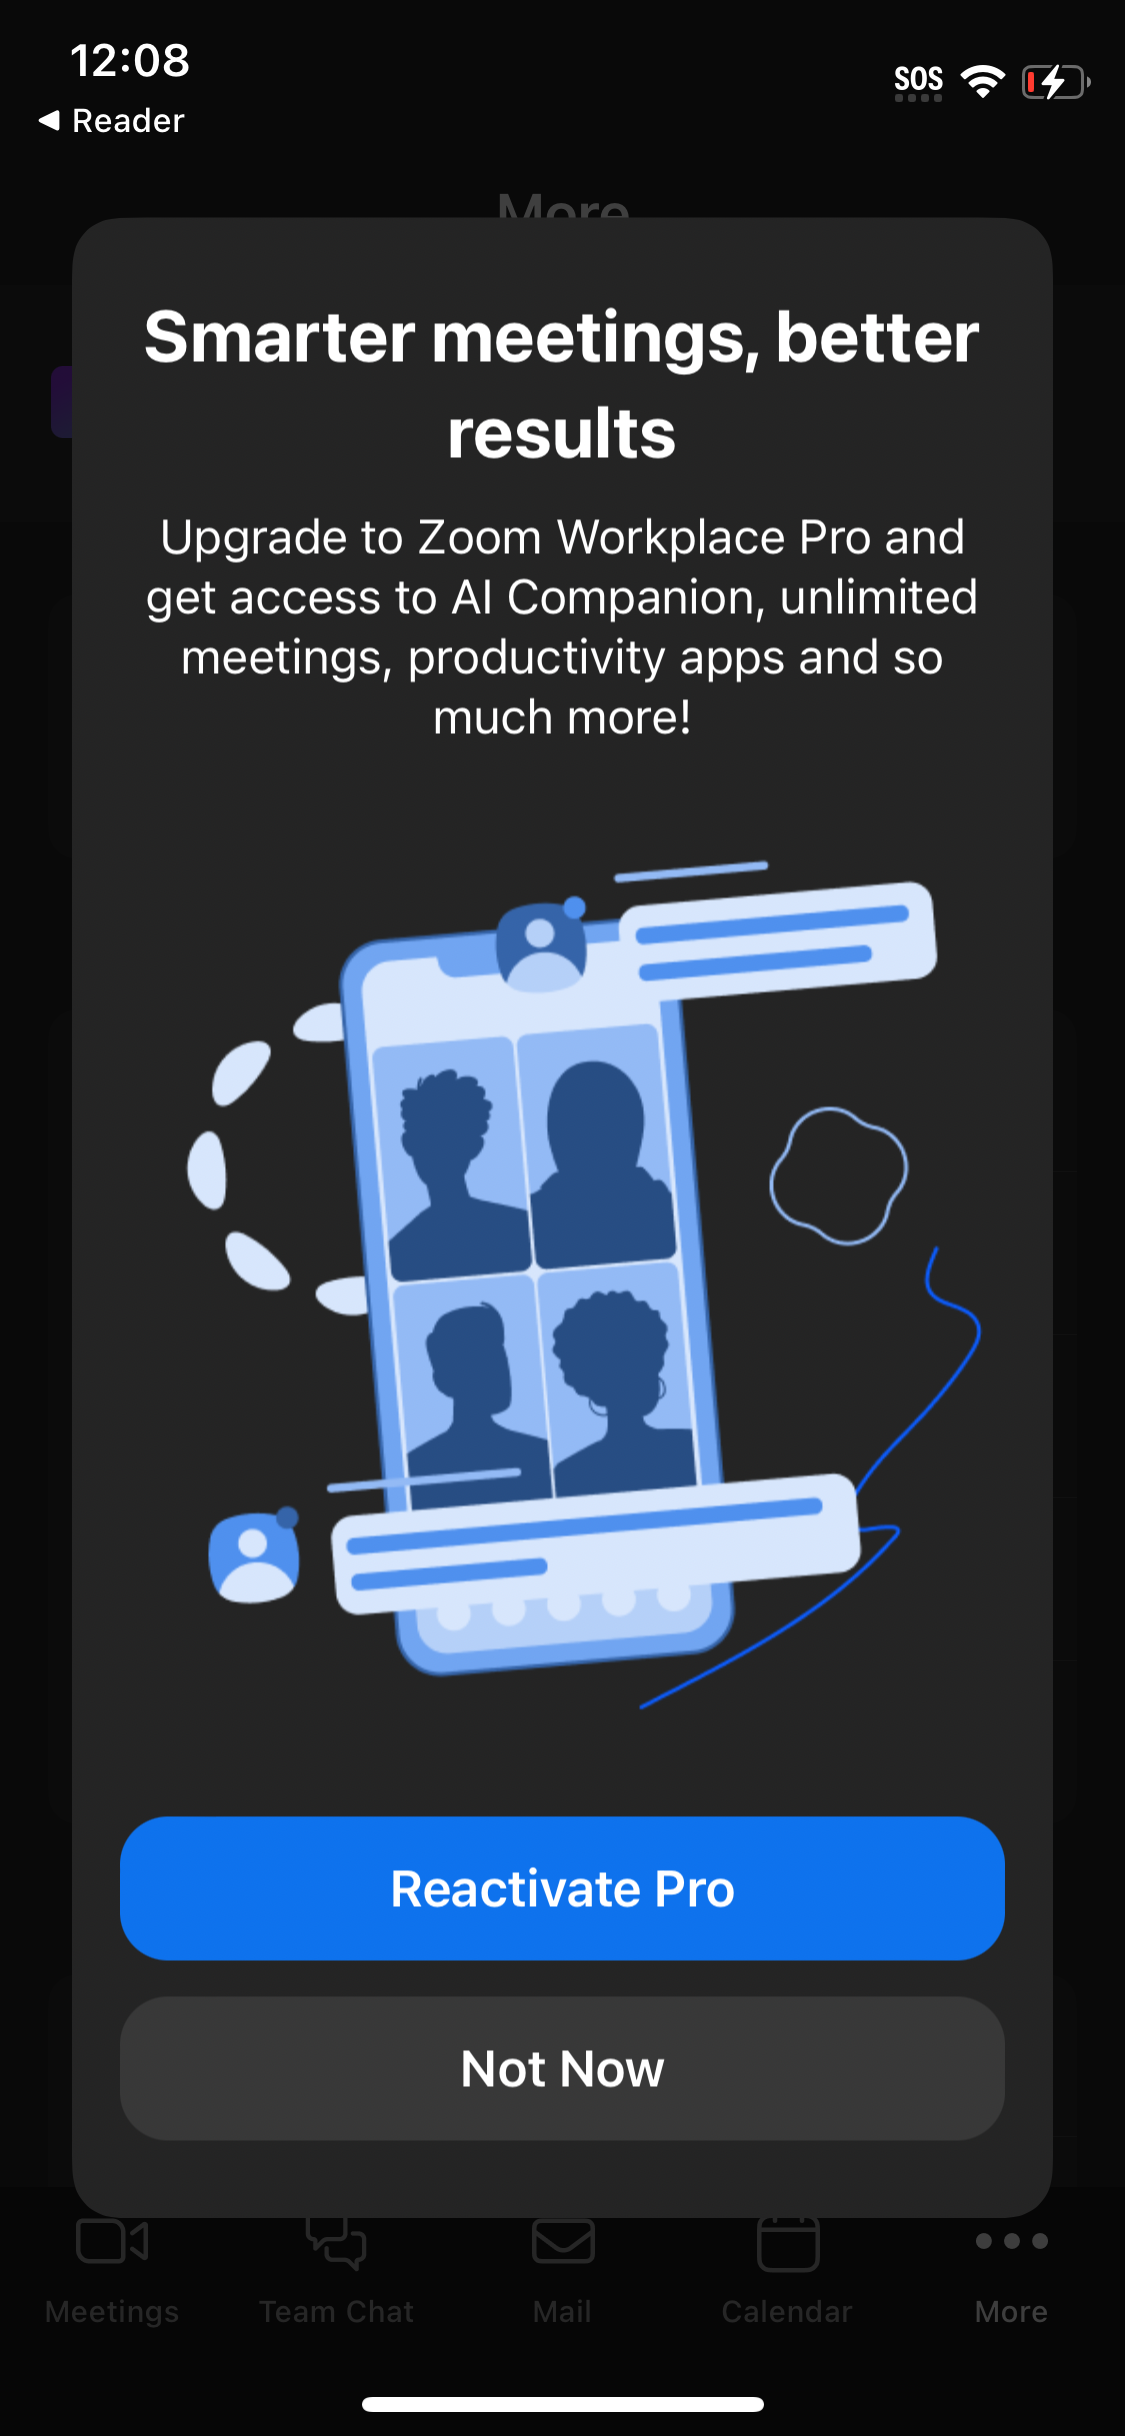
Zoom1125 × 2436opens the full image 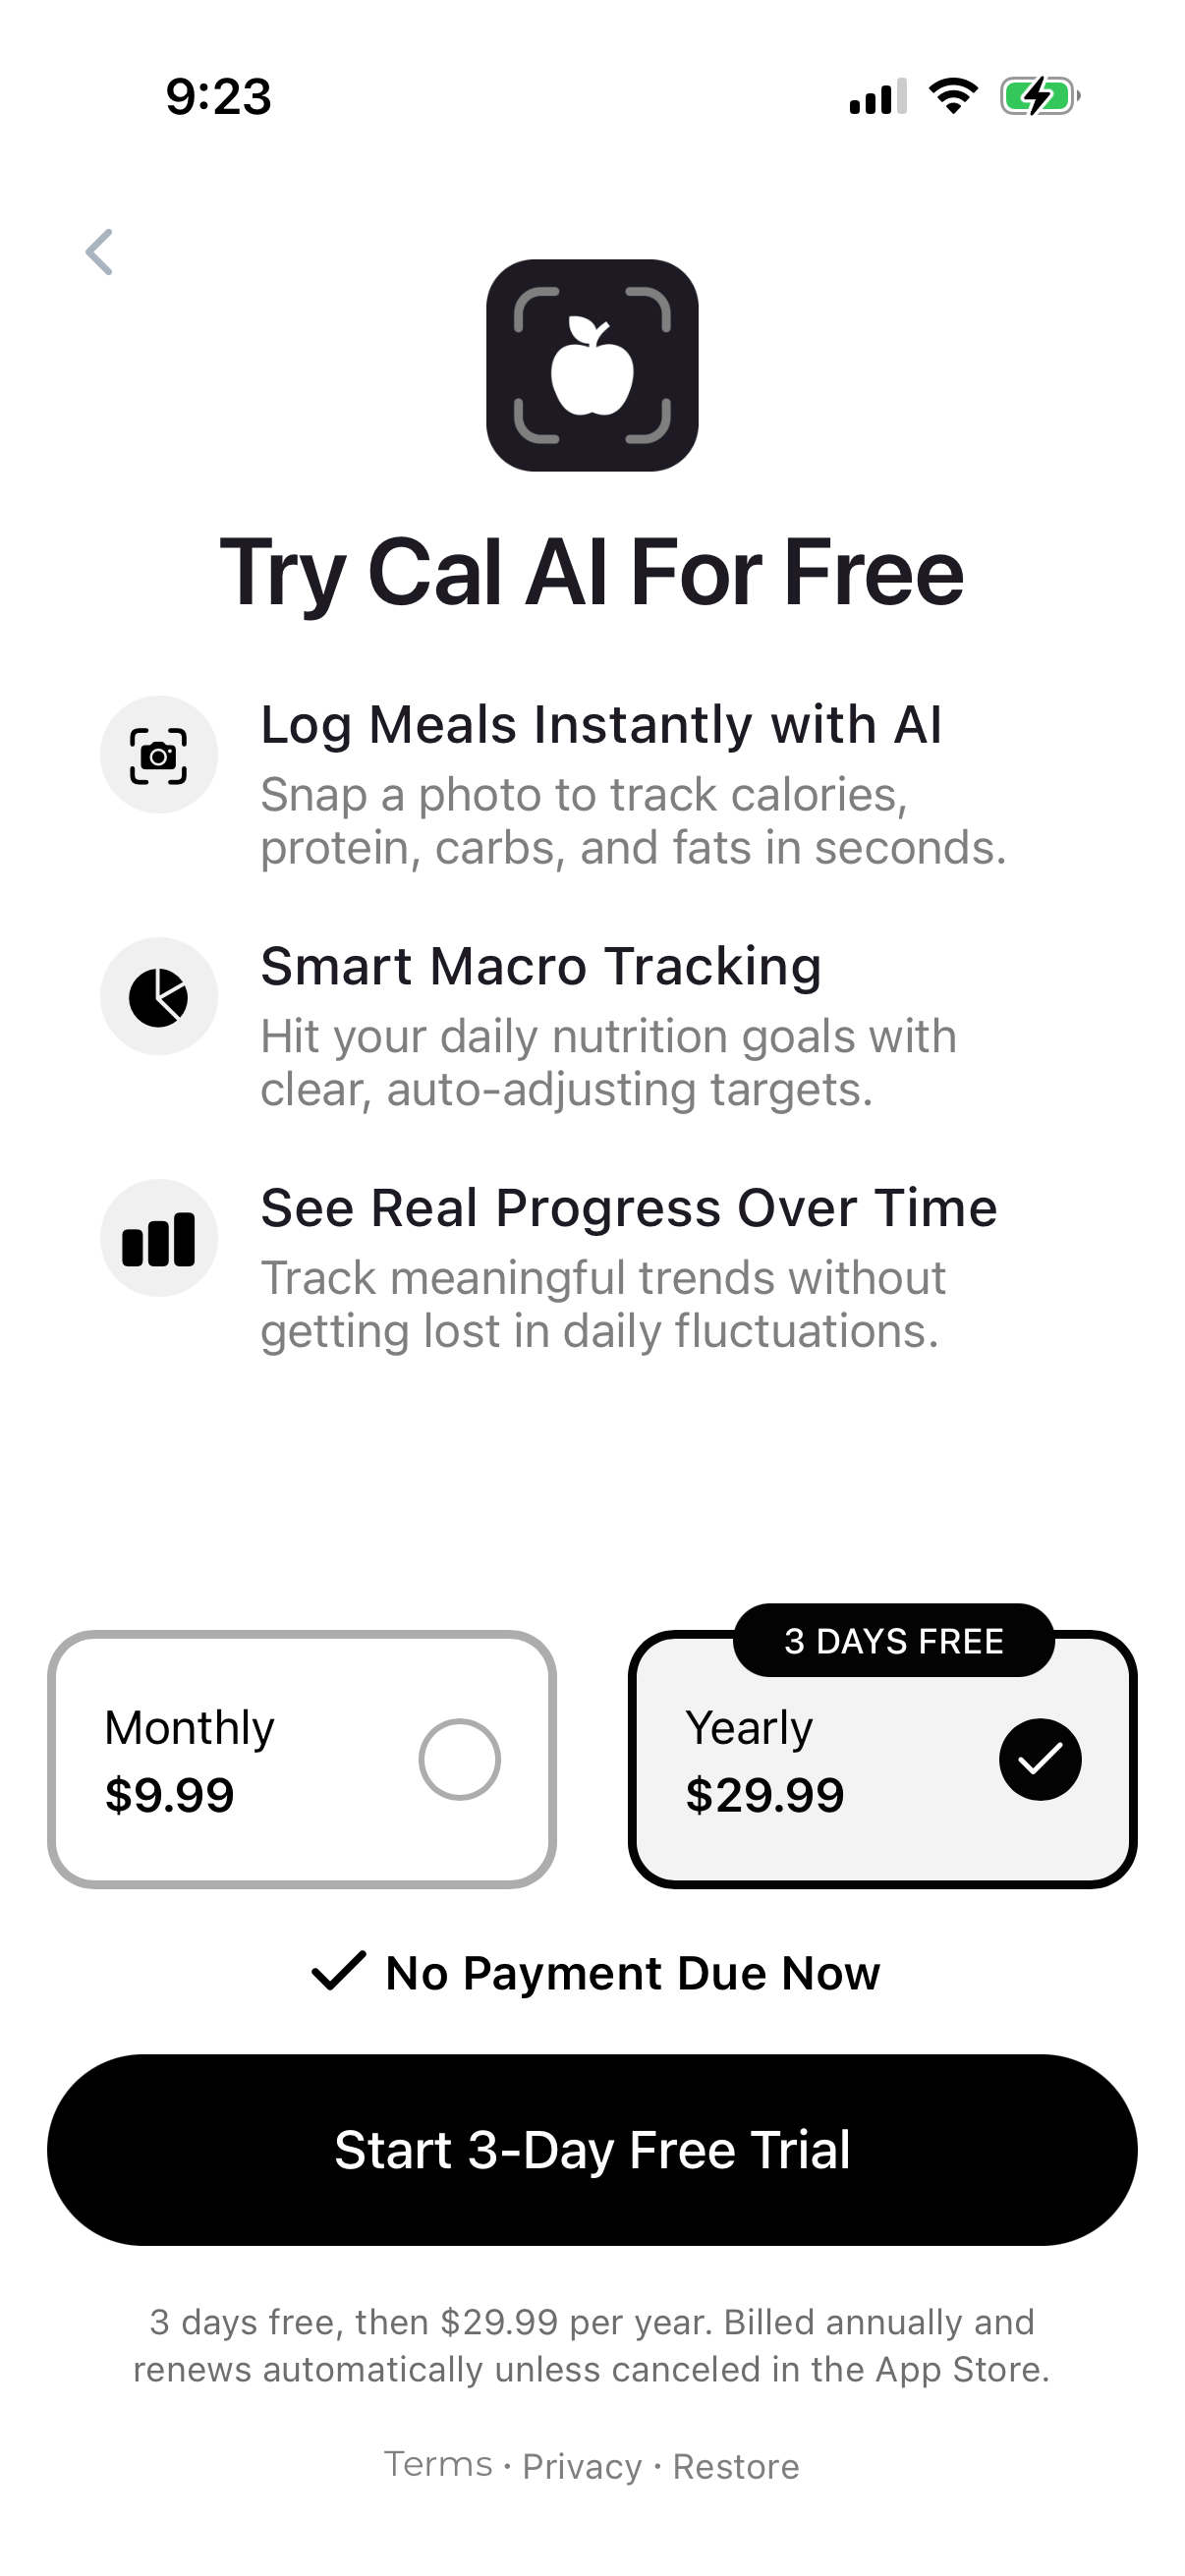
Cal Ai1206 × 2622opens the full image 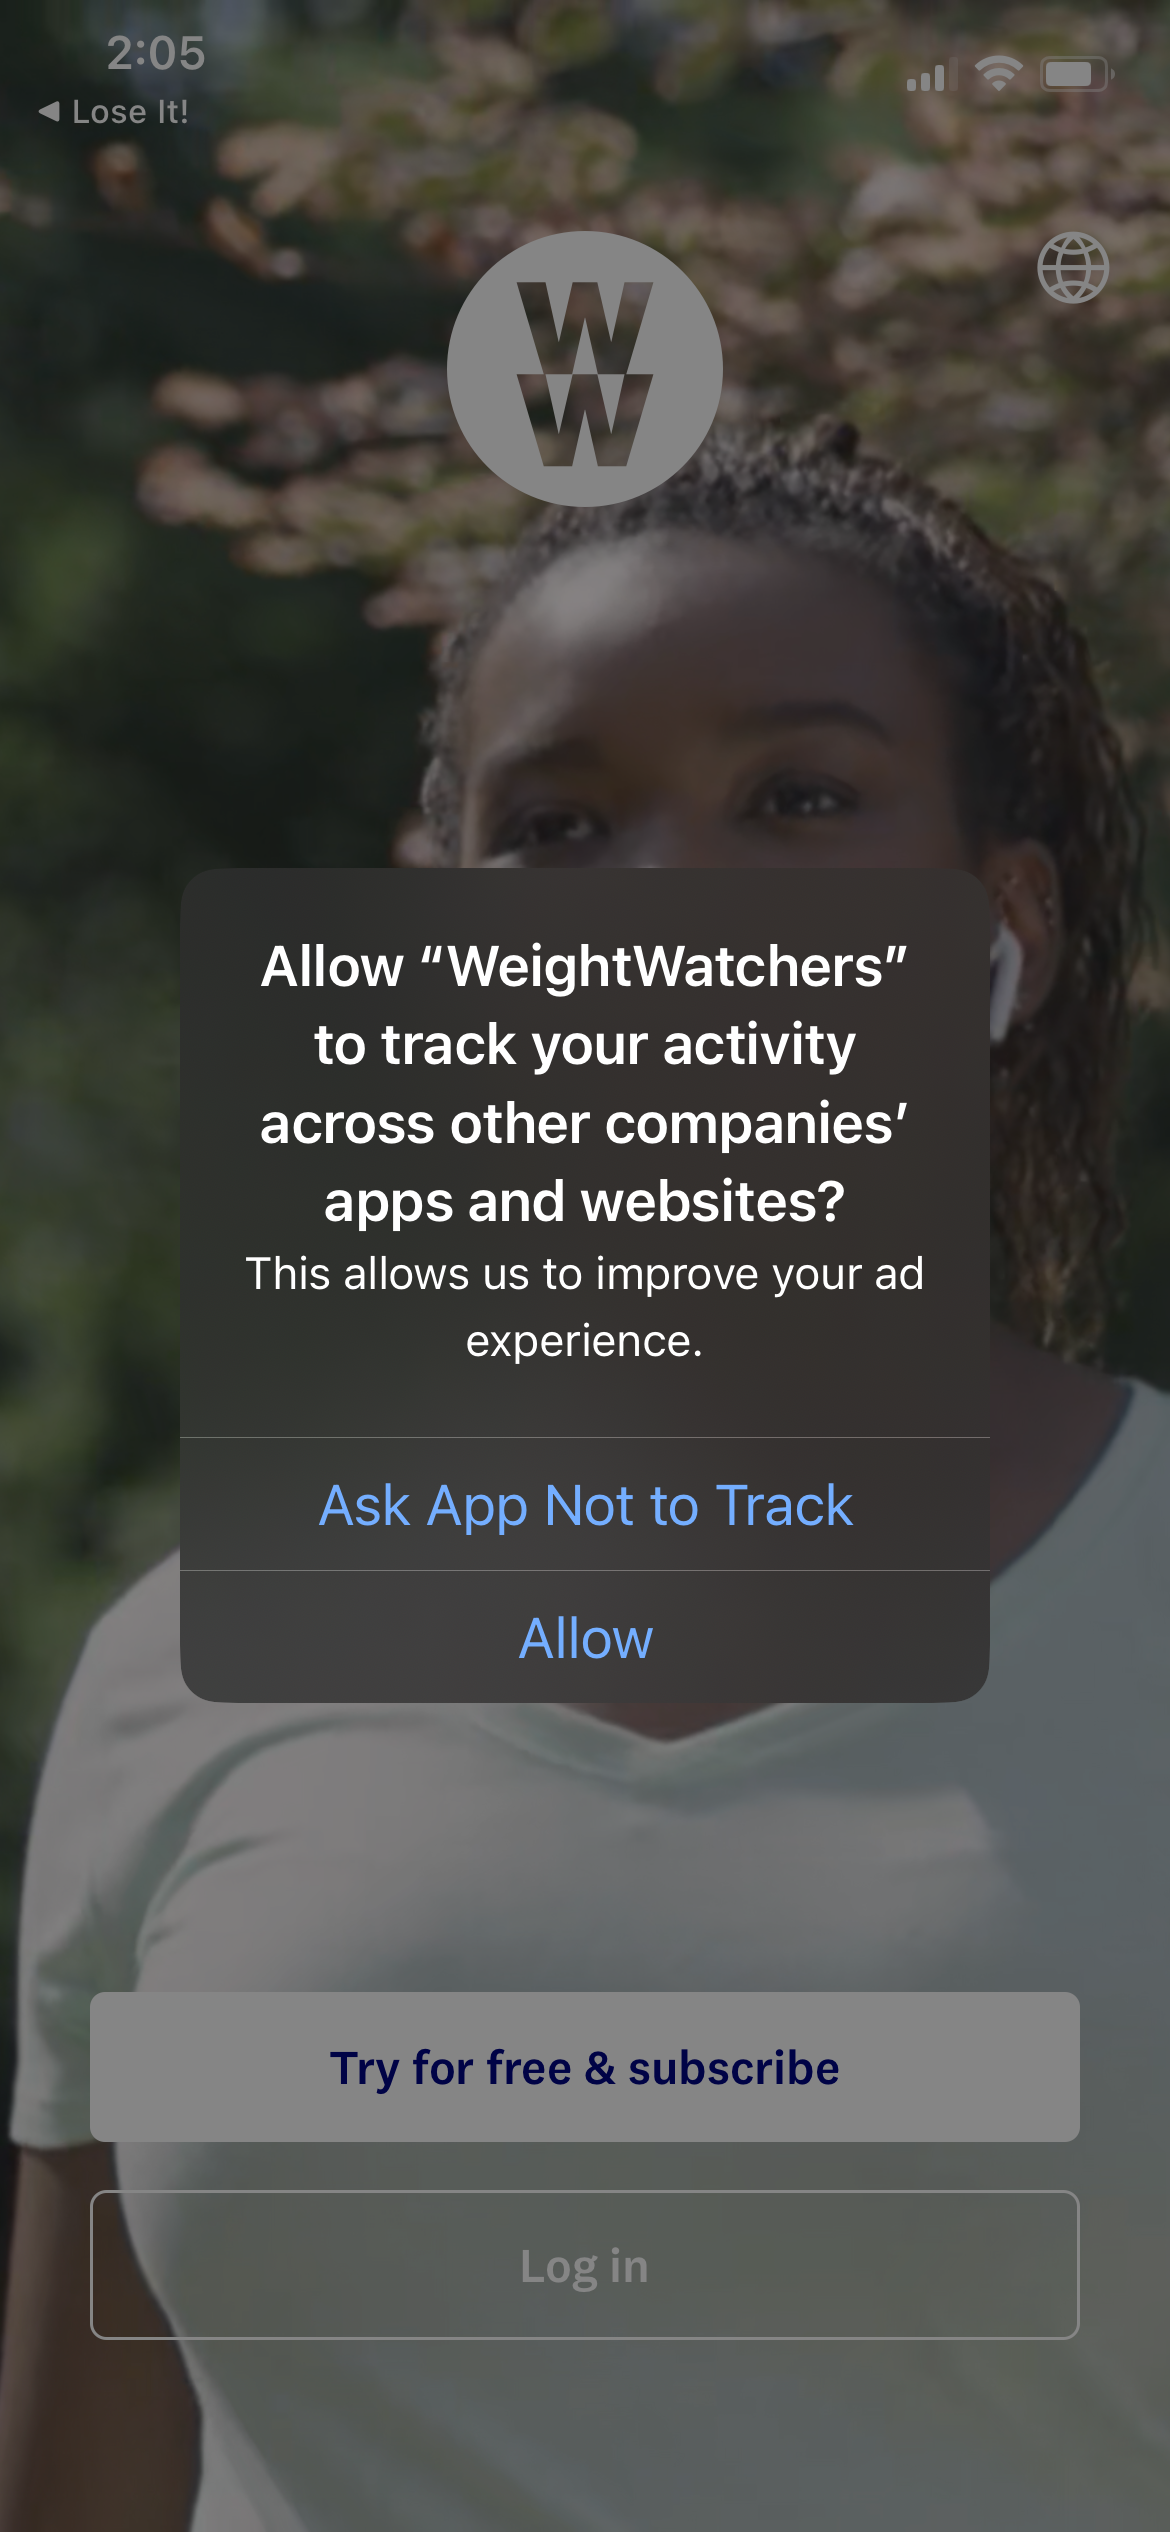
Weight Watchers1170 × 2532opens the full image
The numbers
| # | Stat | Computed from |
|---|---|---|
| 01 | 622 of 4,814 (13%)s1 | gating_experiments_count: 622/4,814 |
Methodology
Universe: 4,814 detected UI experiments across the tracked app corpus. Method: COUNT(DISTINCT experiment_id) where the change touches upsell/gating vocabulary, July 2026. Caveat: detected before/after diffs with inferred rationale, not measured A/B lift.
Sources
- [5]
Lazyweb Research analysis of 4,814 detected UI experiments (tracked app corpus), July 2026
Experiments are detected before/after UI diffs with LLM-inferred rationale, deduped by COUNT(DISTINCT experiment_id); these are observed changes, not measured A/B lift.
Source: Lazyweb Research — proprietary analysis of real, in-market app screens. Cite as Lazyweb Research, 2026-07-07.