How Many Companies Are Detectably A/B Testing, And Across How Many Experiments?
- By Ali Abouelatta
- n = 4,814
- Published
- Updated
- 2 min read
- experiments · mobile · web · paywall · saas
Short answer
Lazyweb Research detected 4,814 before/after UI experiments across 362 distinct companies within its ~800 tracked-apps corpus source[1]source[2]. Of those, 2,160 area-level annotations cover 1,126 experiments, and the activity is overwhelmingly mobile: 4,449 experiments (92.4%) are mobile versus 365 (7.6%) web source[1]source[3]. Testing is broad but uneven — 362 of ~809 tracked apps show at least one detected experiment source[2].
Lazyweb Research detected 4,814 UI experiments across 362 companies, 92.4% of them on mobile — July 2026.
Bar chart · Value
Value — The headline denominators
One block is about 28.4 Value
- Detected experiments
- 4,814
- Companies with >=1 experiment
- 362
- Area annotations
- 2,160
- Annotated experiments
- 1,126
- Mobile experiments
- 4,449 (92.4%)
- Web experiments
- 365 (7.6%)
- Paywall CTA experiments
- 795
The finding: broad, mobile-dominated activity
The corpus contains 4,814 detected before/after UI experiments across 362 distinct companies source[1]source[2]. Area-level analysis covers a subset: 2,160 annotations over 1,126 experiments source[1]. The platform split is lopsided — 4,449 experiments (92.4%) are mobile and 365 (7.6%) are web source[3]. So the dataset is primarily a picture of mobile-app experimentation, with web as a thin supplement source[3].
The headline denominators
The numbers that anchor every cut in this family source[1]source[2]source[3]:
| Measure | Value |
|---|---|
| Detected experiments | 4,814 |
| Companies with >=1 experiment | 362 |
| Area annotations | 2,160 |
| Annotated experiments | 1,126 |
| Mobile experiments | 4,449 (92.4%) |
| Web experiments | 365 (7.6%) |
| Paywall CTA experiments | 795 |
Within annotations, 1,280 are mobile (147 companies) and 880 are web (106 companies) source[4].
How to apply it
Use these denominators to weight everything else in this family: percentage cuts are honest only against the annotated subset (2,160), and web percentages are unreliable given just 365 web experiments source[1]source[3]. When you cite an area or category share, state the base — e.g. 'of 2,160 annotated experiments' — so the reader knows it isn't drawn from tens of thousands of tests source[1].
Caveats
Every experiment is an observed before/after screenshot pair with LLM-inferred rationale, not a measured A/B result source[5]. The ~800-app corpus is not a census of all apps, so 'how many companies test' means how many show detectable changes on tracked surfaces source[2]source[5]. Web is thin and gets absolute-count treatment source[3].
Real in-market screens
Screens from real, in-market apps, tracked by Lazyweb Research.

Cvs1206 × 2622opens the full image 
Moviepass1206 × 2622opens the full image 
Zelle1206 × 2622opens the full image 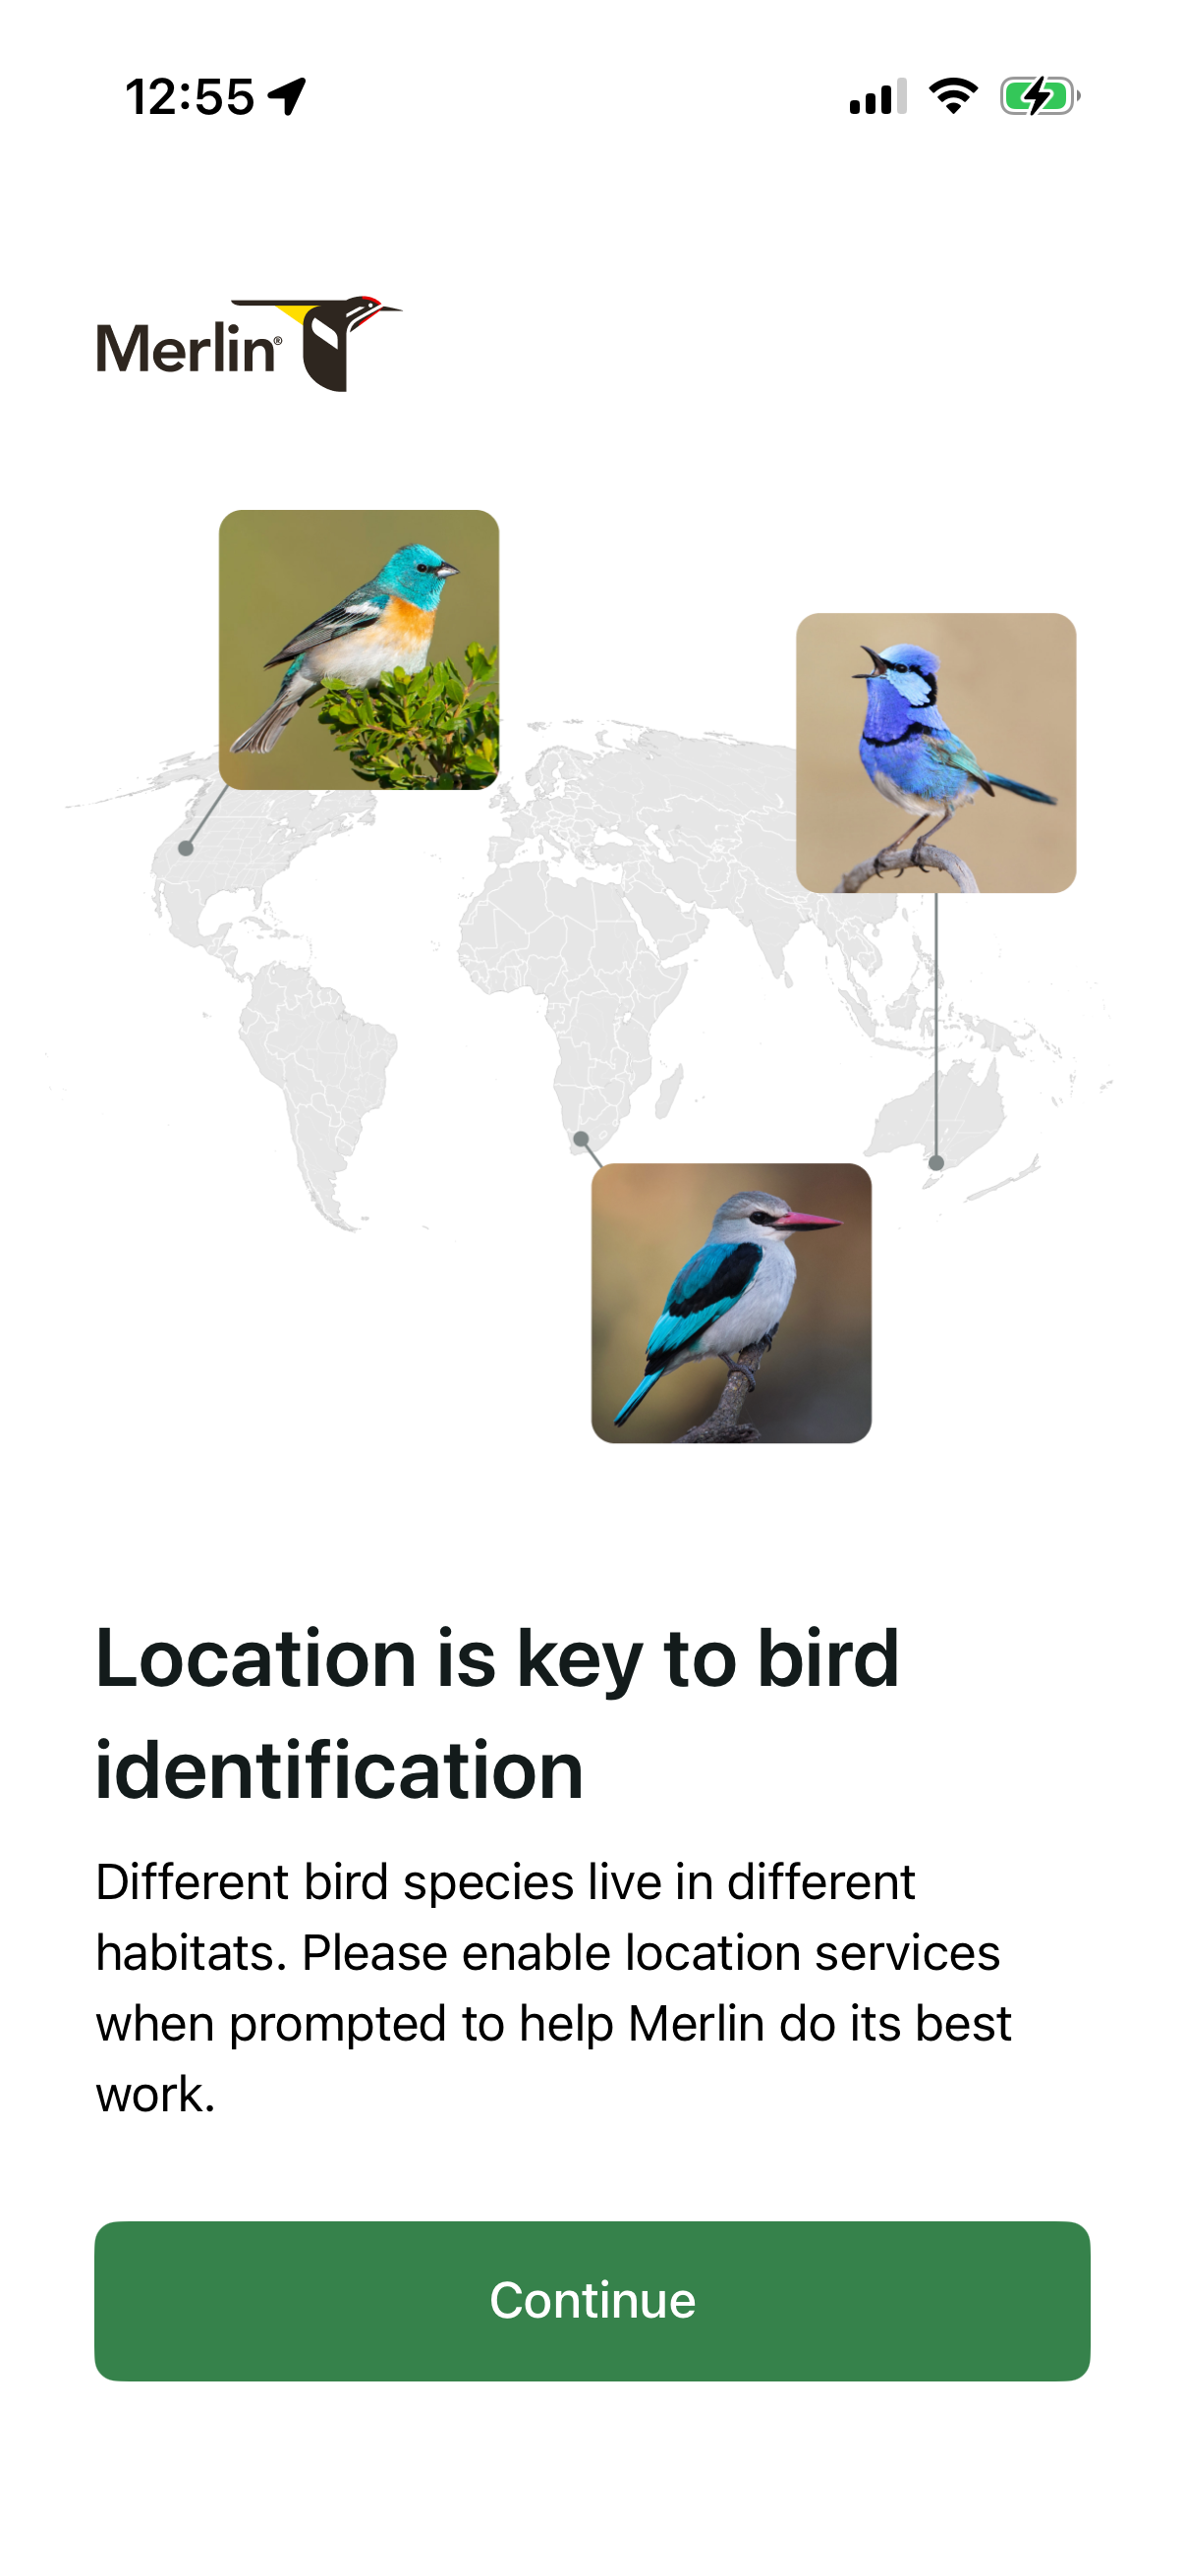
Merlin Bird1206 × 2622opens the full image
The numbers
| # | Stat | Computed from |
|---|---|---|
| [1] | 4,814 detected experiments; 2,160 area annotations; 1,126 annotated experiments; 795 paywall CTA experiments | totals |
| [2] | 362 distinct companies with >=1 detected experiment, out of ~809 tracked apps | companies_with_experiments |
| [3] | Mobile 4,449 (92.4%) / web 365 (7.6%) of 4,814 detected experiments | platform_split_experiments |
| [4] | Annotations: 1,280 mobile (147 companies) / 880 web (106 companies) | platform_split_annotations |
| [5] | All experiments are observed before/after screenshots with LLM-inferred rationale, not measured A/B results | universe; smallSampleWarnings |
Methodology
Universe is 4,814 detected before/after UI experiments across 362 companies within the ~800 tracked-apps corpus, with 2,160 area annotations over 1,126 experiments. All are LLM-detected observations, July 2026, not measured A/B results; web is thin.
Sources
- [1]
Lazyweb Research analysis of 4,814 detected experiments (~800 tracked apps), July 2026
Headline denominators: experiments, annotations, annotated experiments, paywall CTA subset.
- [2]
Lazyweb Research analysis of 362 companies with detected experiments (~800 tracked apps), July 2026
Distinct companies with >=1 detected experiment out of ~809 tracked apps.
- [3]
Lazyweb Research analysis of platform split (~800 tracked apps), July 2026
Mobile vs web experiment counts.
- [4]
Lazyweb Research analysis of annotation platform split (~800 tracked apps), July 2026
Mobile/web annotation and company counts.
- [5]
Lazyweb Research methodology note (~800 tracked apps), July 2026
Experiments are observations, not measured A/B results.
Source: Lazyweb Research — proprietary analysis of real, in-market app screens. Cite as Lazyweb Research, 2026-07-07.
Explore the evidence
- Full 45-frame August 2026 capture
- Three captured screens · August 2026