Which App Categories Ask for Notification Permission Most?
- By Ali Abouelatta
- n = 96
- Published
- Updated
- 2 min read
- notifications · mobile · onboarding · saas
Short answer
Among 96 apps with a notification-category screen in Lazyweb Research's corpus, travel and shopping lead with 11 apps each, followed by health & fitness (10) and news (8) source[1]. Every vertical count is small, so these are absolute company counts, not rates. Commerce and content-heavy categories dominate the captured notification asks.
Travel and shopping tie as the categories with the most notification-asking apps — 11 each of 96 — Lazyweb Research, July 2026.
Bar chart · Apps
Apps — The finding
One block is about 0.4 Apps
- Travel
- 11
- Shopping
- 11
- Health & Fitness
- 10
- News
- 8
- Education
- 7
- Navigation
- 5
- Food & Drink
- 5
- Social Networking
- 4
- Finance
- 4
The finding
Notification-asking apps by category, absolute counts only (percentages are not defensible — every vertical is far below the reporting threshold) source[1]:
| Category | Apps |
|---|---|
| Travel | 11 |
| Shopping | 11 |
| Health & Fitness | 10 |
| News | 8 |
| Education | 7 |
| Navigation | 5 |
| Food & Drink | 5 |
| Social Networking | 4 |
| Finance | 4 |
Travel and shopping lead, with health & fitness close behind source[1].
Why these categories
The leaders share time-sensitive, transactional notifications: travel (check-in, gate changes), shopping (order status, drops, deals), health & fitness (reminders, streaks), and news (breaking alerts). These are exactly the benefit frames that dominate priming copy — deals, updates, reminders. Fintech and Social have only 4 notification apps each, both anecdote-level source[1].
How to apply it
If you are in travel, shopping, health & fitness, or news, notification asks are well-established in your category — lean on the category-native benefit (delivery alerts, breaking news, streak reminders). If you are in a thinly represented vertical (fintech, social here), you have fewer captured peers, so borrow the framing from an adjacent transactional category.
Caveats
Every vertical cut is below the n>=70 rule — publish absolute company counts, never per-vertical percentages source[1]. Counts come from companies.category joined on lowercased company name; capture is incidental, so category totals are floors. Fintech (4) and Social (4) are anecdote-level source[1].
Real in-market screens
Screens from real, in-market apps, tracked by Lazyweb Research.
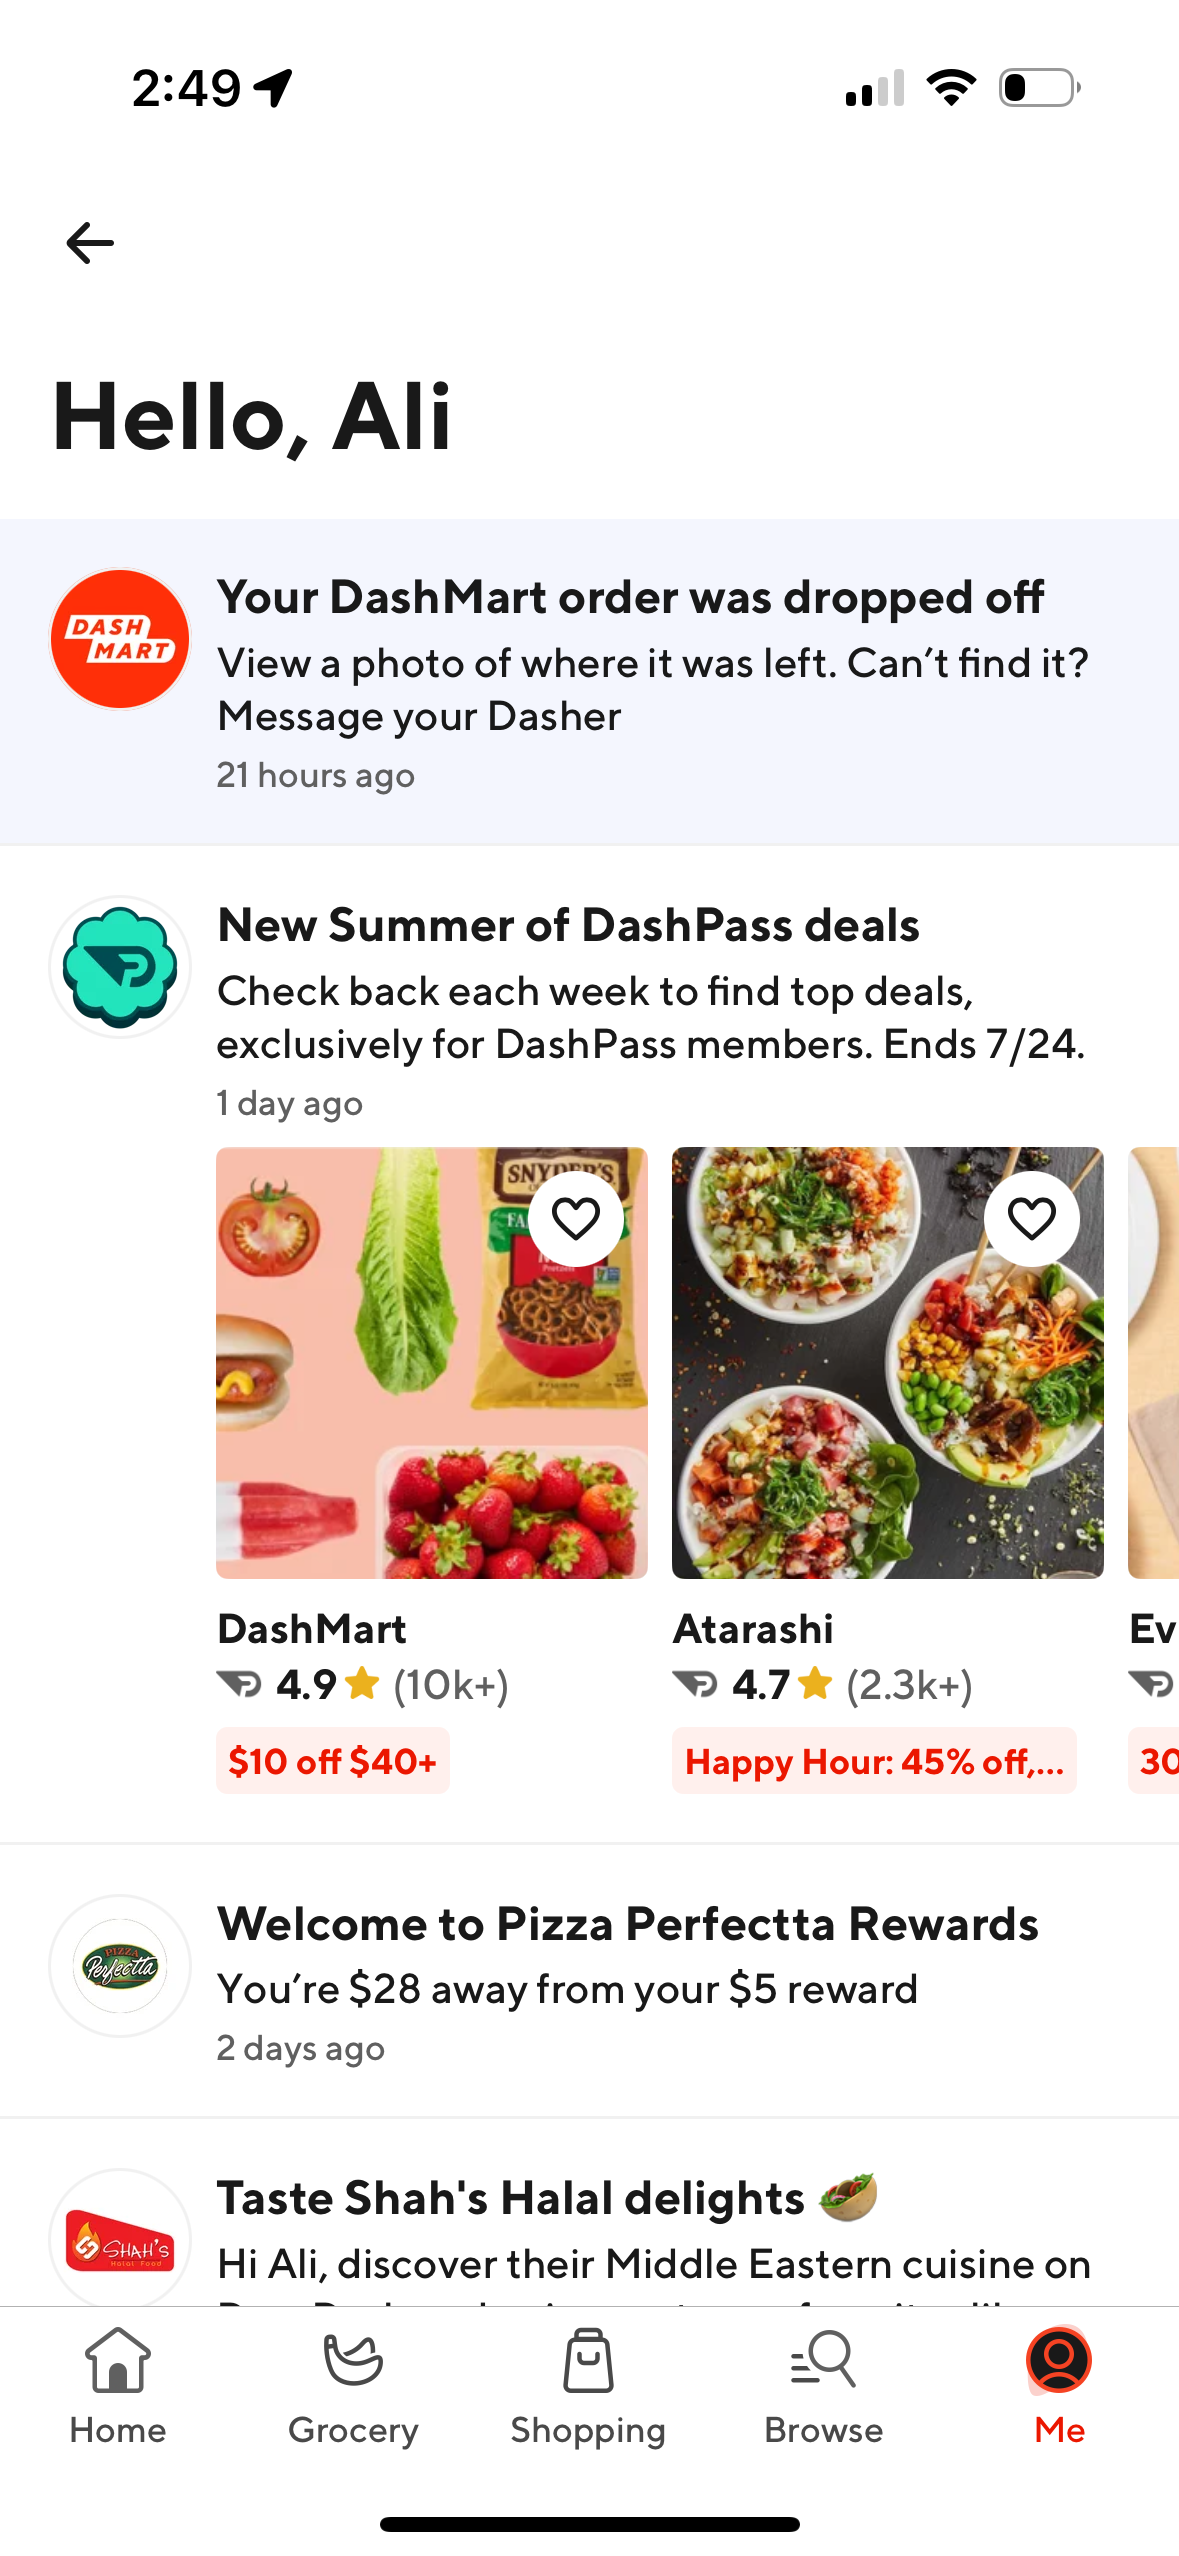
Doordash1179 × 2556opens the full image 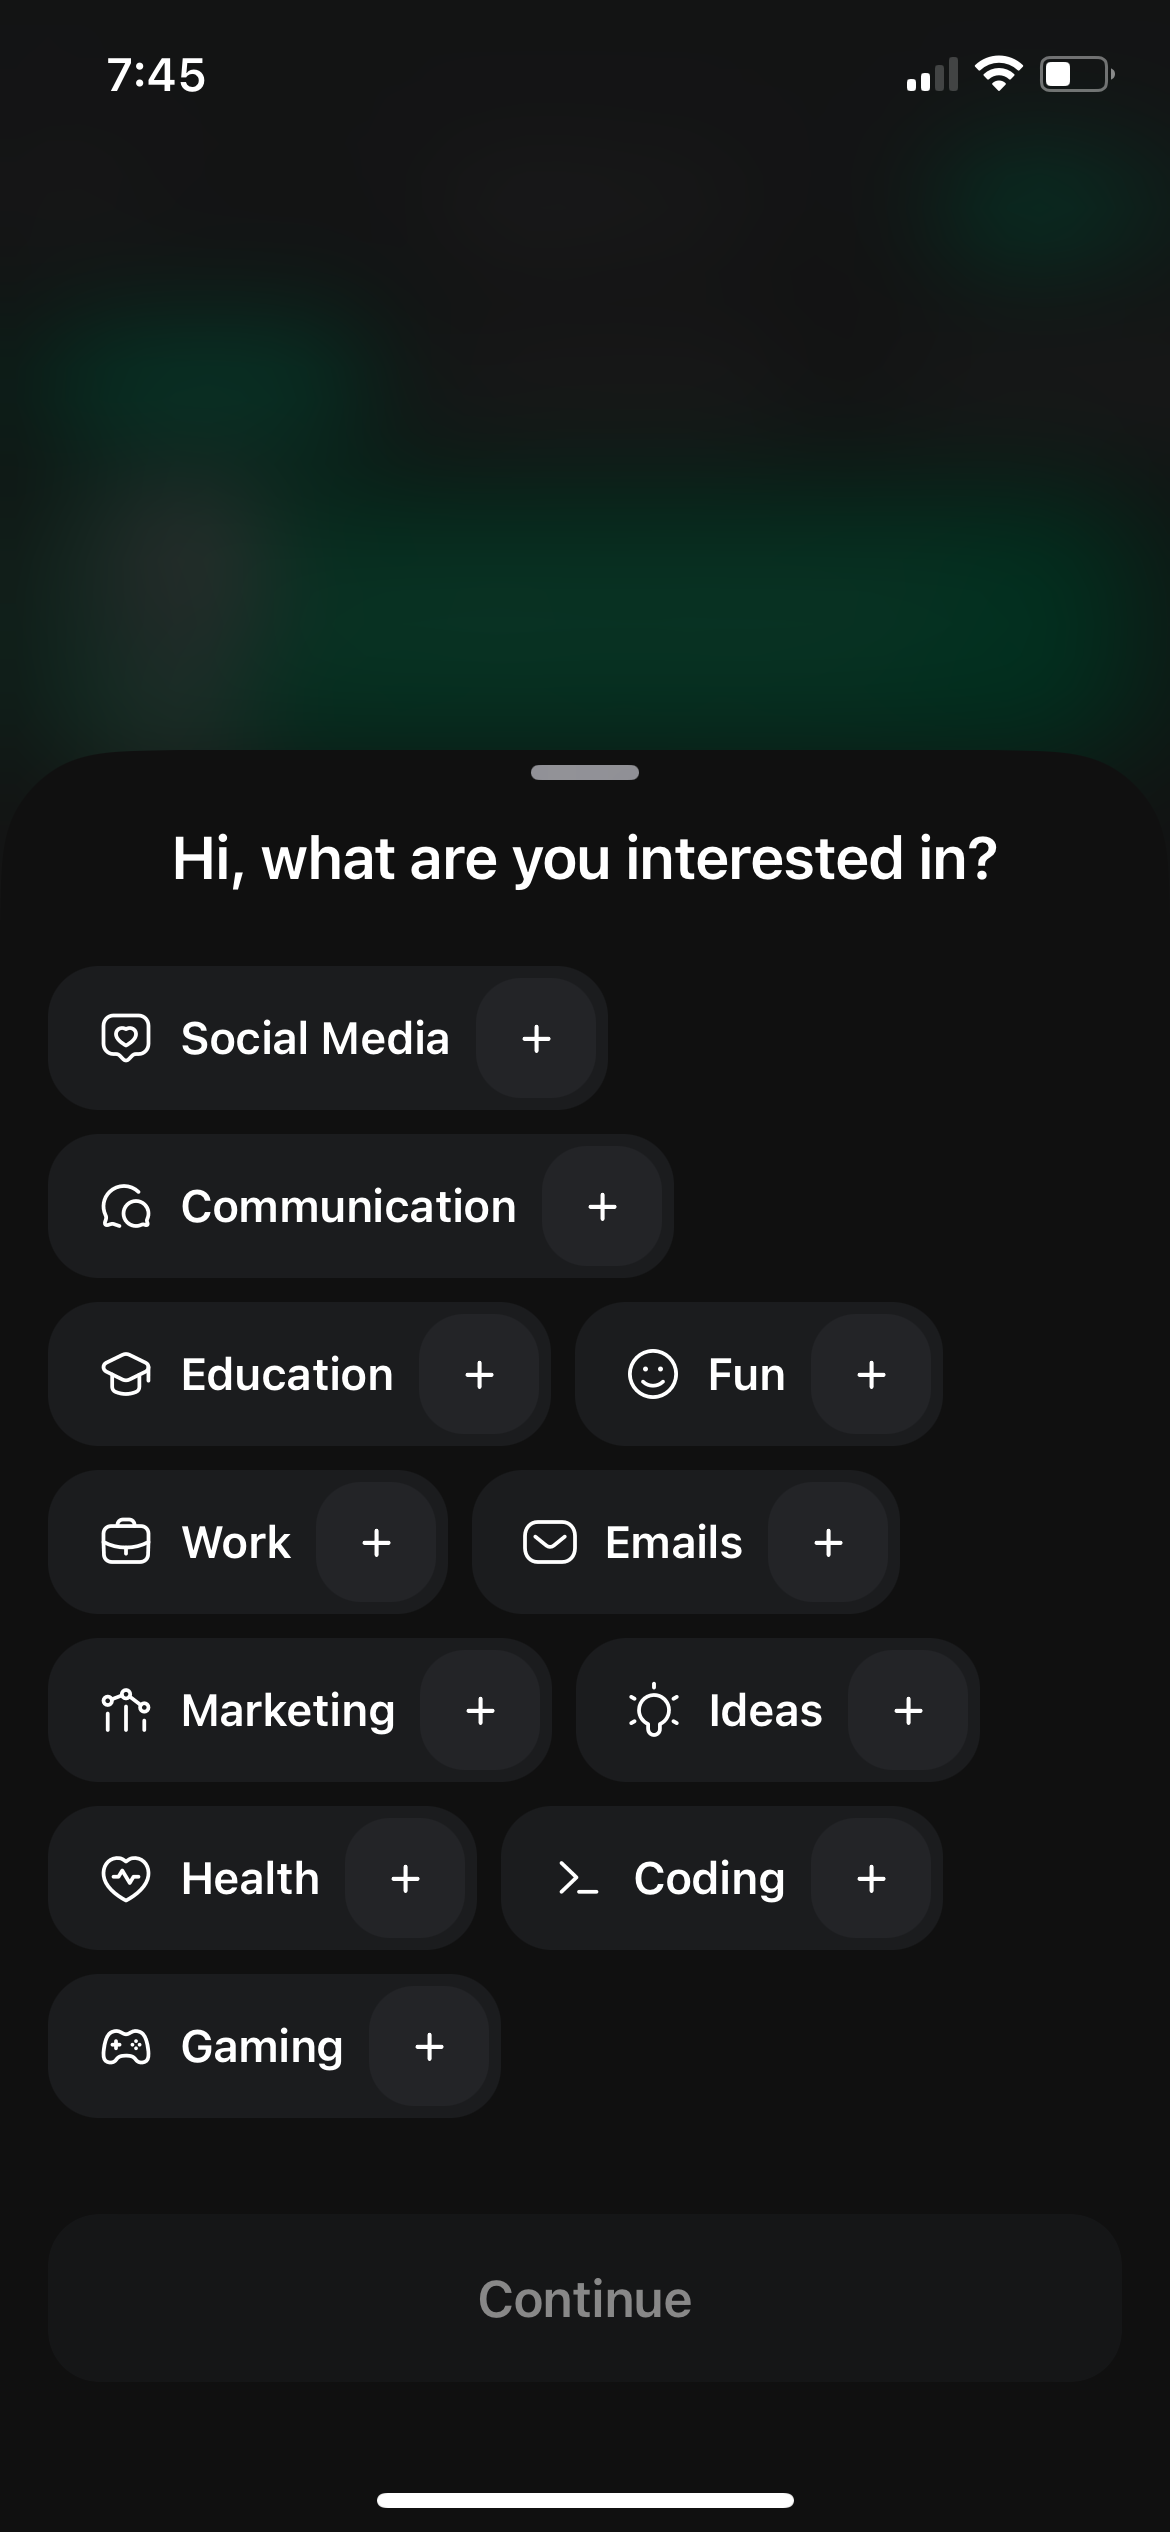
Chaton1170 × 2532opens the full image 
Discord1206 × 2622opens the full image 
Pandora1290 × 2796opens the full image
The numbers
| # | Stat | Computed from |
|---|---|---|
| [1] | travel 11, shopping 11, health & fitness 10, news 8, education 7, navigation 5, food & drink 5, social 4, finance 4 (of 96 notification companies) | notification_ask_by_vertical: COUNT(DISTINCT company) GROUP BY category, HAVING >=3 |
Methodology
Universe: 96 apps with a notification-category screen (of 807), grouped by companies.category, July 2026. All vertical Ns are small, so absolute company counts are reported and per-vertical percentages are omitted.
Sources
- [1]
Lazyweb Research analysis of 96 apps (notification-category set, 807-app corpus), July 2026
Absolute company counts per category; all verticals below the percentage threshold, so counts only.
Source: Lazyweb Research — proprietary analysis of real, in-market app screens. Cite as Lazyweb Research, 2026-07-07.