Which App Categories Ask for ATT and Location Permission Most?
- By Ali Abouelatta
- n = 45
- Published
- Updated
- 2 min read
- mobile · monetization · onboarding · saas · notifications
Short answer
Among the ATT and location apps in Lazyweb Research's corpus, shopping leads ATT asks (8 apps) while food & drink leads location asks (6 apps) source[1]. All counts are small — absolute company counts, not rates. Commerce apps drive ATT (ad personalization), and delivery/local-discovery apps drive location.
Shopping leads ATT asks (8 apps) and food & drink leads location asks (6 apps) — Lazyweb Research, July 2026.
Bar chart · Count
Count — The finding
One block is about 0.3 Count
- Shopping
- 8
- Food & Drink
- 7
- Education
- 6
- Health & Fitness
- 4
- Entertainment
- 4
The finding
By category, absolute company counts only source[1]:
| ATT companies | Count | Location companies | Count | |
|---|---|---|---|---|
| Shopping | 8 | Food & Drink | 6 | |
| Food & Drink | 7 | Navigation | 5 | |
| Education | 6 | Shopping | 4 | |
| Health & Fitness | 4 | Travel | 3 | |
| Entertainment | 4 |
Shopping and food & drink appear at the top of both lists — commerce and delivery are the permission-heavy verticals source[1].
Why these categories
ATT concentrates in commerce (shopping 8, food & drink 7) because those apps monetize via ad personalization and can honestly frame tracking as 'better deals.' Location concentrates in food & drink (6) and navigation (5) because the core value — delivery, directions, nearby results — literally requires the user's location. Fintech and Social are too small for ATT or location cuts; notification is their only defensible slice source[1].
How to apply it
Commerce apps should expect to run both an ATT ask (with a deals or personalization frame) and often a location ask. Delivery, navigation, and local-discovery apps should treat location as core-value-linked and frame it as nearby/near-you (the dominant location pattern). Match the ask to what your category's peers already do.
Caveats
All cuts are below the percentage threshold — absolute company counts only, no per-vertical rates source[1]. Fintech and Social lack the volume for ATT/location analysis entirely. Category totals are floors given incidental capture.
Real in-market screens
Screens from real, in-market apps, tracked by Lazyweb Research.

Frontier1179 × 2556opens the full image 
Spothero1290 × 2796opens the full image 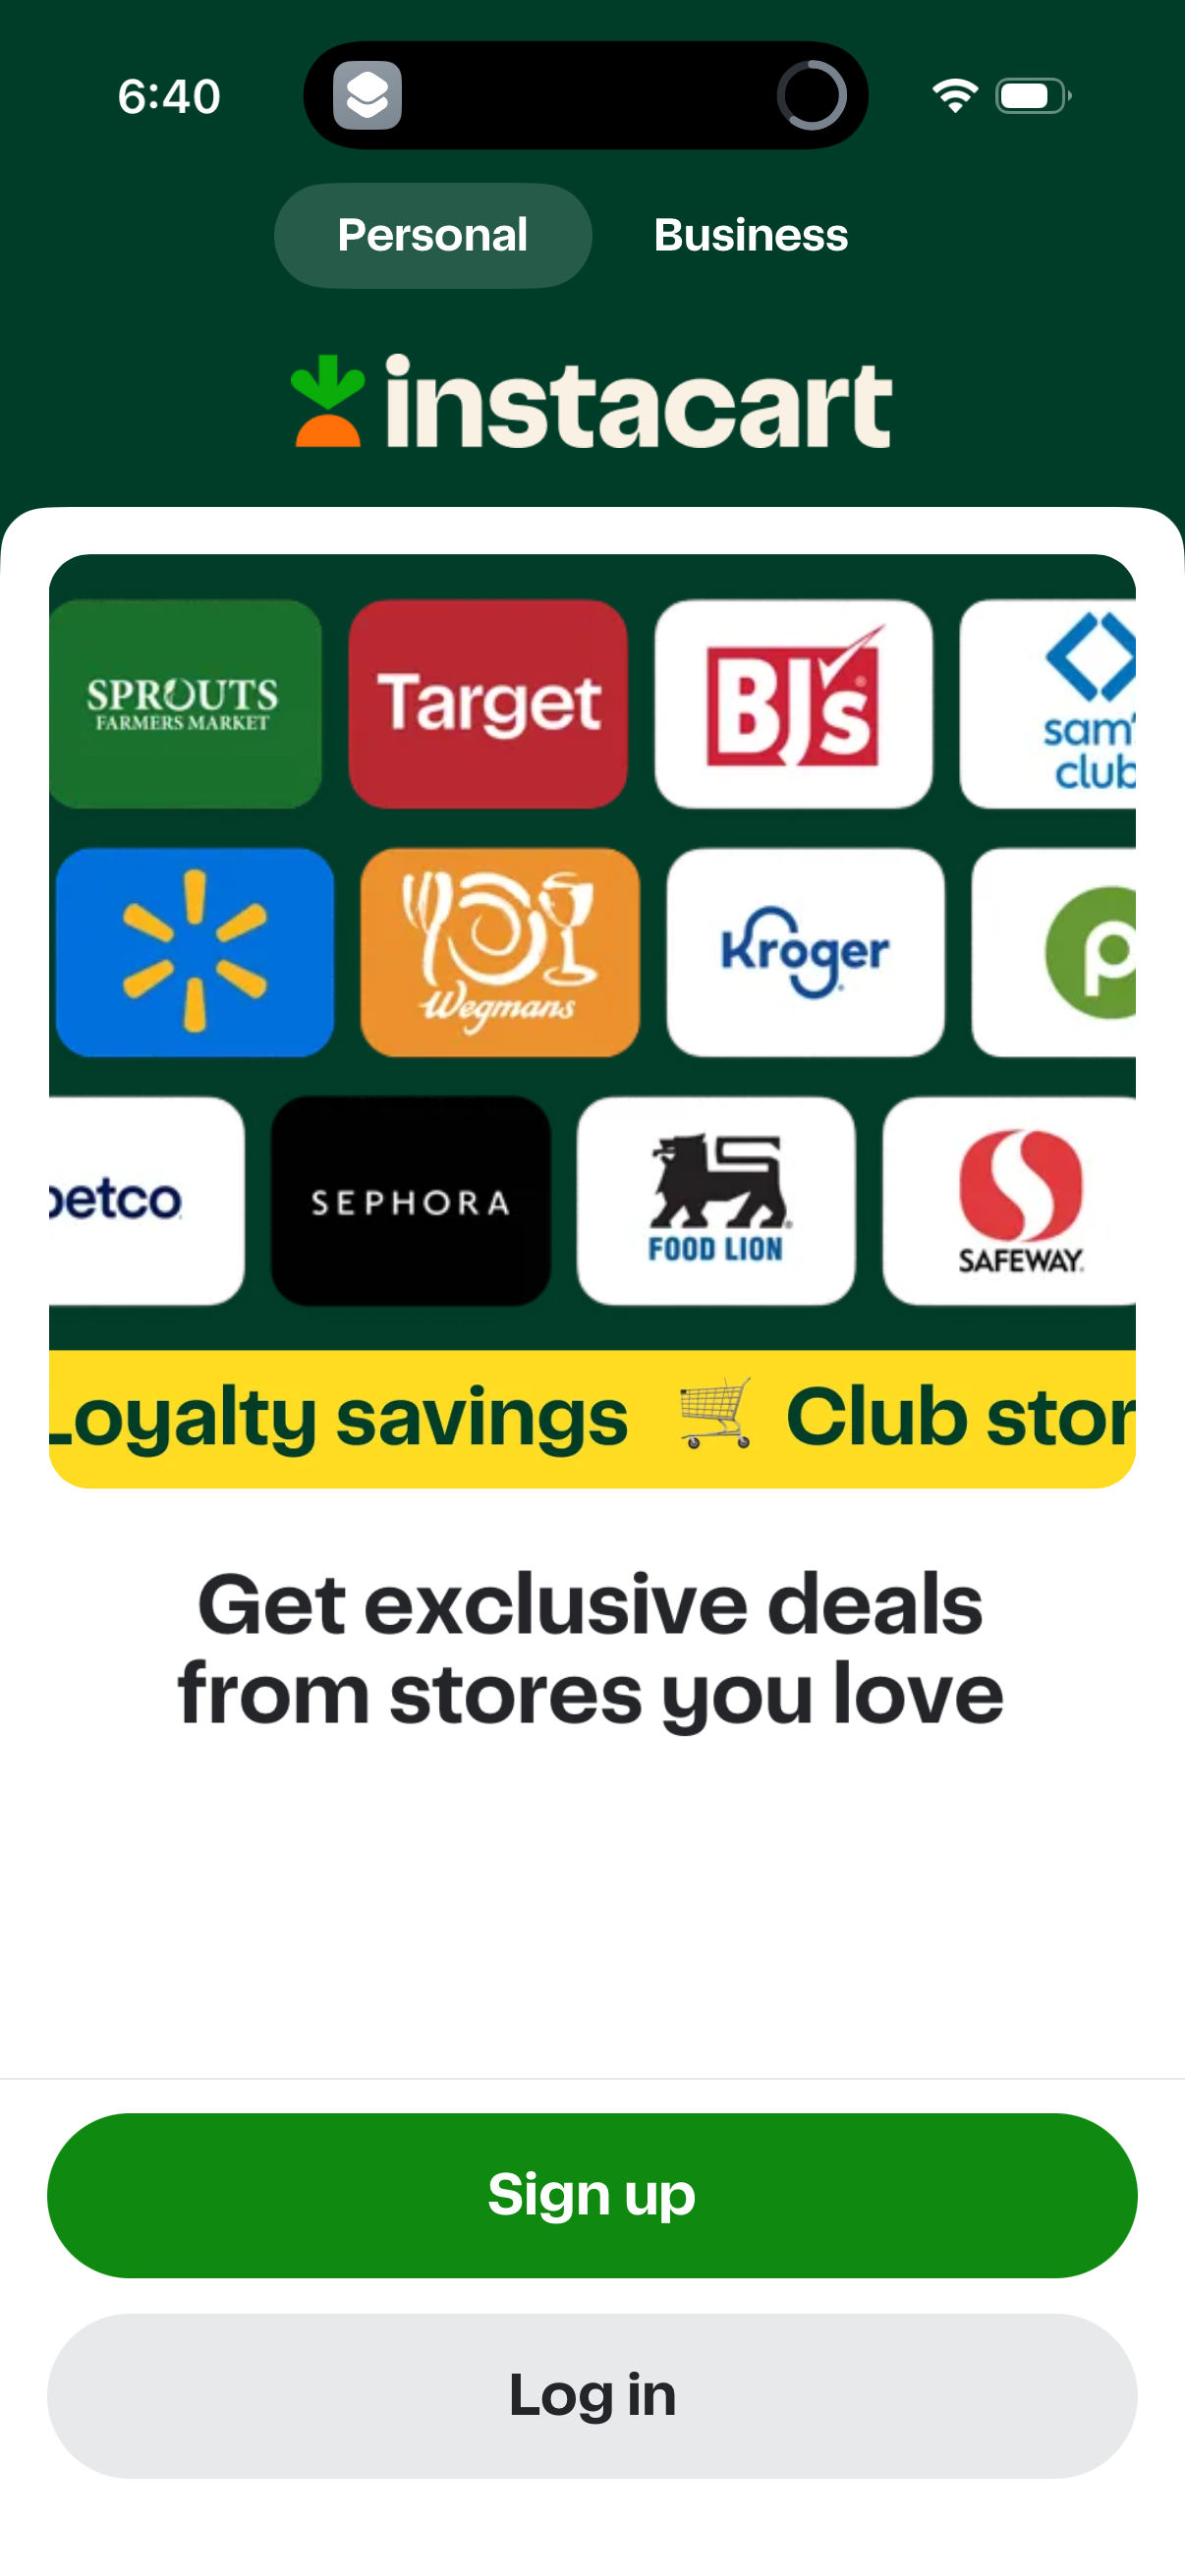
Instacart1206 × 2622opens the full image 
Alexa1206 × 2622opens the full image
The numbers
| # | Stat | Computed from |
|---|---|---|
| [1] | ATT: shopping 8, food & drink 7, education 6, health & fitness 4, entertainment 4. Location: food & drink 6, navigation 5, shopping 4, travel 3 | att_and_location_by_vertical: COUNT(DISTINCT company) GROUP BY category, ATT and location label sets |
Methodology
Universe: 45 ATT apps and 30 location apps (of 807), grouped by companies.category, July 2026. All vertical Ns are small, so counts only; capture is incidental, making totals floors.
Sources
- [1]
Lazyweb Research analysis of 45 ATT apps and 30 location apps (807-app corpus), July 2026
Absolute company counts per category; all below the percentage threshold, so counts only. Fintech/Social too small for ATT/location.
Source: Lazyweb Research — proprietary analysis of real, in-market app screens. Cite as Lazyweb Research, 2026-07-07.