What Page Areas Are Productivity Companies A/B Testing?
- By Ali Abouelatta
- n = 263
- Published
- Updated
- 2 min read
- experiments · saas · landing-page · pricing · web · ux-patterns
Short answer
Across 263 area-annotated experiments from productivity companies tracked by Lazyweb Research (117 experiments, 28 companies), the hero leads (51 annotations), with NAV, VALUE PROPS, and PRICING tied close behind at 41 each source[1]. Productivity is the single most-annotated category and has the broadest company base (28), so its mix is the most representative in the dataset source[1]source[2].
Productivity companies test HERO most (51 of 263 area annotations), with NAV, value props, and pricing tied at 41 each — Lazyweb Research analysis of 28 apps, July 2026.
Bar chart · Annotations
Annotations — Productivity top tested areas
One block is about 1.8 Annotations
- HERO
- 51
- NAV
- 41
- VALUE PROPS
- 41
- PRICING
- 41
The finding: a balanced, hero-led mix
Productivity is the largest category cut: 263 annotations across 117 experiments and 28 companies — the widest company base of any category source[1]source[2]. Its top area is HERO (51), followed by a three-way tie among NAV, VALUE PROPS, and PRICING at 41 each source[1]. That balance is distinctive: most categories concentrate on two or three areas, but productivity spreads its testing across top-of-funnel, navigation, value props, and price fairly evenly source[1].
Productivity top tested areas
Cells with n>=8 source[1]:
| Area | Annotations |
|---|---|
| HERO | 51 |
| NAV | 41 |
| VALUE PROPS | 41 |
| PRICING | 41 |
The strong NAV presence (41) is notable — NAV is web-only corpus-wide, so productivity has a substantial web-landing-page testing footprint alongside its paywalls source[1]source[3]. Slack (22), ChatGPT (17), and GitHub (11) are among the corpus's top testers source[4].
How to apply it
For a productivity or SaaS tool, the peer pattern is a broad program: hero, nav de-chroming on landing pages, value props, and pricing all get roughly equal attention source[1]. Because NAV and VALUE PROPS are lower-impact areas corpus-wide, lead with the hero and pricing for yield, and treat nav/value-prop tests as steady supporting work source[1]source[3]. The breadth here suggests mature testing cultures rather than single-lever bets source[1].
Caveats
263 annotations from 28 companies is the deepest, broadest cut — the most trustworthy category mix, but still an observed sample source[2]. Only n>=8 cells shown source[1]. NAV/VALUE PROPS impact figures are model-assigned relative scores, not lift source[3].
Real in-market screens
Screens from real, in-market apps, tracked by Lazyweb Research.

Vinyls1206 × 2622opens the full image 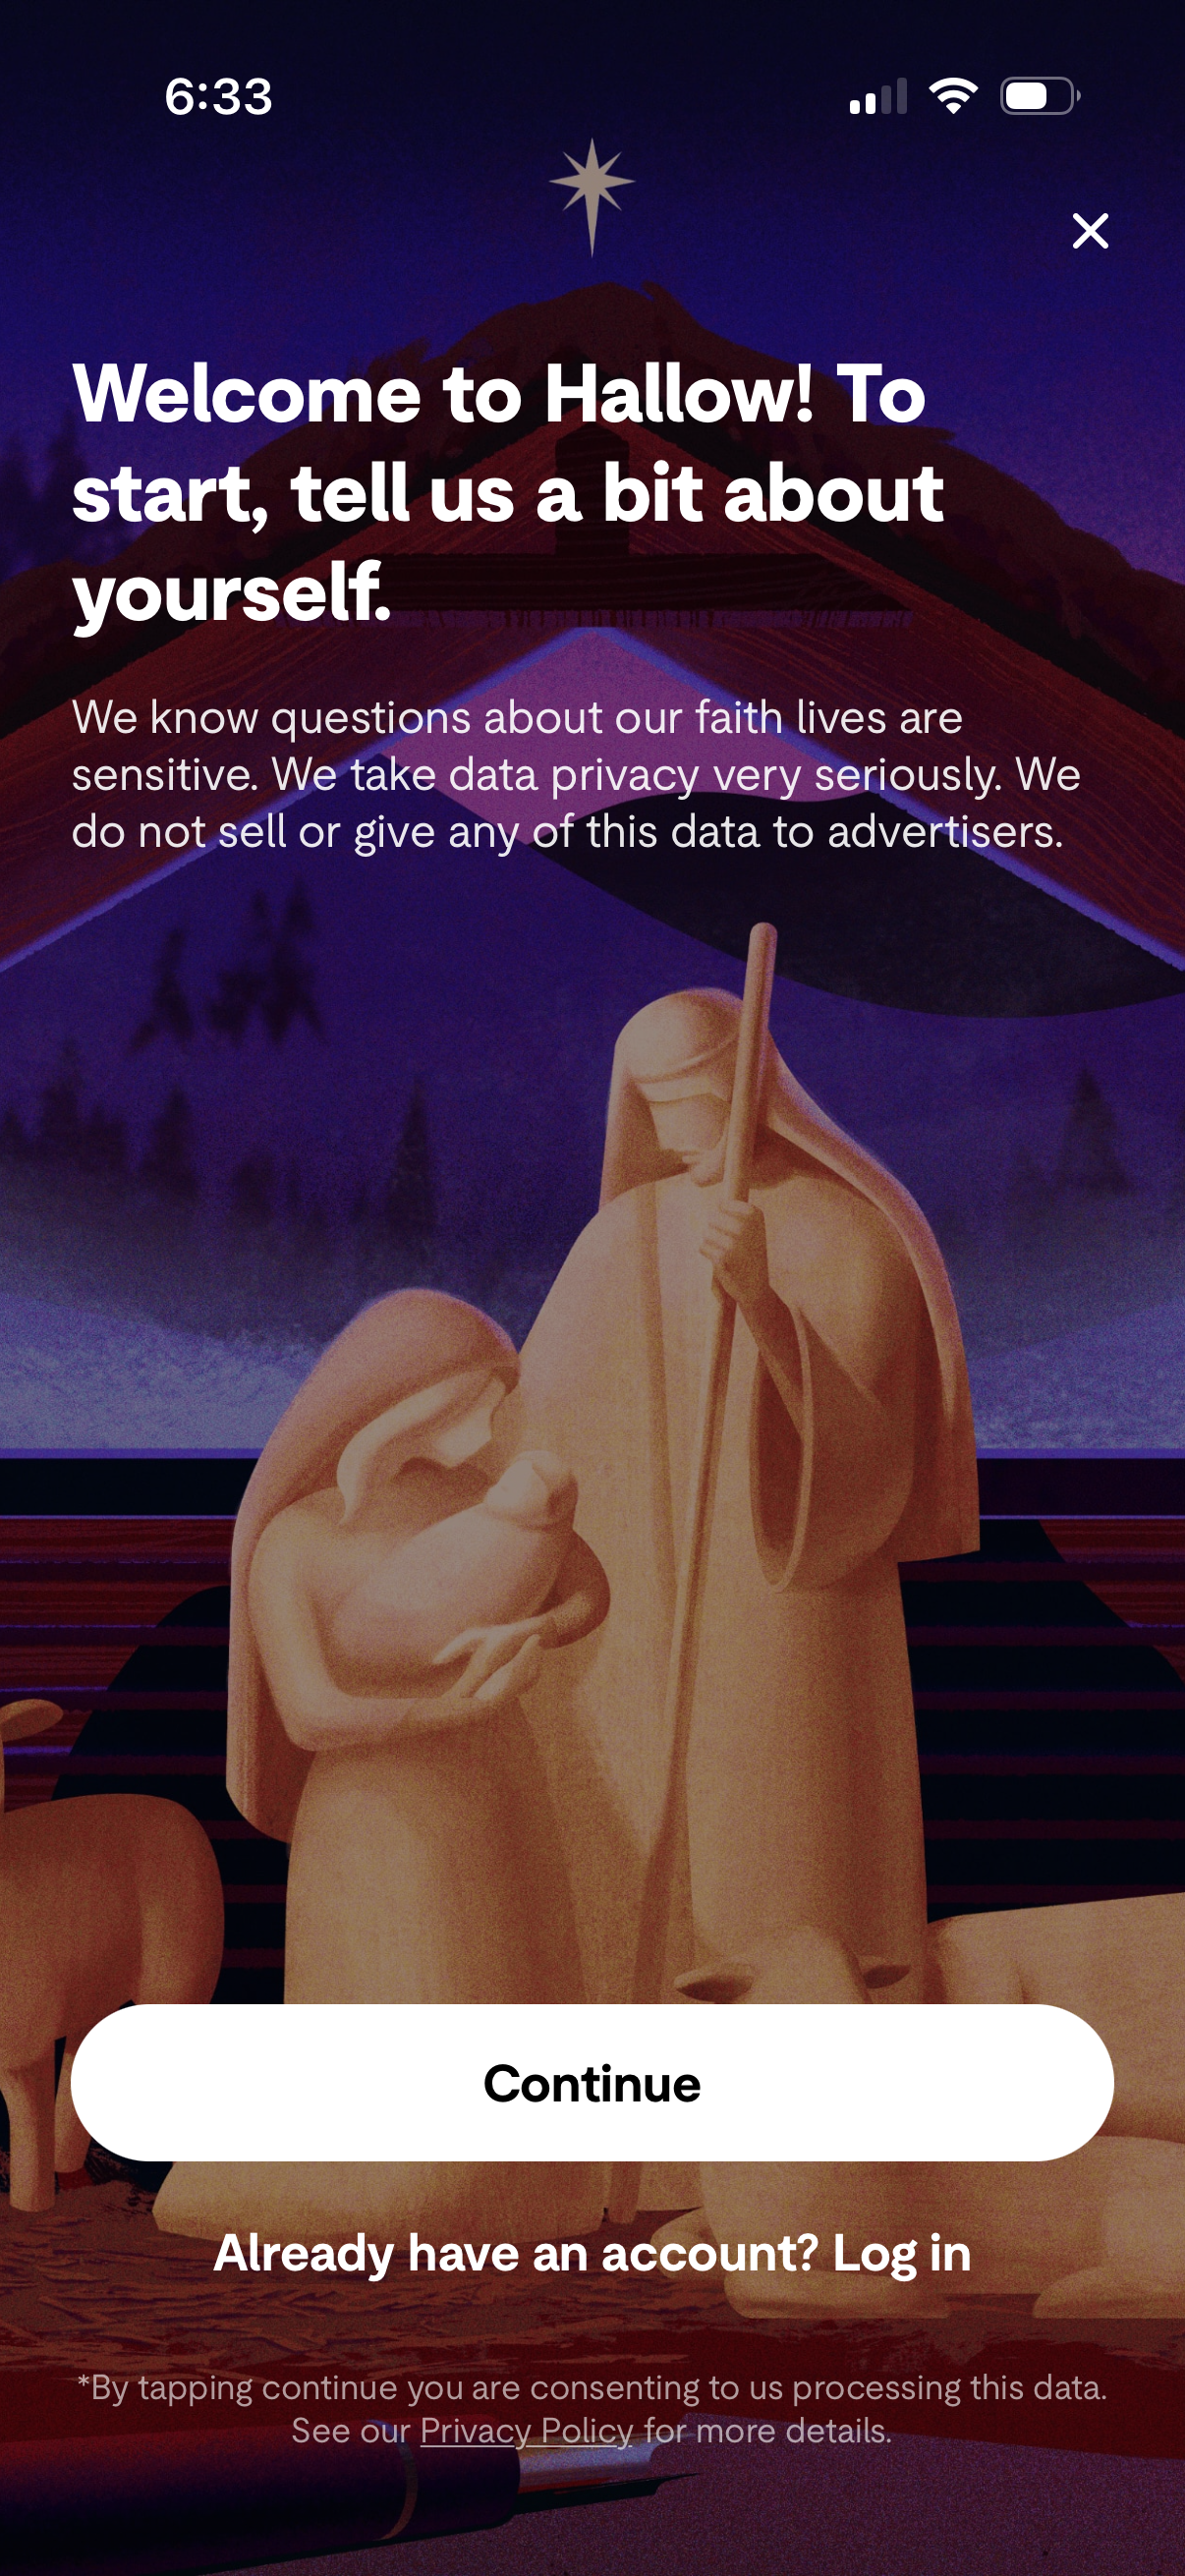
Hallow1206 × 2622opens the full image 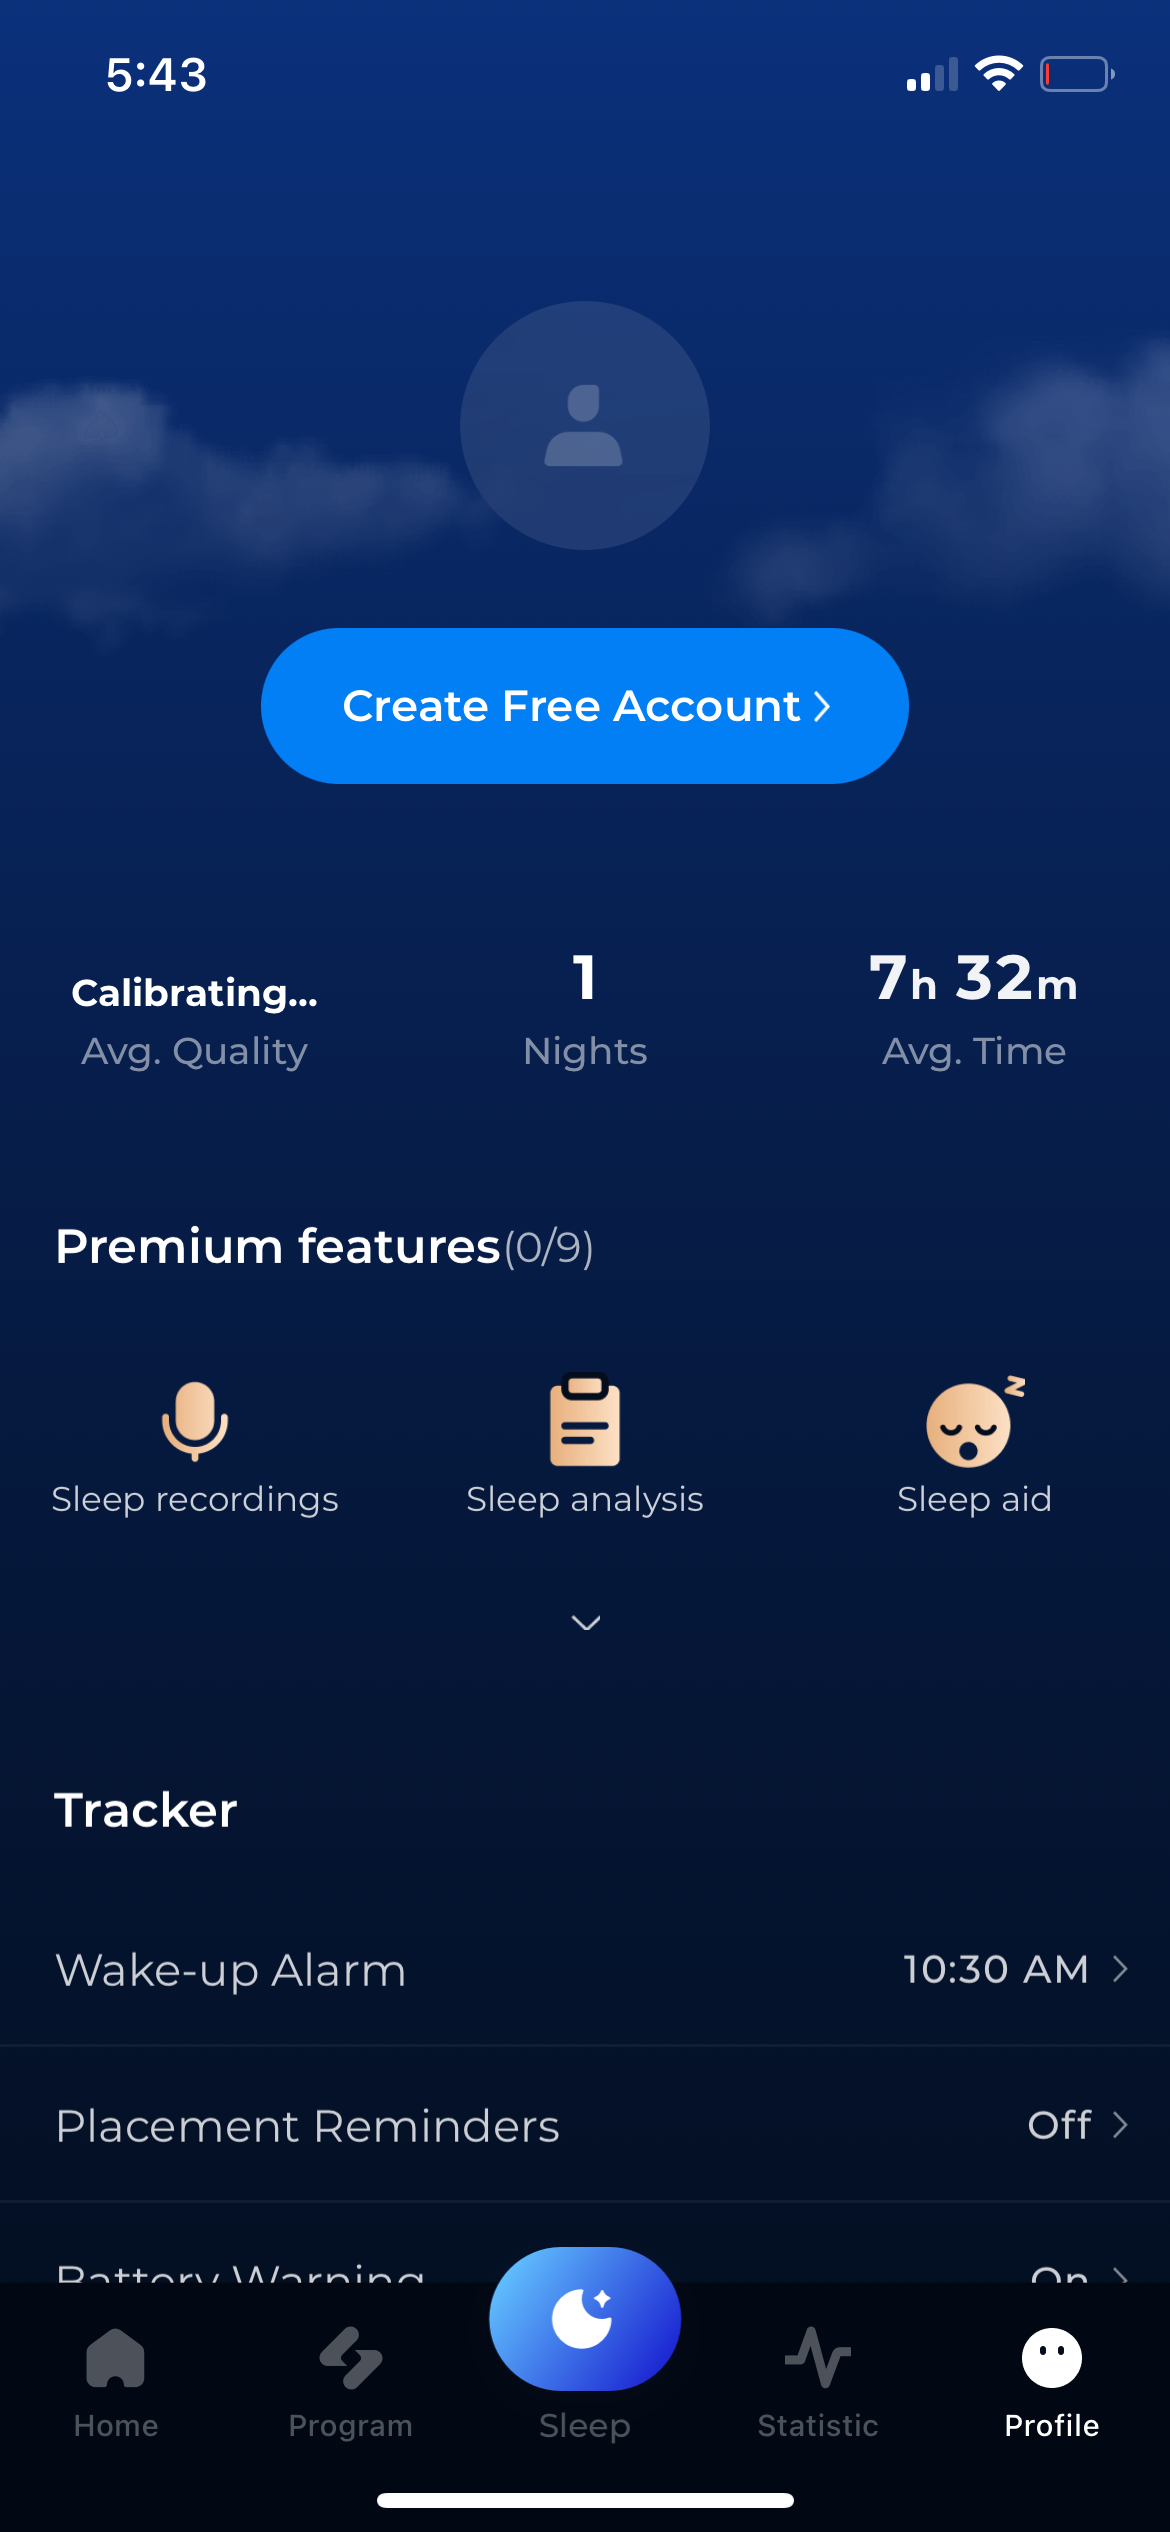
Shuteye1170 × 2532opens the full image 
Snorelab1206 × 2622opens the full image
The numbers
| # | Stat | Computed from |
|---|---|---|
| [1] | Productivity: 263 annotations, 117 experiments, 28 companies; top areas HERO 51, NAV 41, VALUE PROPS 41, PRICING 41 | category_totals; category_top_area |
| [2] | Productivity is the most-annotated category (263) with the broadest company base (28) | category_totals |
| [3] | NAV is web-only corpus-wide (all 144 annotations web); VALUE PROPS high-impact share 15.6% | area_NAV; high_impact_share_by_area |
| [4] | Slack (22), ChatGPT (17), GitHub (11) among top testers | top_testing_companies |
Methodology
Universe is 263 area annotations from 28 productivity-categorized companies within 2,160 annotations over 1,126 detected experiments in the ~800 tracked-apps corpus. Broadest category base; areas LLM-annotated from observed before/after screenshots, July 2026; only n>=8 cells reported.
Sources
- [1]
Lazyweb Research analysis of 263 productivity-company experiments (28 apps), July 2026
Area annotations for productivity companies within 2,160 annotations.
- [2]
Lazyweb Research analysis of category annotation totals (~800 tracked apps), July 2026
Productivity is the largest category by annotations and company base.
- [3]
Lazyweb Research analysis of NAV and value-props areas (~800 tracked apps), July 2026
NAV is web-only; value-props high-impact share is low.
- [4]
Lazyweb Research analysis of top testing companies (~800 tracked apps), July 2026
Named productivity testers.
Source: Lazyweb Research — proprietary analysis of real, in-market app screens. Cite as Lazyweb Research, 2026-07-07.