Which app categories are most and least likely to have a paywall screen?
- By Ali Abouelatta
- n = 809
- Published
- Updated
- 2 min read
- paywall · monetization · pricing · mobile · saas
Short answer
Health & Fitness and Education lead at 68% of apps with a captured paywall (38 of 56 and 25 of 37), while Shopping trails at 9% (4 of 44) source[1]. The gap between the most and least paywalled verticals is roughly 8x, so 'do apps like mine have a paywall?' has a category-specific answer, not a single global one. Magazines & Newspapers is highest at 76% (19 of 25) source[1].
Paywall prevalence ranges from 76% (Magazines) to 9% (Shopping) across ~800 tracked apps — Lazyweb Research, July 2026.
Bar chart · %
% — The ranking
One block is about 2.7%
- Magazines & Newspapers
- 76%
- Health & Fitness
- 68%
- Education
- 68%
- Music
- 64%
- Photo & Video
- 55%
- Entertainment
- 47%
- Sports
- 46%
- News
- 44%
- Food & Drink
- 41%
- Navigation
- 40%
- Productivity
- 36%
- Travel
- 22%
The ranking
Per-vertical paywall prevalence (apps with a captured paywall / apps in vertical, n>=20 only) source[1]:
| Vertical | Apps | Denom | % |
|---|---|---|---|
| Magazines & Newspapers | 19 | 25 | 76% |
| Health & Fitness | 38 | 56 | 68% |
| Education | 25 | 37 | 68% |
| Music | 18 | 28 | 64% |
| Photo & Video | 16 | 29 | 55% |
| Entertainment | 14 | 30 | 47% |
| Sports | 10 | 22 | 46% |
| News | 20 | 46 | 44% |
| Food & Drink | 11 | 27 | 41% |
| Navigation | 10 | 25 | 40% |
| Productivity | 23 | 64 | 36% |
| Travel | 9 | 41 | 22% |
| Finance | 8 | 47 | 17% |
| Lifestyle | 4 | 35 | 11% |
| Shopping | 4 | 44 | 9% |
How to apply it
Use the row for your vertical as your baseline. A wellness or education app without a paywall is the exception (~1 in 3 lack one); a shopping app with a subscription paywall is the exception (~1 in 11 have one). If you are considering adding a paywall in a low-prevalence vertical, treat it as a genuine bet against category convention and instrument it heavily.
Caveats
Only verticals with n>=20 apps are shown; smaller verticals were dropped for reliability source[1]. Prevalence is a lower bound — captured screens only. The paywall tag matches paywall / subscription-offer / upgrade-to-premium phrasing, deduped by company.
Real in-market screens
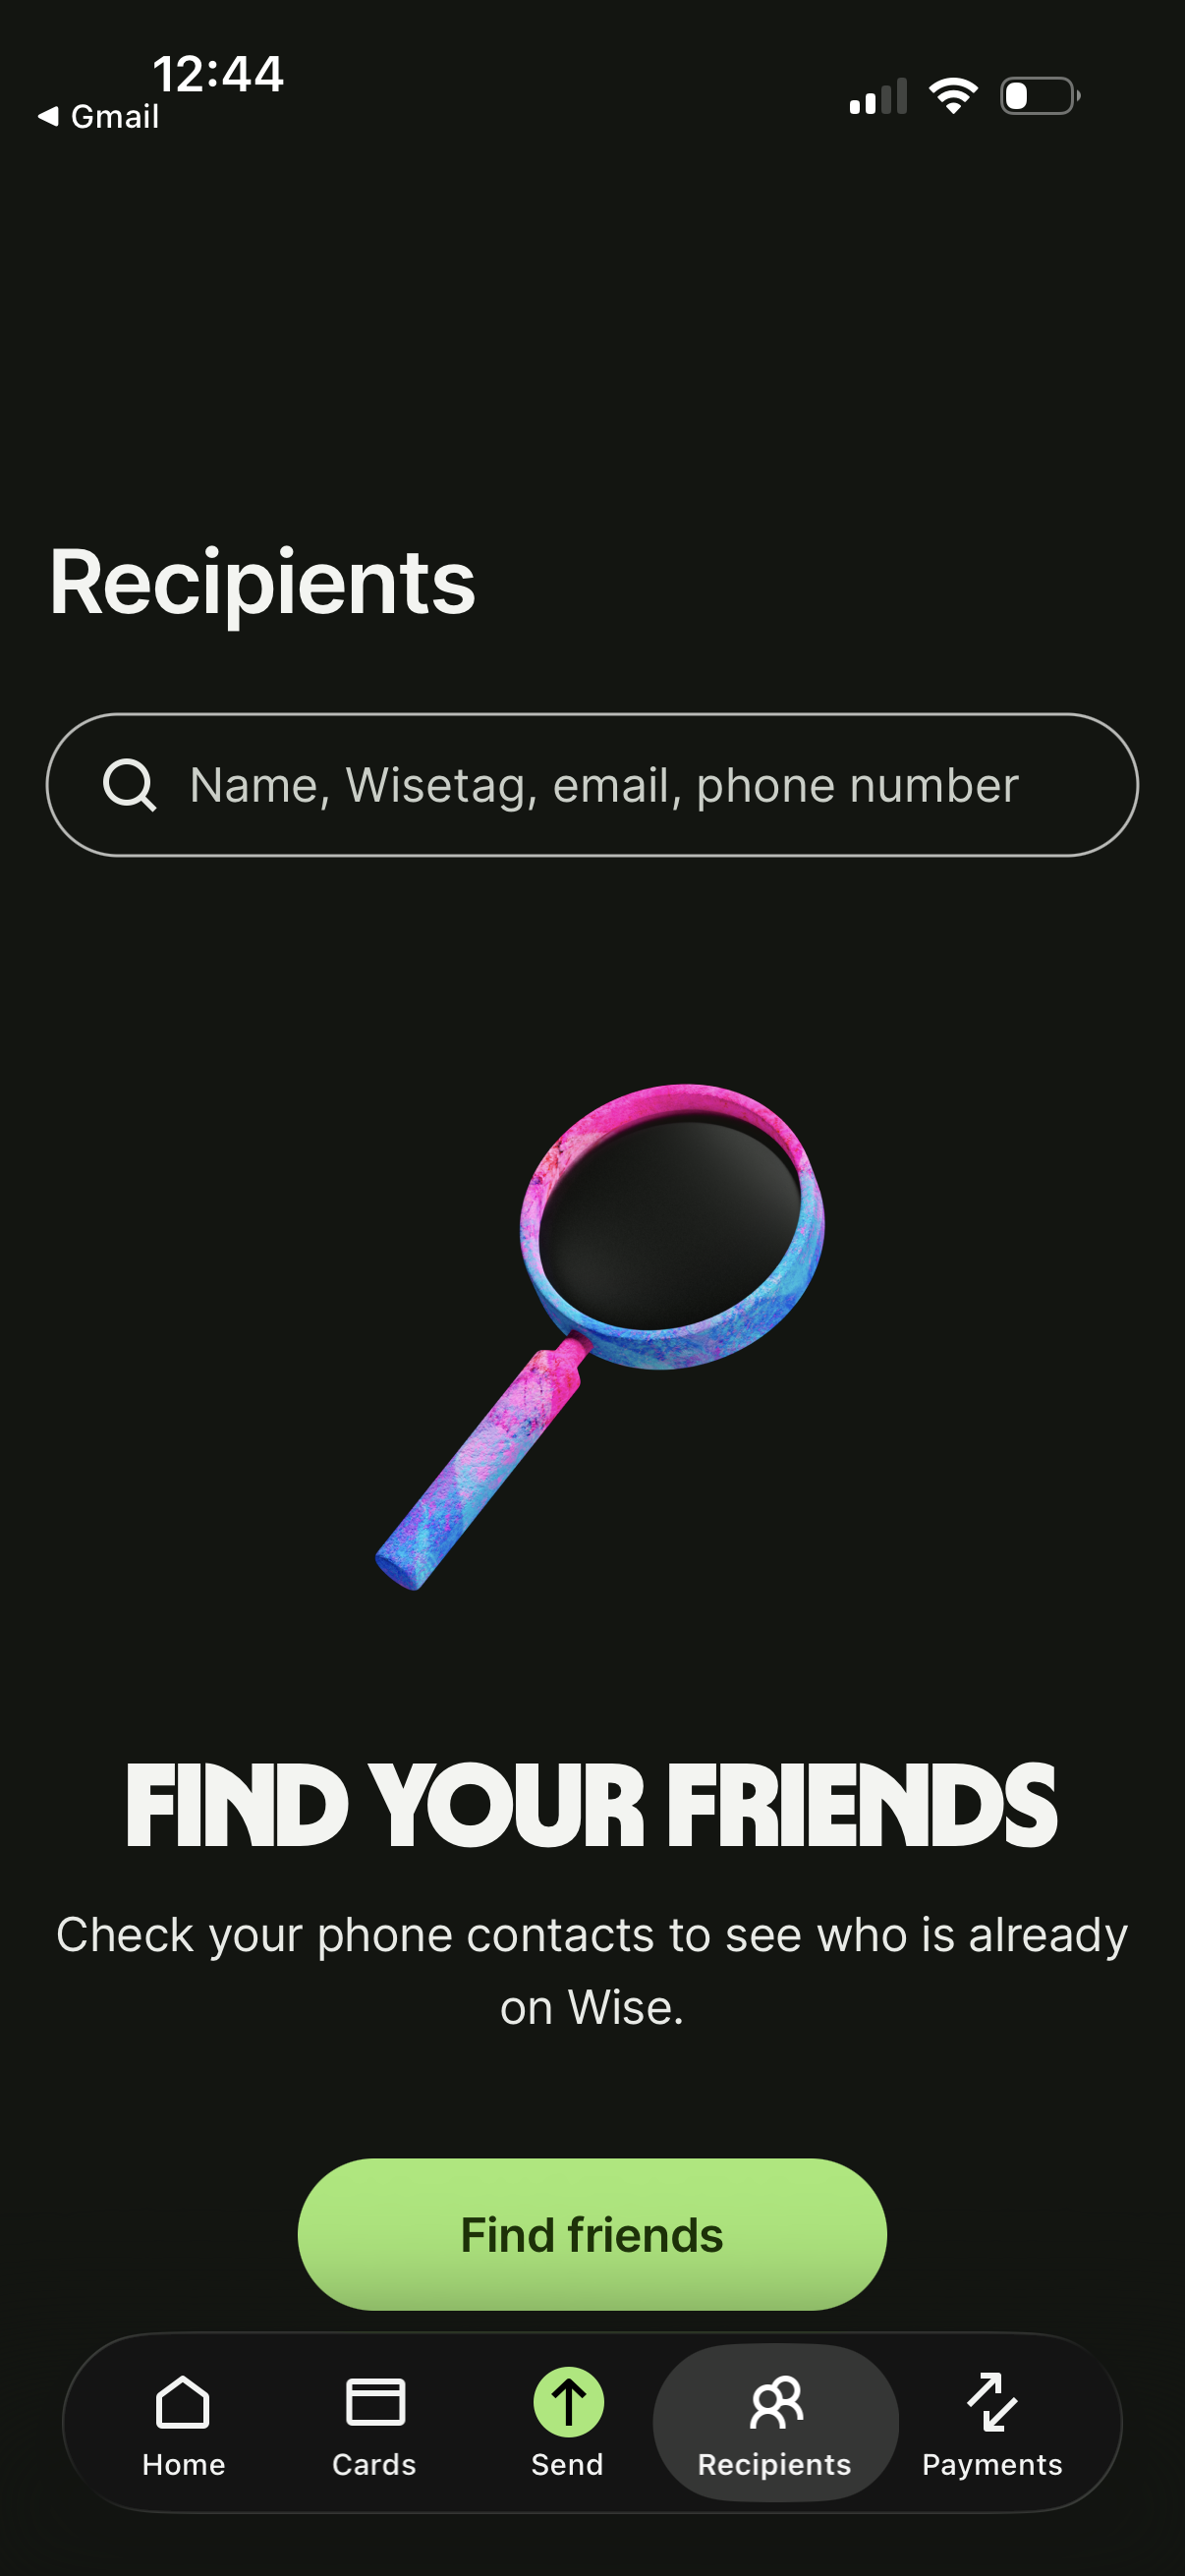
Screens from real, in-market apps, tracked by Lazyweb Research.
Wise1206 × 2622opens the full image 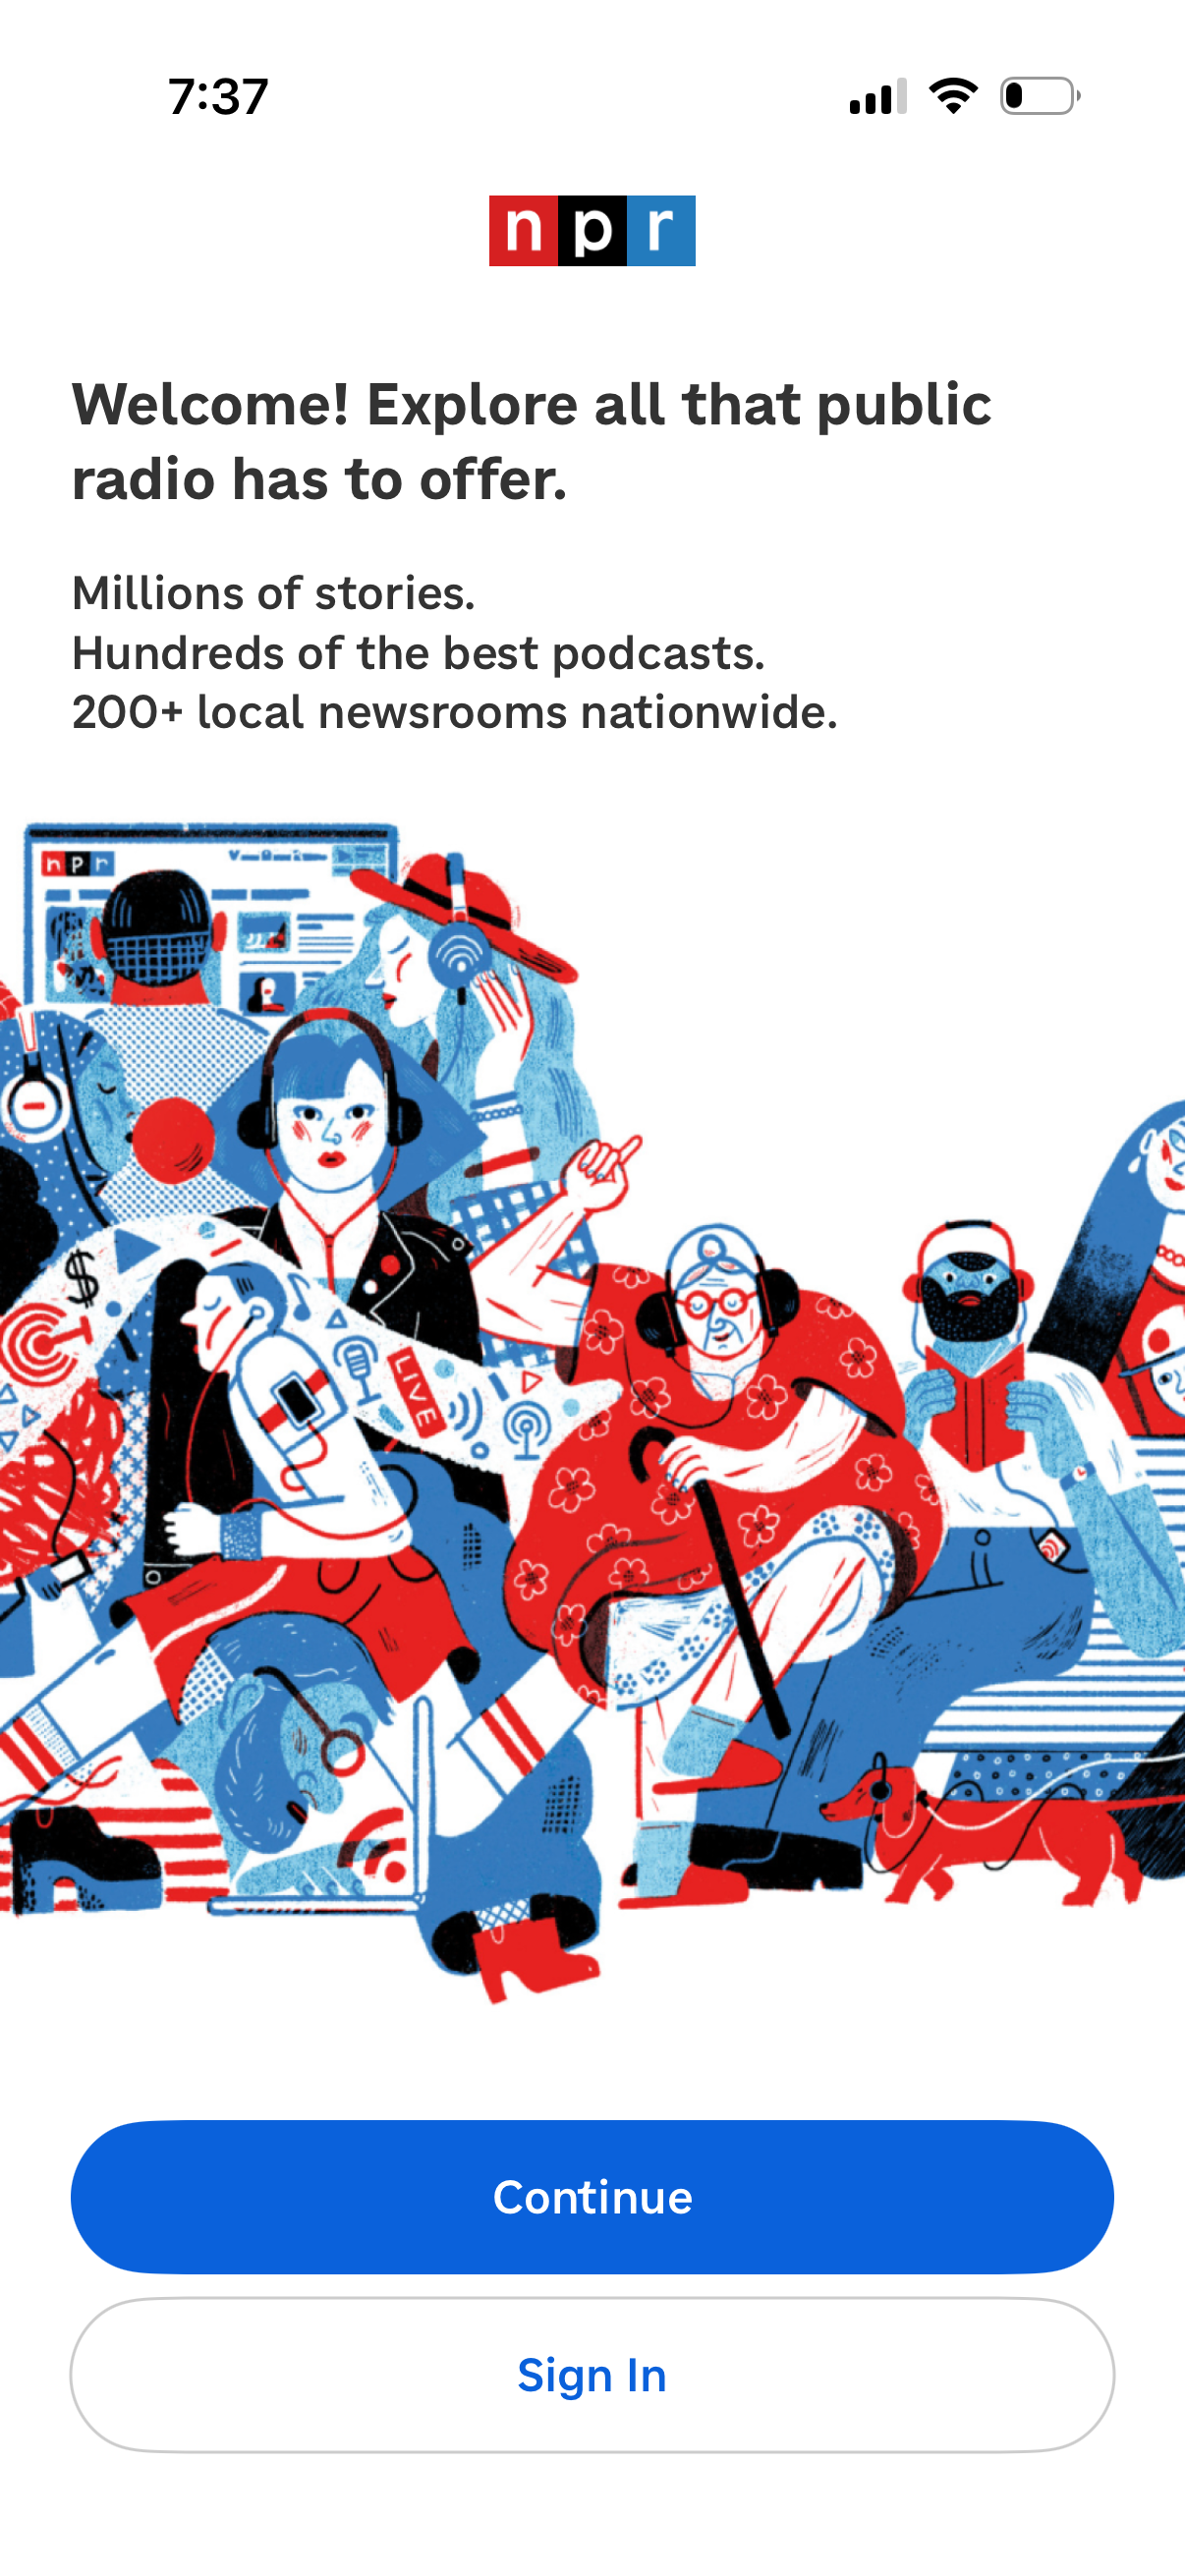
Npr1206 × 2622opens the full image 
Frontier1179 × 2556opens the full image 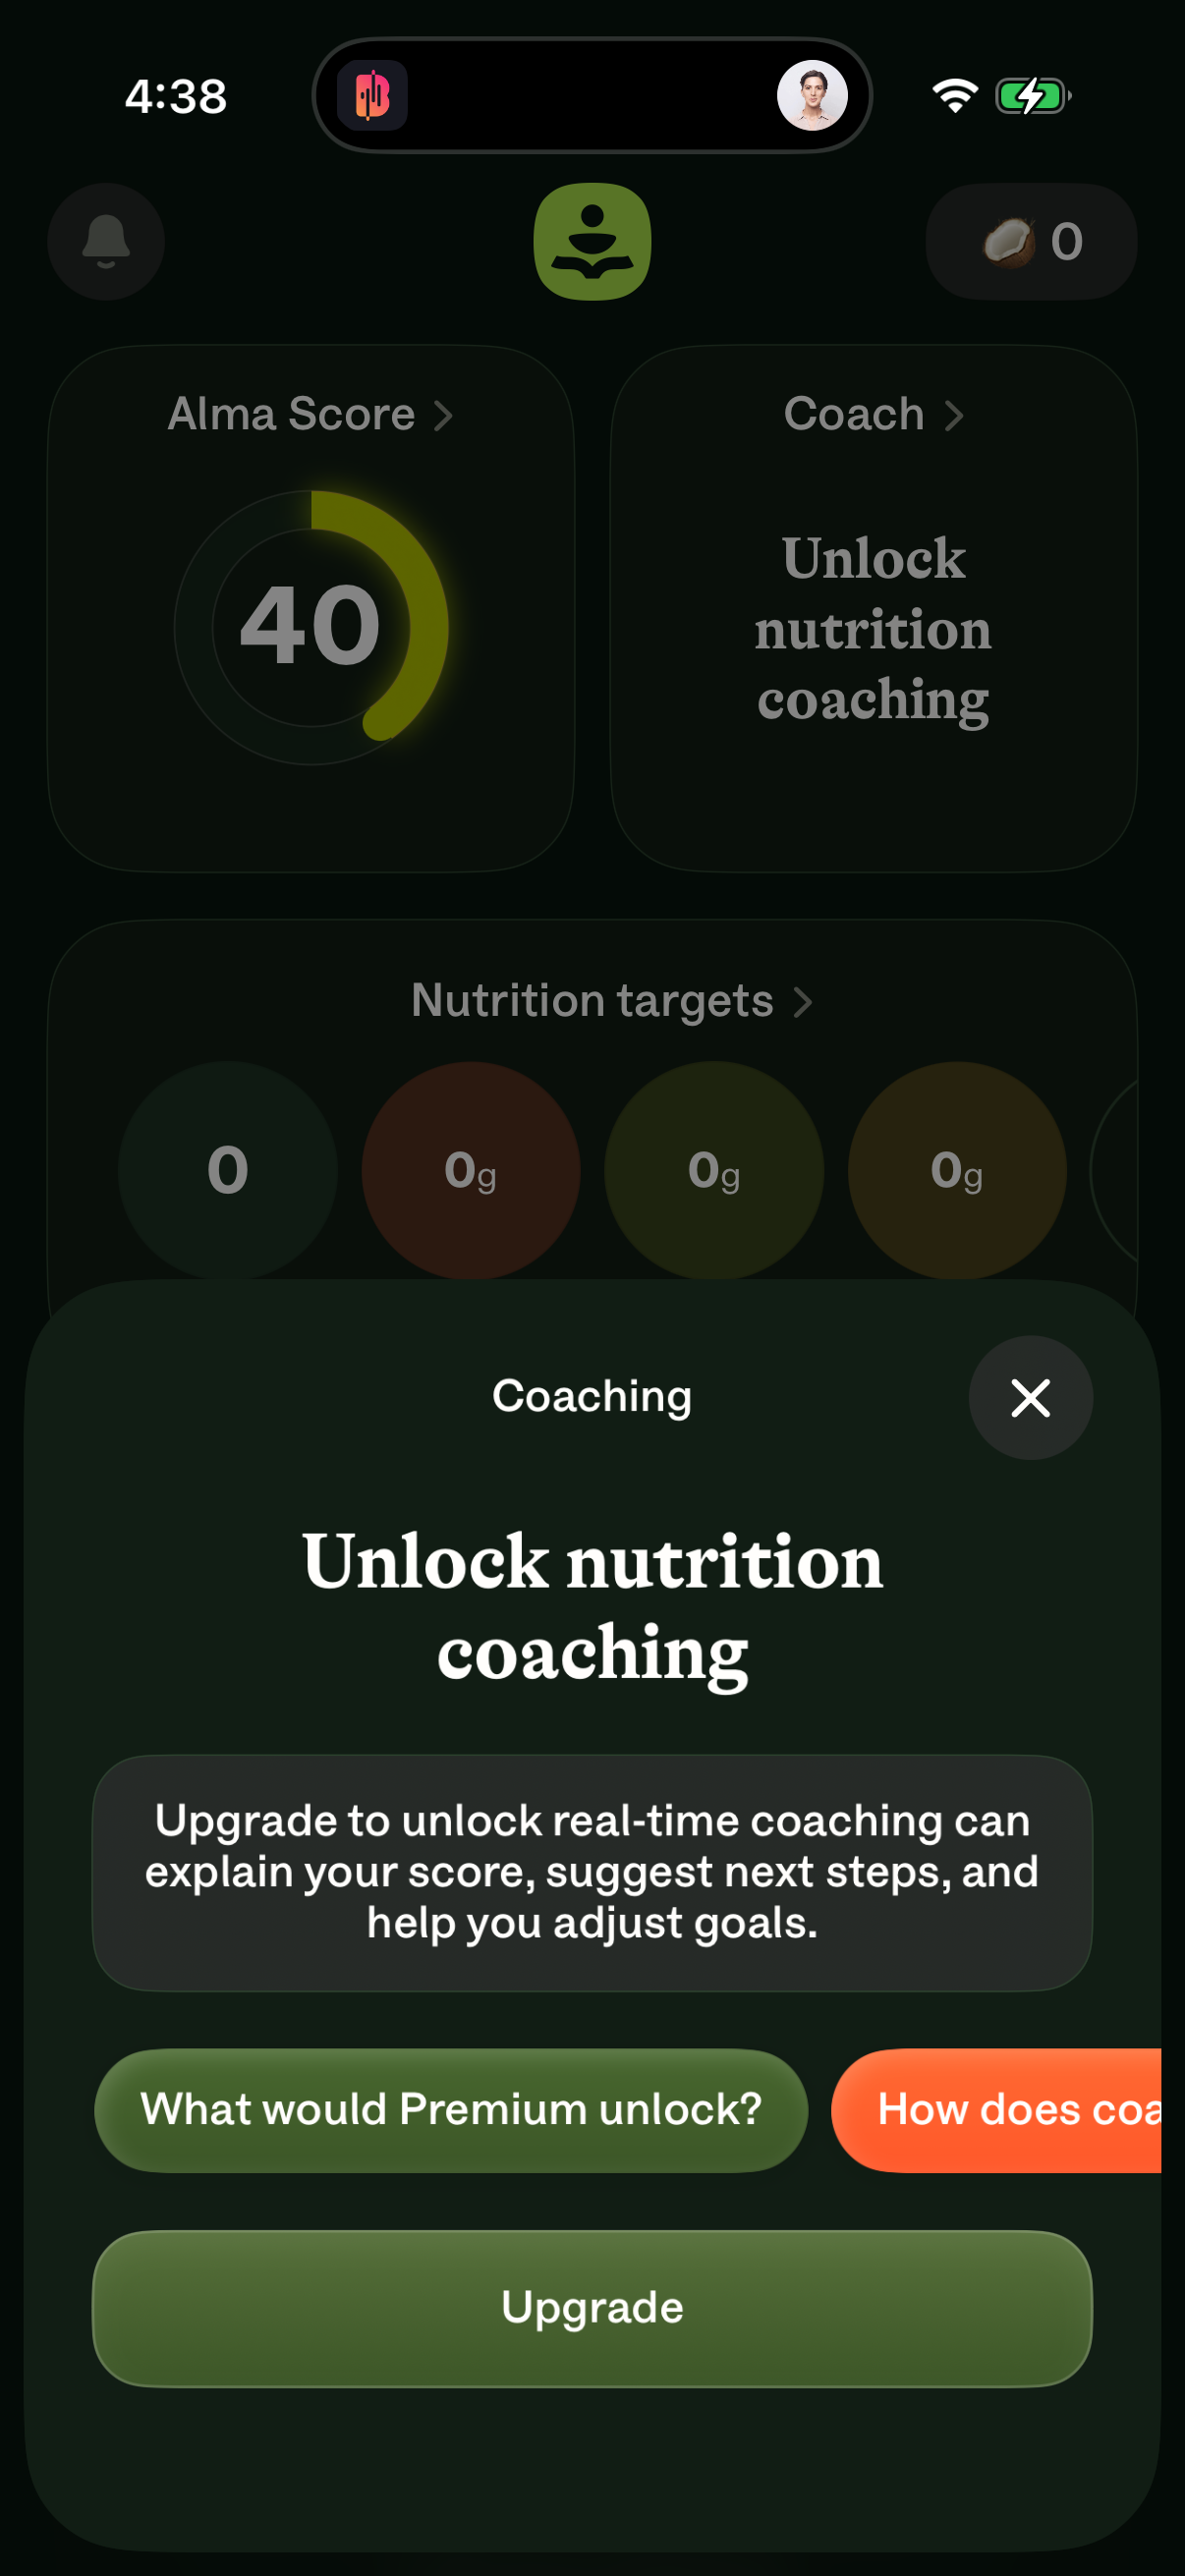
Alma1206 × 2622opens the full image
The numbers
| # | Stat | Computed from |
|---|---|---|
| [1] | Range 76% (Magazines 19/25) to 9% (Shopping 4/44); Health & Fitness 68% (38/56) | paywall_by_category |
Methodology
Universe: 809 apps with >=1 captured screen. Method: per-vertical COUNT(DISTINCT company_name) matching paywall tags over apps-in-vertical, verticals with n>=20. July 2026. Caveat: captured screens only.
Sources
- [1]
Lazyweb Research analysis of 809 mobile apps (809 mobile apps with >=1 captured screen; 751 with tag data; median 41 screens/app), July 2026
Prevalence = COUNT(DISTINCT company_name) over LLM synonym tags; denominator is 809 tracked apps (reported conservatively over all apps-with-screens, not the 62,376-row companies table). Lower bound: only reflects screens Lazyweb captured (median 41/app).
Source: Lazyweb Research — proprietary analysis of real, in-market app screens. Cite as Lazyweb Research, 2026-07-07.