What percent of mobile apps have a cancel-subscription screen?
- By Ali Abouelatta
- n = 809
- Published
- Updated
- 2 min read
- cancellation · retention · monetization · mobile · saas
Short answer
7.8% of tracked apps (63 of 809) have a captured cancel-subscription surface source[1]. That low figure mostly reflects capture, not reality: cancel flows are hard to reach in screenshotting, and the canonical layer holds 337 cancel-subscription screens across the corpus number[2]. Read the 7.8% as a floor — the real share of subscription apps with a cancel flow is much higher.
63 of ~800 tracked apps (7.8%) have a captured cancel-subscription screen; 337 cancel screens exist in the canonical layer — Lazyweb Research, July 2026.
The finding
63 of 809 apps (7.8%) have a cancel-subscription screen captured via tags source[1], but the canonical screen layer contains 337 cancel-subscription screens — the largest single canonical category in this census number[2]. The gap is the story: cancel flows are gated behind account/subscription state and are systematically under-captured.
| Signal | Value |
|---|---|
| Apps with cancel tag | 63 |
| Canonical cancel screens | 337 |
How to apply it
Do not conclude that only 8% of apps let users cancel — the tag figure is a floor distorted by capture difficulty source[1]. The 337 canonical cancel screens show this is a heavily represented pattern once you reach subscription settings. For a subscription product, a clear cancel path is expected; the design decision is how much save-offer friction to add before it, not whether to have it.
Caveats
The 7.8% tag figure badly under-reports because cancel flows require an active paid subscription to reach, which capture rarely simulates source[1]. The 337 canonical cancel screens are SCREEN counts across 23,407 canonical screens — do not divide by 809 number[2]. Use the two figures together, not either alone.
Real in-market screens
Screens from real, in-market apps, tracked by Lazyweb Research.
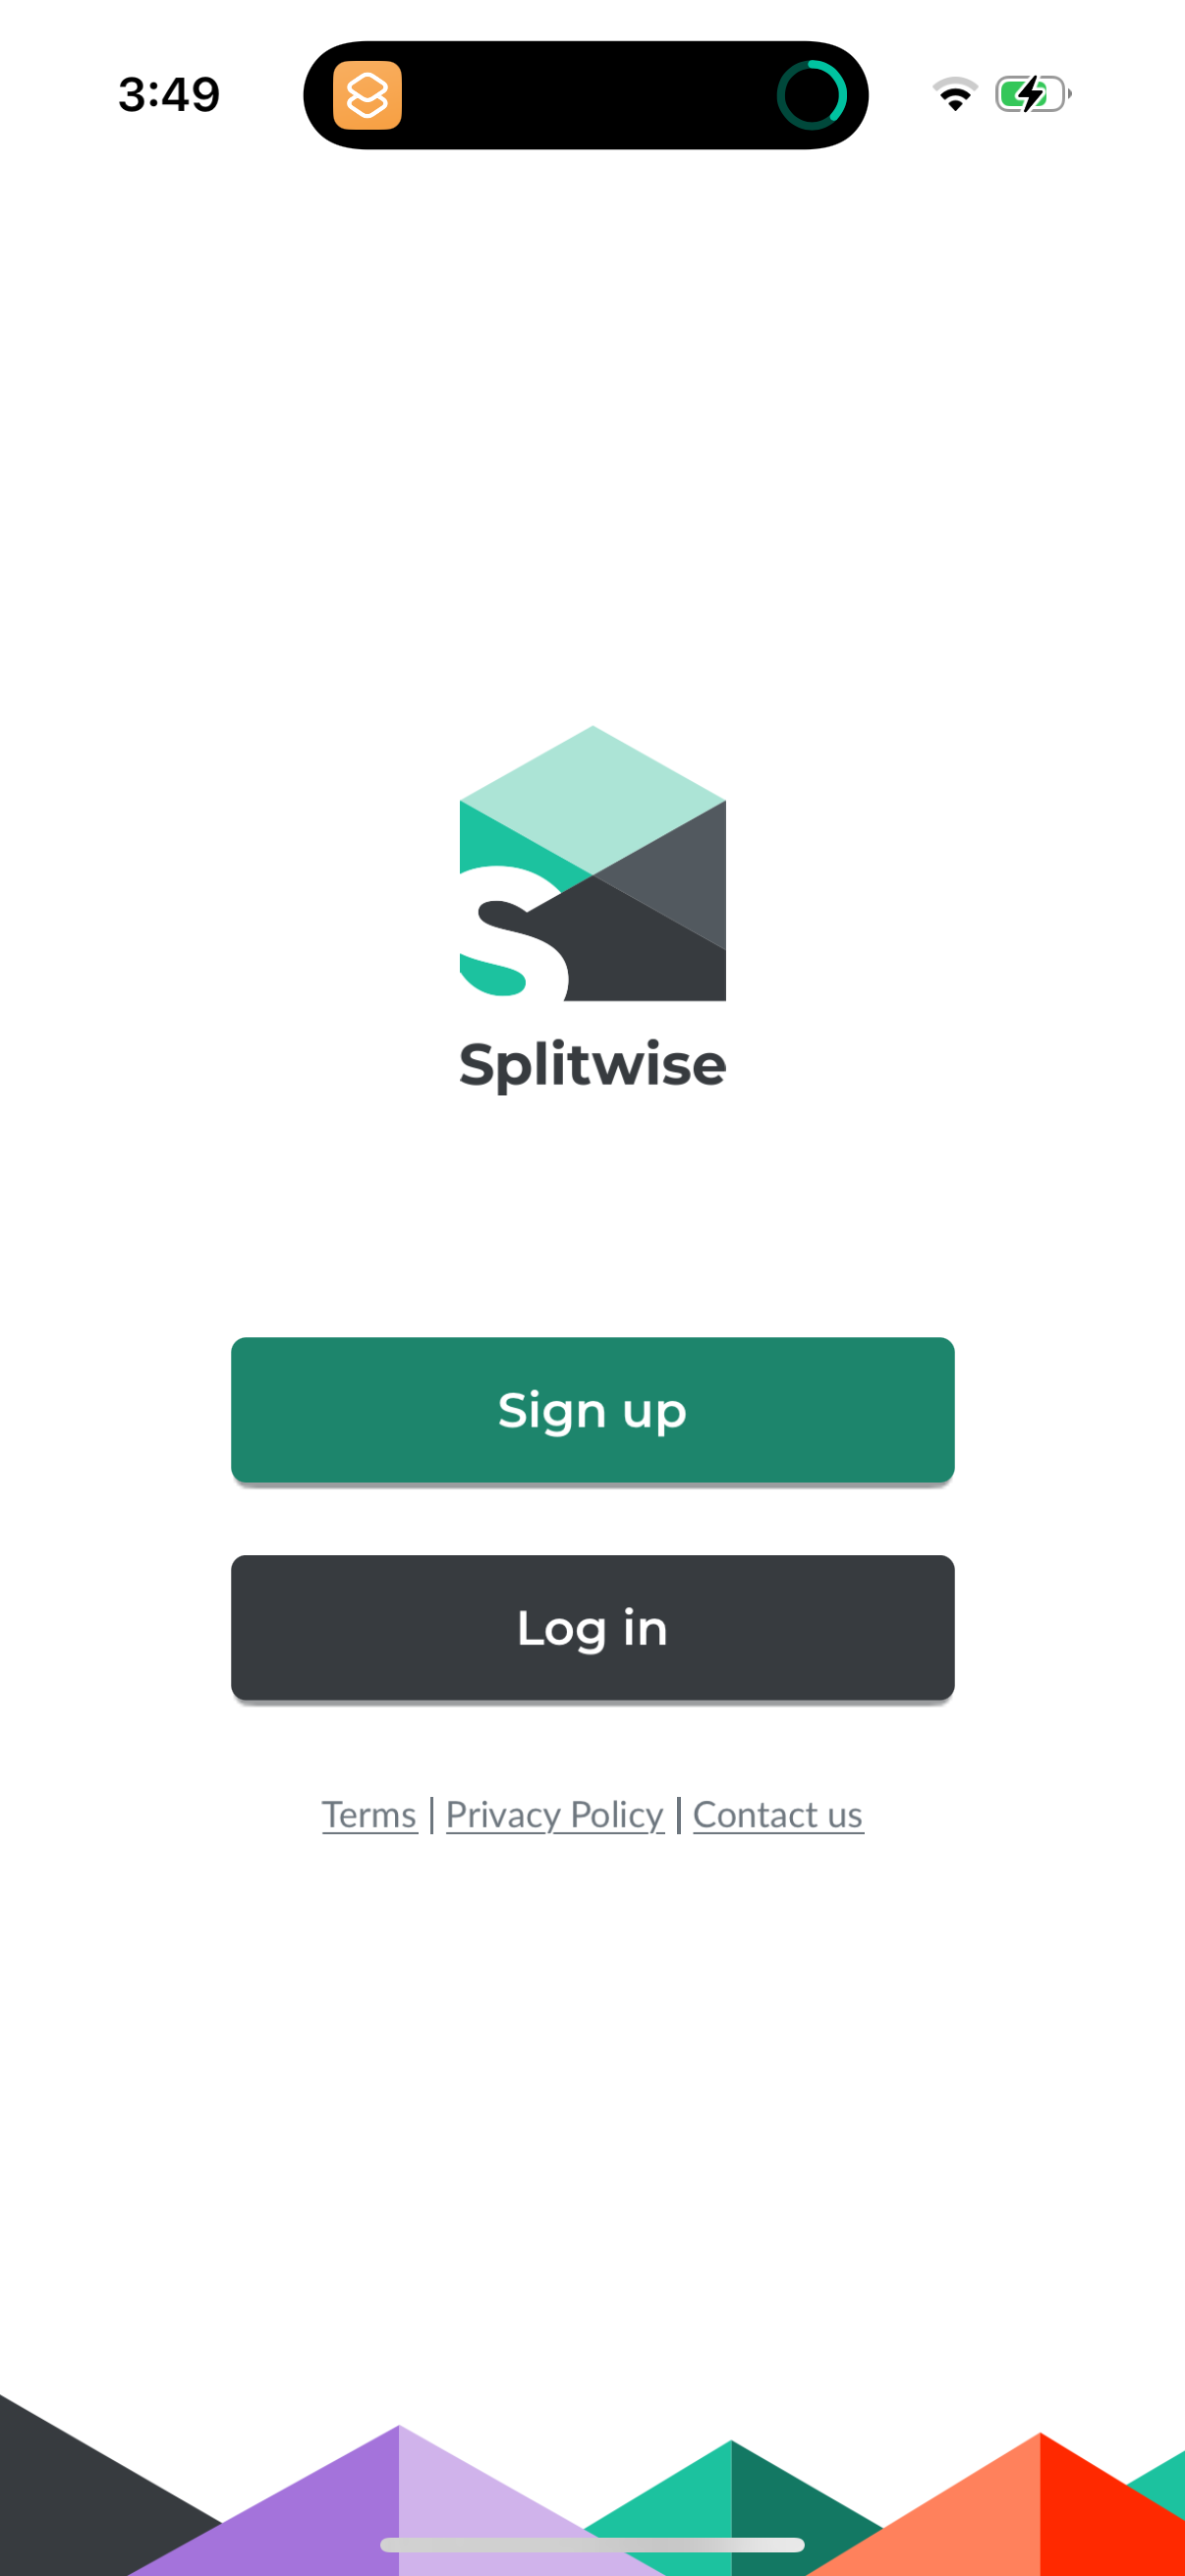
Splitwise1206 × 2622opens the full image 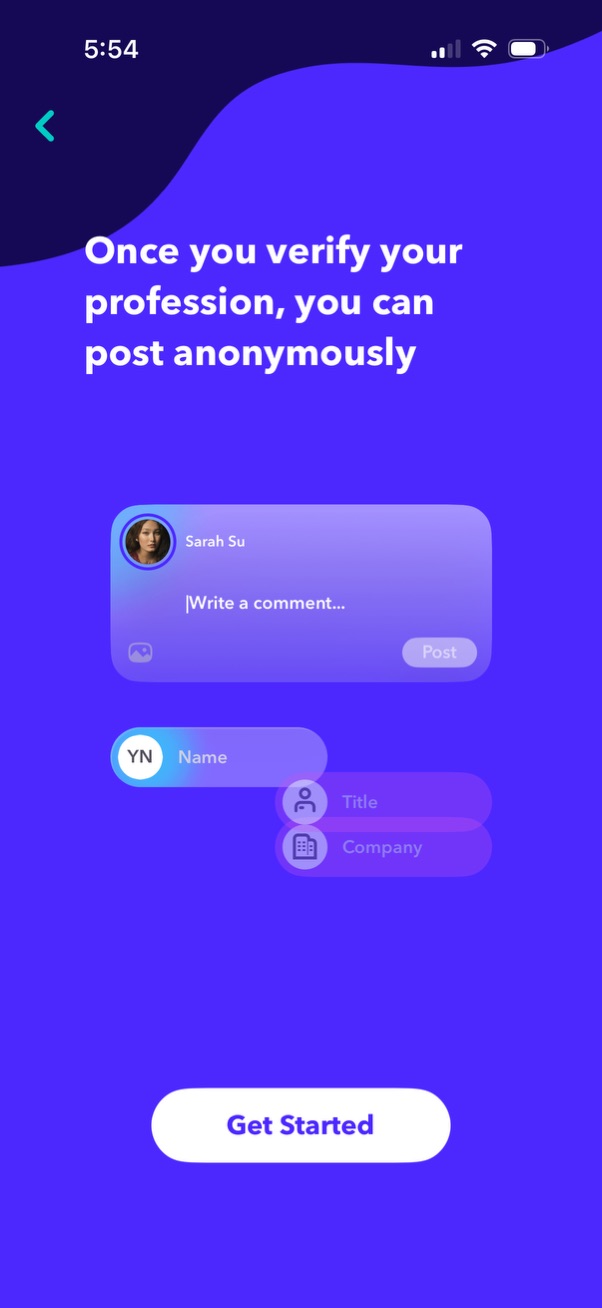
Fishbowl602 × 1308opens the full image 
Priority Pass1206 × 2622opens the full image 
Dairy Queen1290 × 2796opens the full image
The numbers
| # | Stat | Computed from |
|---|---|---|
| [1] | 7.8% (63 of 809), floor | prevalence_cancel_subscription: 63/809 |
| [2] | 337 canonical cancel-subscription screens | canonical_category_census.cancel_subscription_screens |
Methodology
Universe: 809 apps with >=1 captured screen; canonical layer 23,407 screens. Method: COUNT(DISTINCT company_name) matching cancel tags, plus sc_canonical cancel-category count. July 2026. Caveat: tag figure is a capture-limited floor.
Sources
- [1]
Lazyweb Research analysis of 809 mobile apps (809 mobile apps with >=1 captured screen; 751 with tag data; median 41 screens/app), July 2026
Prevalence = COUNT(DISTINCT company_name) over LLM synonym tags; denominator is 809 tracked apps (reported conservatively over all apps-with-screens, not the 62,376-row companies table). Lower bound: only reflects screens Lazyweb captured (median 41/app).
Source: Lazyweb Research — proprietary analysis of real, in-market app screens. Cite as Lazyweb Research, 2026-07-07.