What percent of mobile apps have a leaderboard or ranking screen?
- By Ali Abouelatta
- n = 809
- Published
- Updated
- 2 min read
- retention · ux-patterns · mobile · design · experiments
Short answer
6.8% of tracked apps (55 of 809) have a captured leaderboard or ranking surface source[1]. So leaderboards are a rare, niche gamification pattern — under 1 in 14 tracked apps — even rarer than streaks (11.6%), the pattern they most resemble. Competitive ranking only fits a narrow set of social and habit-forming apps.
55 of ~800 tracked apps (6.8%) have a leaderboard or ranking screen — Lazyweb Research, July 2026.
Bar chart · %
% — The finding
One block is about 0.4%
- Streaks
- 11.6%
- Celebration / success
- 11.9%
- Leaderboard
- 6.8%
The finding
55 of 809 apps (6.8%) show a leaderboard source[1]. It is roughly half as common as streaks and sits near the bottom of the gamification prevalence ladder number[2].
| Gamification pattern | Apps | % |
|---|---|---|
| Streaks | 94 | 11.6% |
| Celebration / success | 96 | 11.9% |
| Leaderboard | 55 | 6.8% |
How to apply it
Leaderboards need a social comparison that motivates rather than demoralizes, which is why they are rare — they backfire in apps where users are on individual journeys source[1]. They fit competitive fitness, learning, and social apps. If you are considering one, streaks (nearly 2x as common) are usually the safer first gamification bet; add a leaderboard only when peer comparison is genuinely motivating for your users.
Caveats
Lower bound — reflects only leaderboard screens Lazyweb captured source[1]. With only 55 apps, this is a small-numerator pattern; treat the 6.8% as an order-of-magnitude, not a precise rate. Match on '%leaderboard%', deduped by company.
Real in-market screens
Screens from real, in-market apps, tracked by Lazyweb Research.
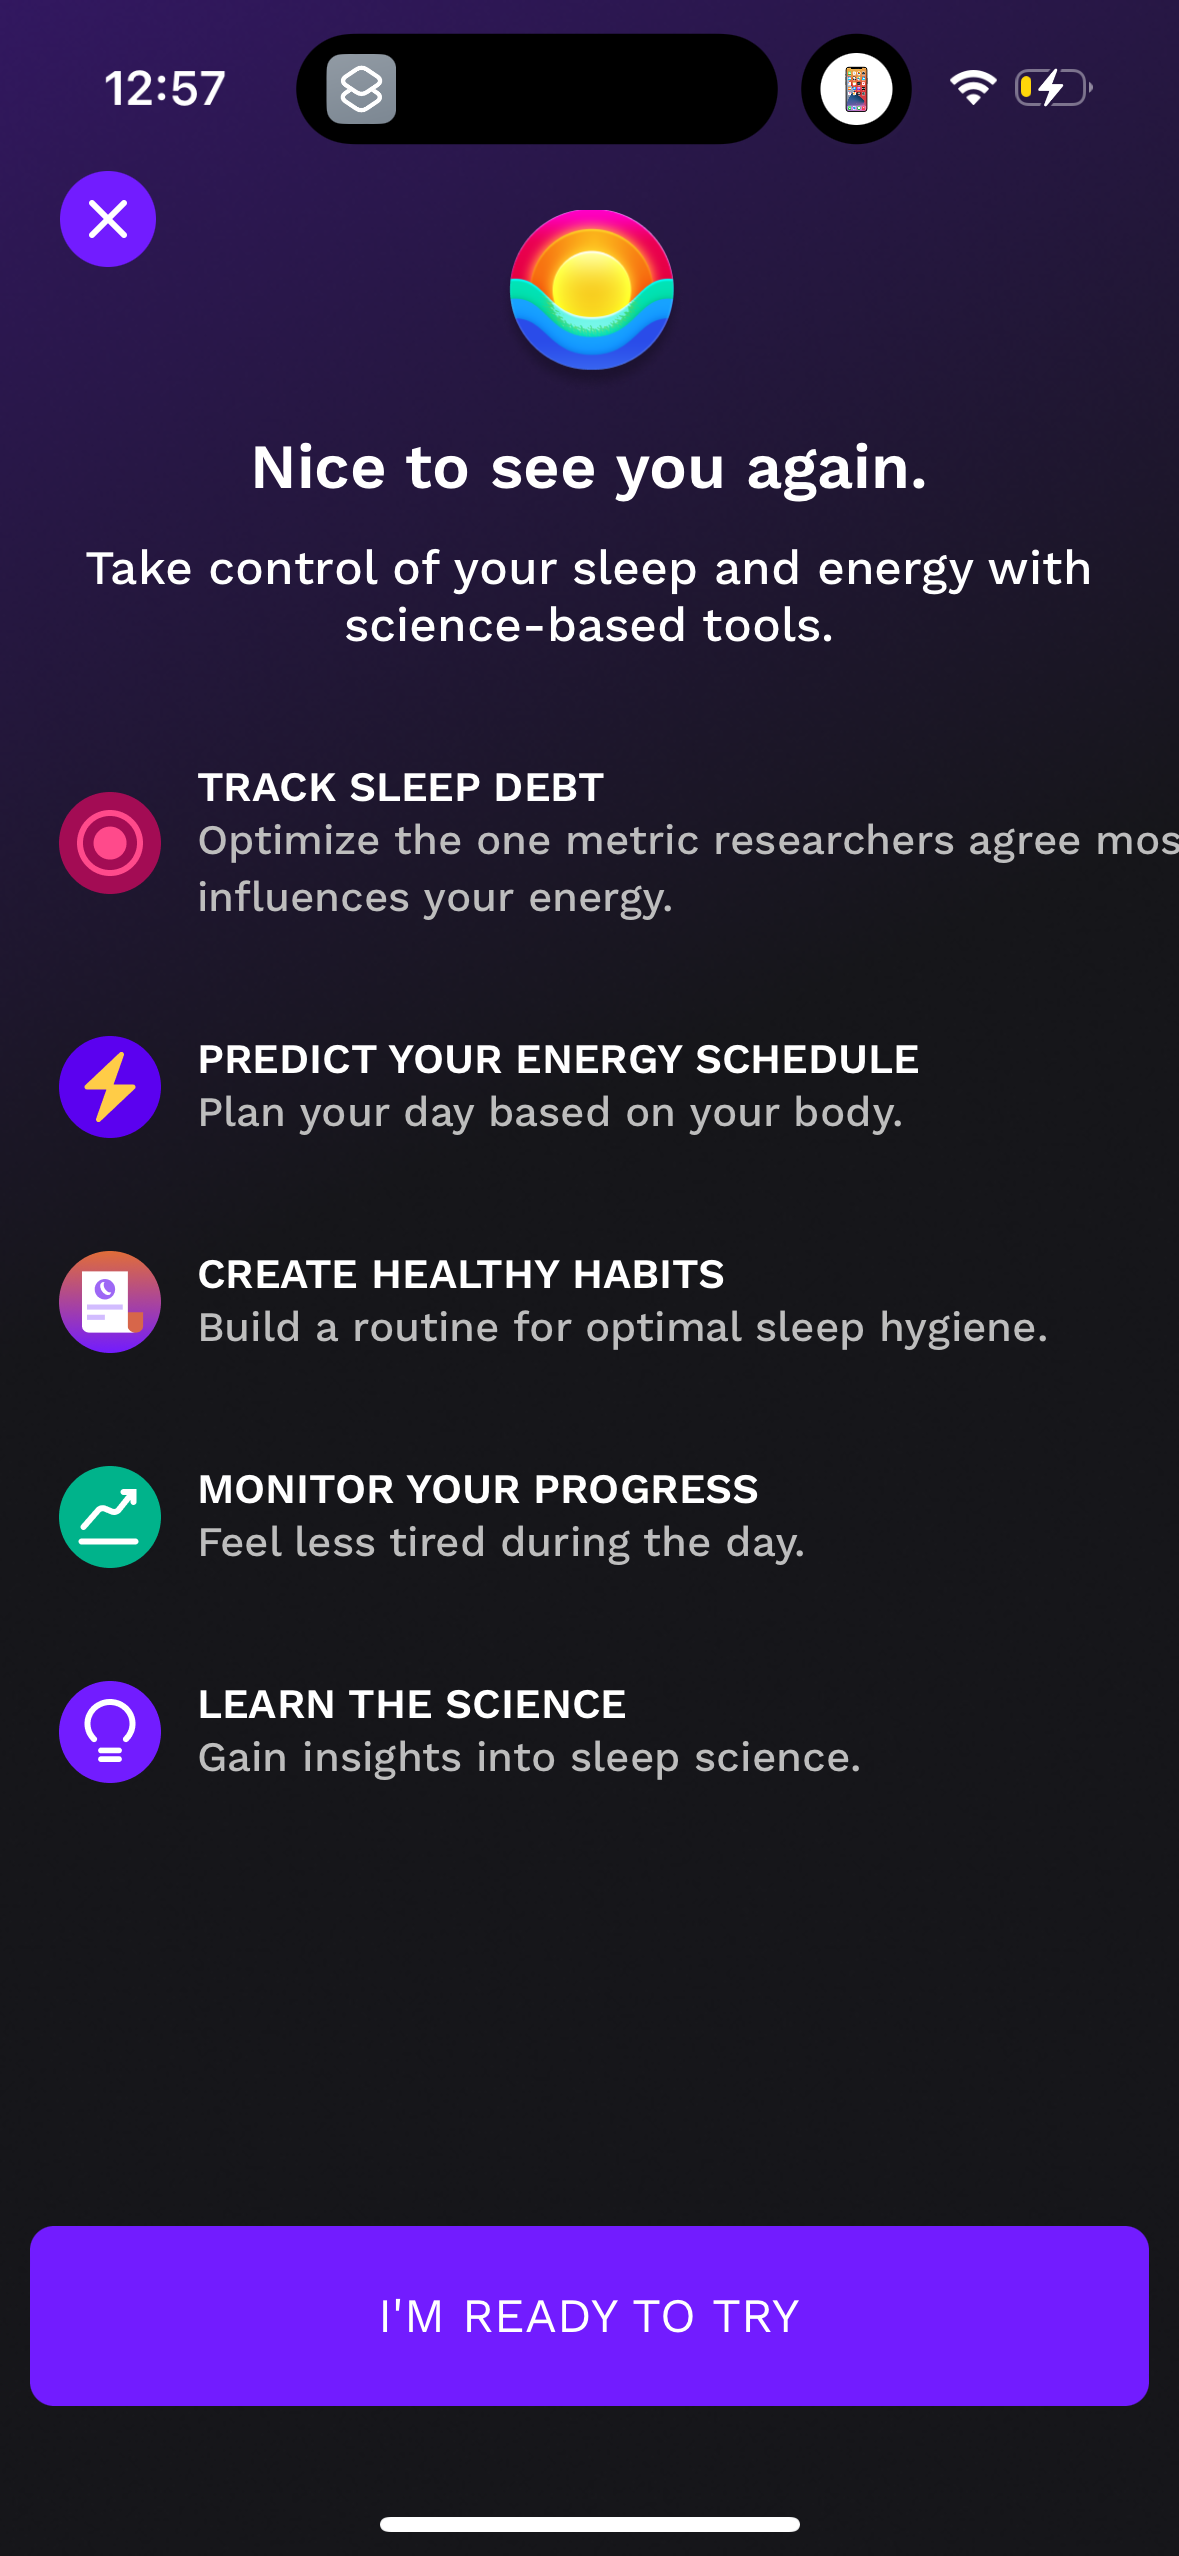
Rise1179 × 2556opens the full image 
Gmail1290 × 2796opens the full image 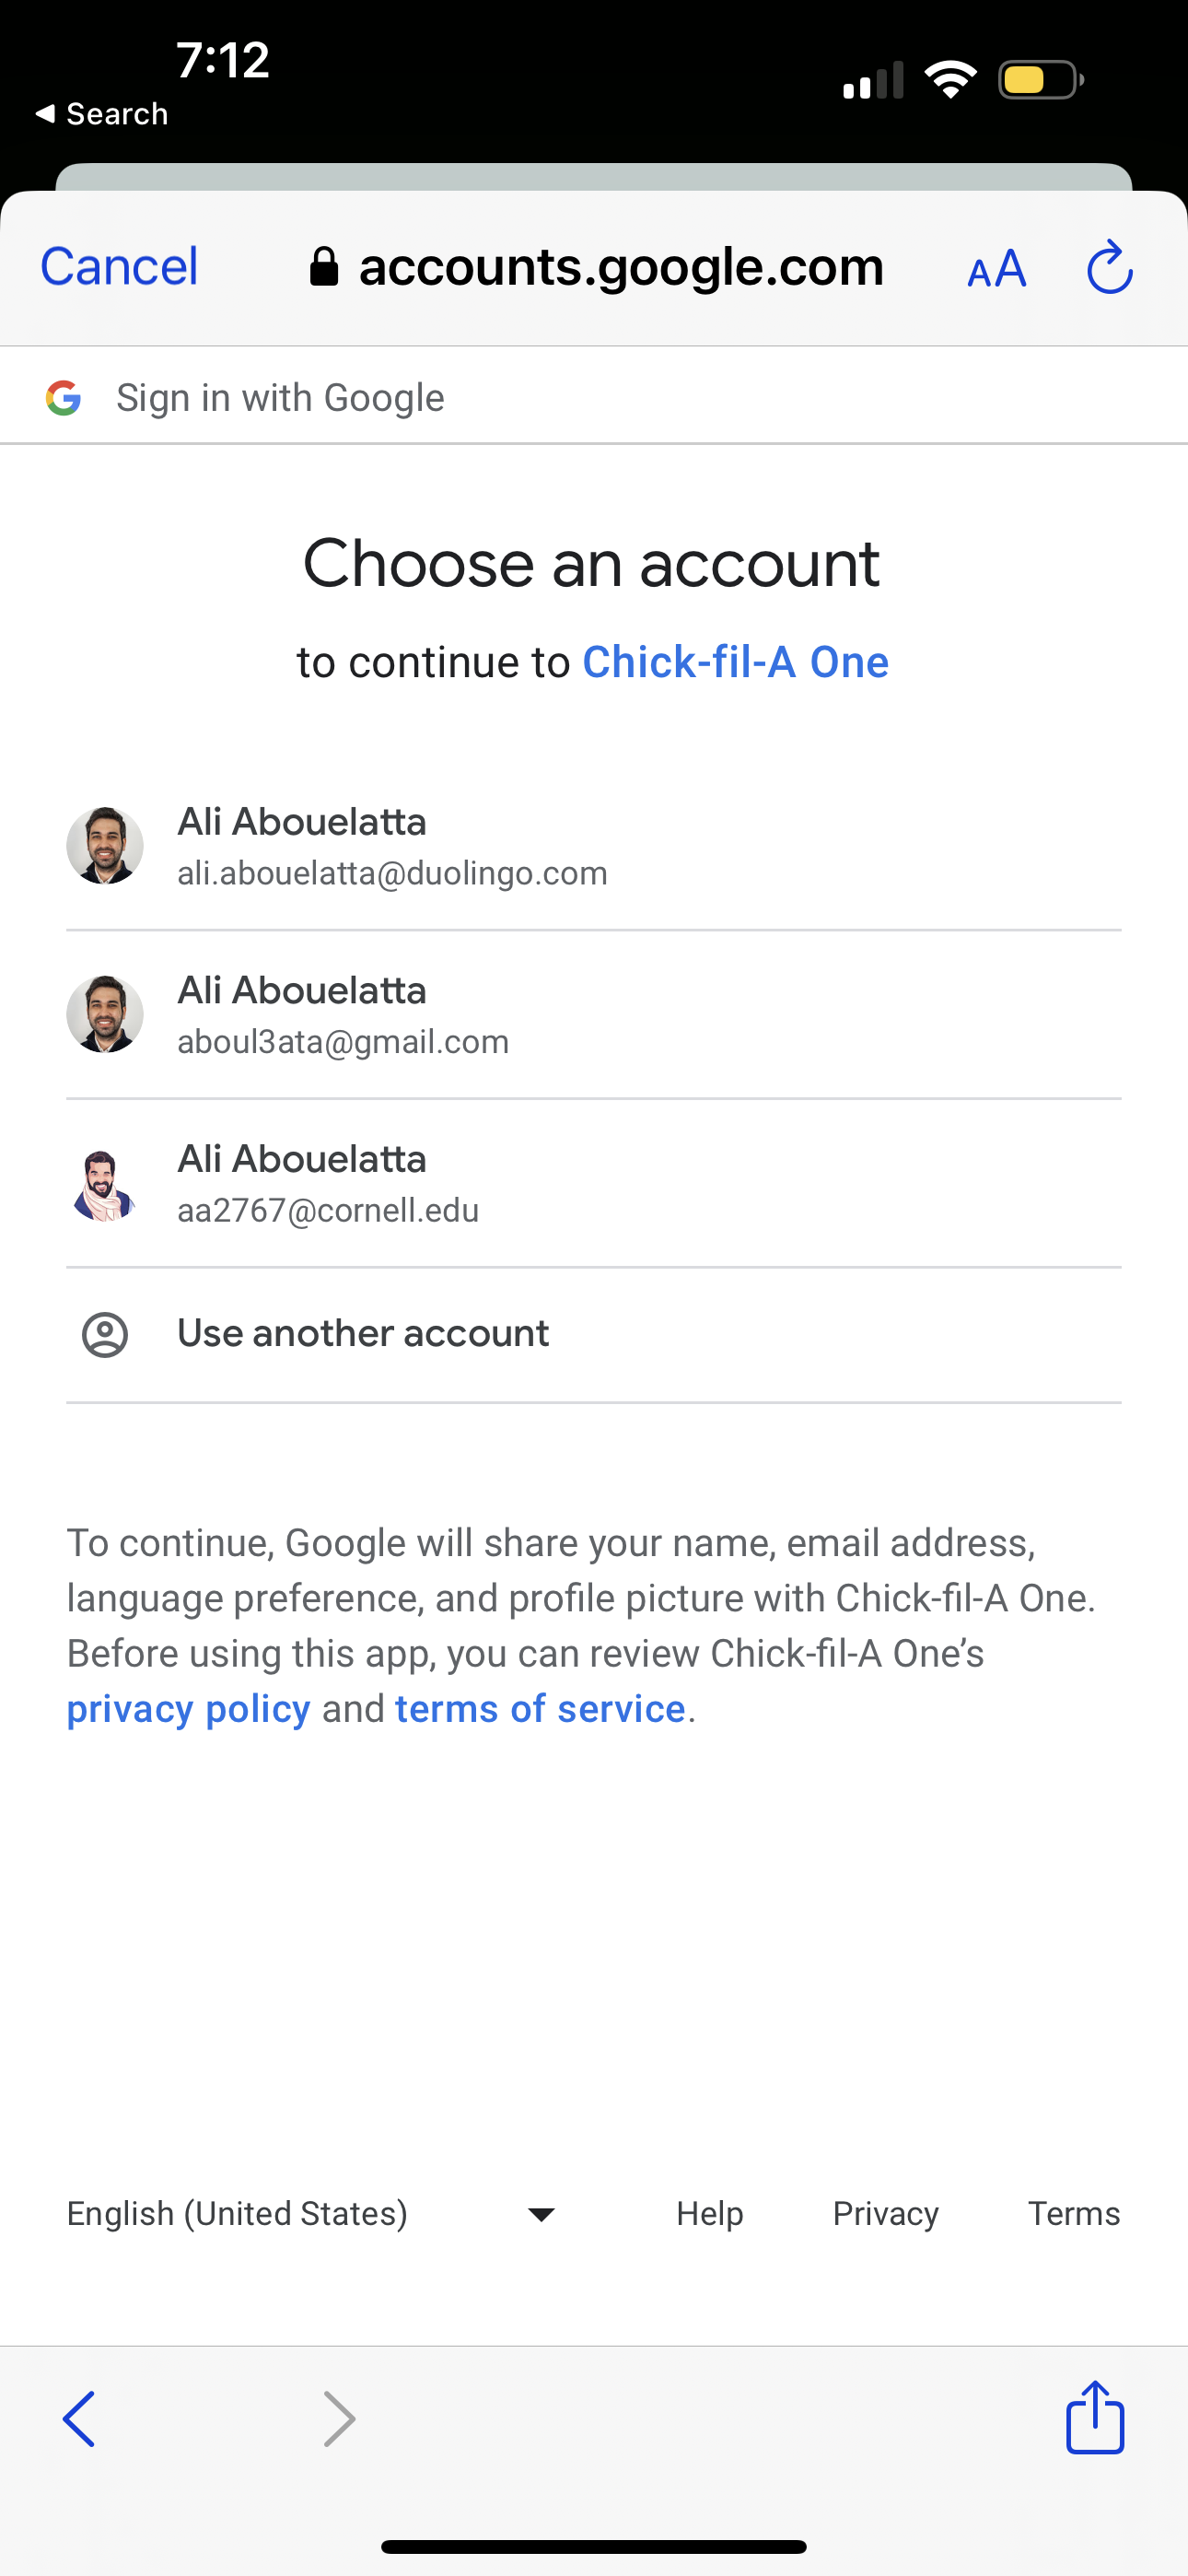
Chick Fil A1290 × 2796opens the full image 
Shine1206 × 2622opens the full image
The numbers
| # | Stat | Computed from |
|---|---|---|
| [1] | 6.8% (55 of 809) | prevalence_leaderboard: 55/809 |
| [2] | Streaks 11.6% (94), Celebration 11.9% (96), Leaderboard 6.8% (55) | prevalence_streaks, prevalence_progress_celebration, prevalence_leaderboard |
Methodology
Universe: 809 apps with >=1 captured screen. Method: COUNT(DISTINCT company_name) where any tag matches '%leaderboard%'. July 2026. Caveat: captured screens only; small numerator.
Sources
- [1]
Lazyweb Research analysis of 809 mobile apps (809 mobile apps with >=1 captured screen; 751 with tag data; median 41 screens/app), July 2026
Prevalence = COUNT(DISTINCT company_name) over LLM synonym tags; denominator is 809 tracked apps (reported conservatively over all apps-with-screens, not the 62,376-row companies table). Lower bound: only reflects screens Lazyweb captured (median 41/app).
Source: Lazyweb Research — proprietary analysis of real, in-market app screens. Cite as Lazyweb Research, 2026-07-07.