How Many Steps Come Before the Paywall in Onboarding?
- By Ali Abouelatta
- n = 40
- Published
- Updated
- 2 min read
- paywall · onboarding · monetization · ux-patterns · mobile
Short answer
Across 40 onboarding flows with a paywall tracked by Lazyweb Research, the first paywall arrives at a median of step 11 and a mean of step 14.3, in flows averaging 17.2 steps source[1]. In other words, users typically complete around 10 onboarding steps before they hit the offer. The paywall is a late, not early, event.
Users complete a median of 10 onboarding steps before the first paywall (median paywall at step 11 of ~17), Lazyweb Research, July 2026 (N=40).
Bar chart · Total steps
Total steps — Step counts in real flows
One block is about 1.6 Total steps
- Headspace
- 17
- Strava
- 22
- Babbel
- 30
- MyFitnessPal
- 25
- Elevate
- 40
- Finch
- 46
The finding
The first paywall appears at a mean absolute step of 14.3 and a median of step 11, in onboarding flows that average 17.2 steps source[1]. So the typical user answers roughly ten screens of onboarding before seeing the paywall. On a relative basis that is 0.82 of the way through the flow source[2].
Step counts in real flows
| App | Total steps | First paywall step |
|---|---|---|
| Headspace | 17 | 11 |
| Strava | 22 | 18 |
| Babbel | 30 | 27 |
| MyFitnessPal | 25 | 23 |
| Elevate | 40 | 33 |
| Finch | 46 | 31 |
Longer flows push the paywall deep — Elevate at step 33 and Finch at step 31 source[3].
How to apply it
If your onboarding is short (under ~10 steps), a paywall near the end still means only a handful of screens of build-up; if it is long, the corpus shows apps are comfortable making users work through 20-30 steps first. Flows that include a paywall are also longer overall — 17.2 steps on average versus 12.4 for flows without one source[4] — so a paywall tends to accompany a more elaborate onboarding, not a bare one.
Caveats
N is 40 flows; absolute steps are counted with ROW_NUMBER, not raw step values source[1]. Very long flows like Finch (46 steps) pull the mean up, which is why the median (step 11) is the more representative figure.
Real in-market screens
Screens from real, in-market apps, tracked by Lazyweb Research.
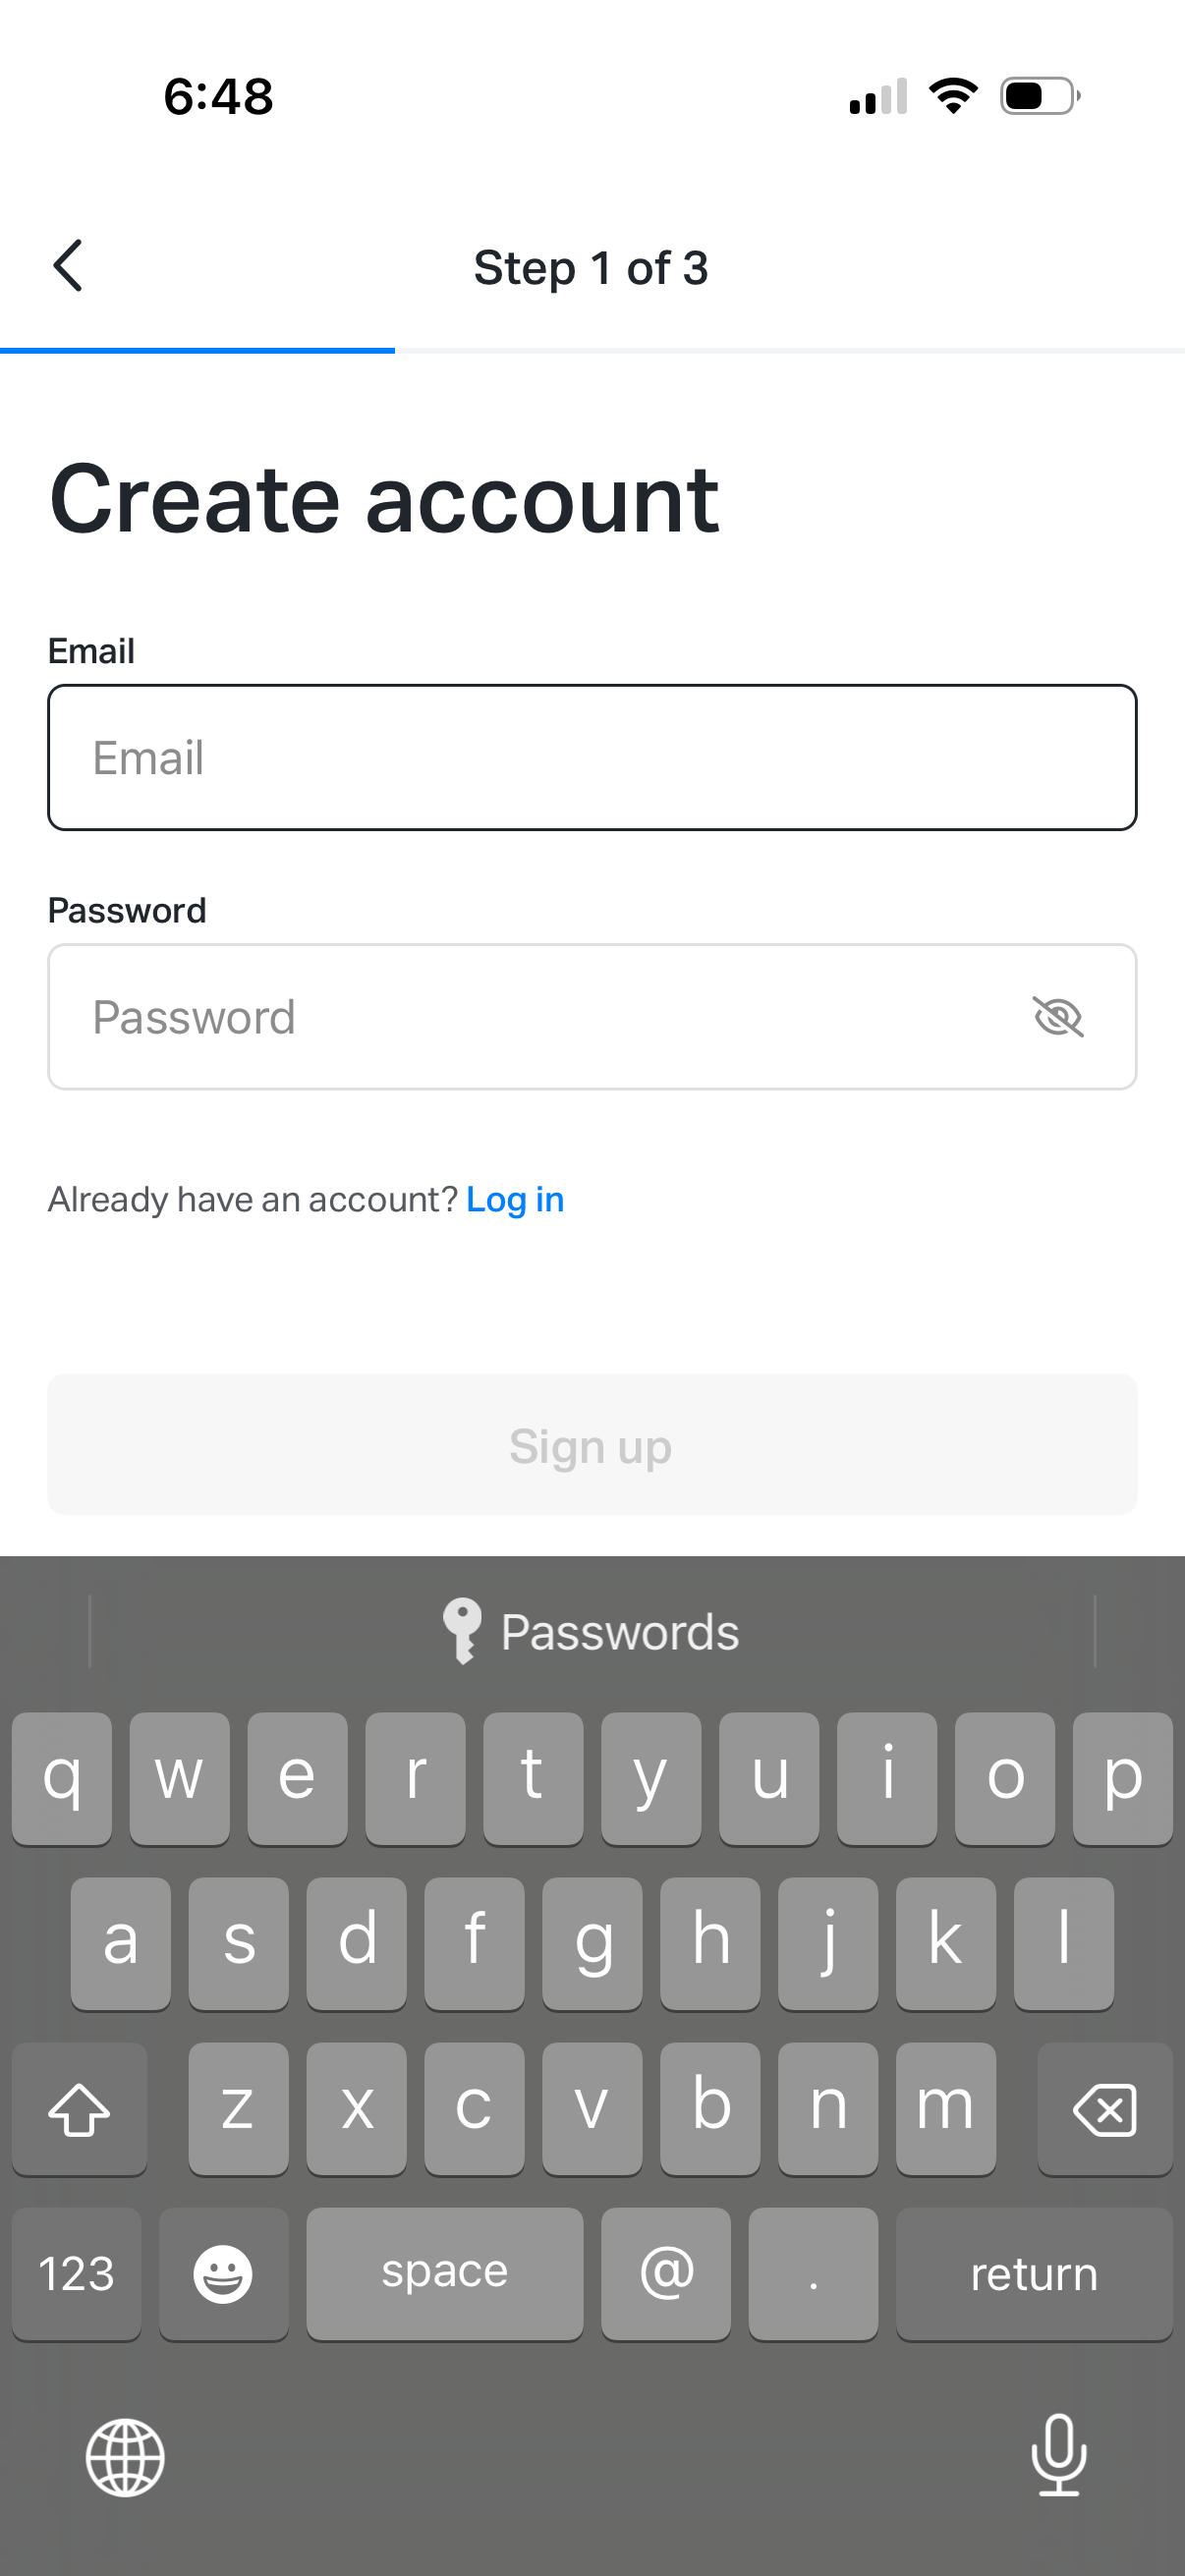
Koyfin1206 × 2622opens the full image 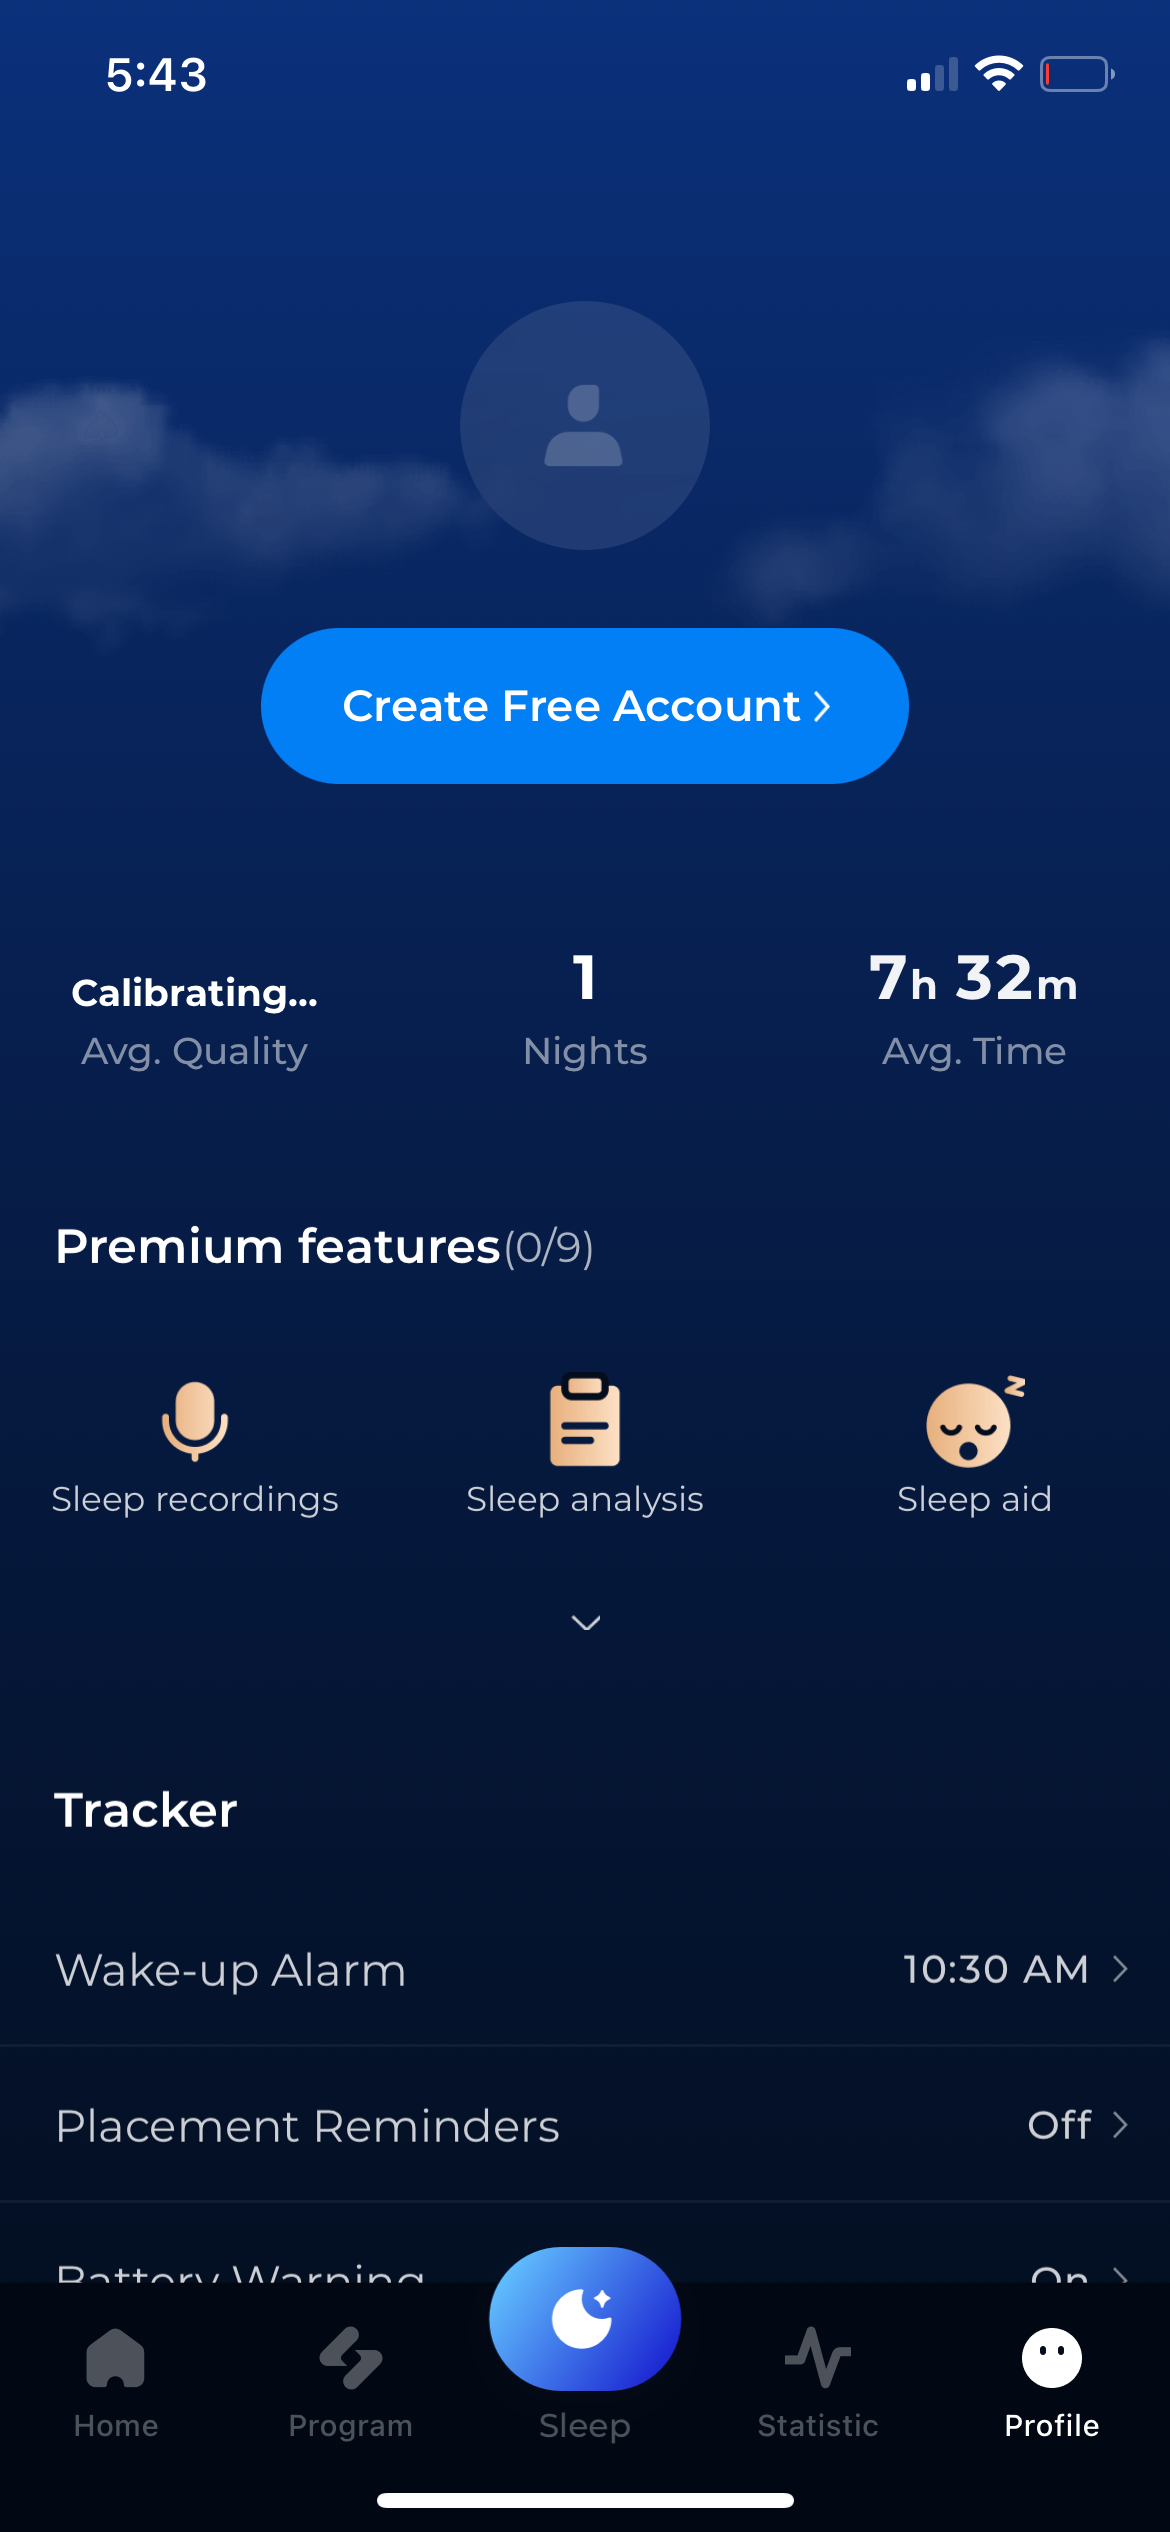
Shuteye1170 × 2532opens the full image 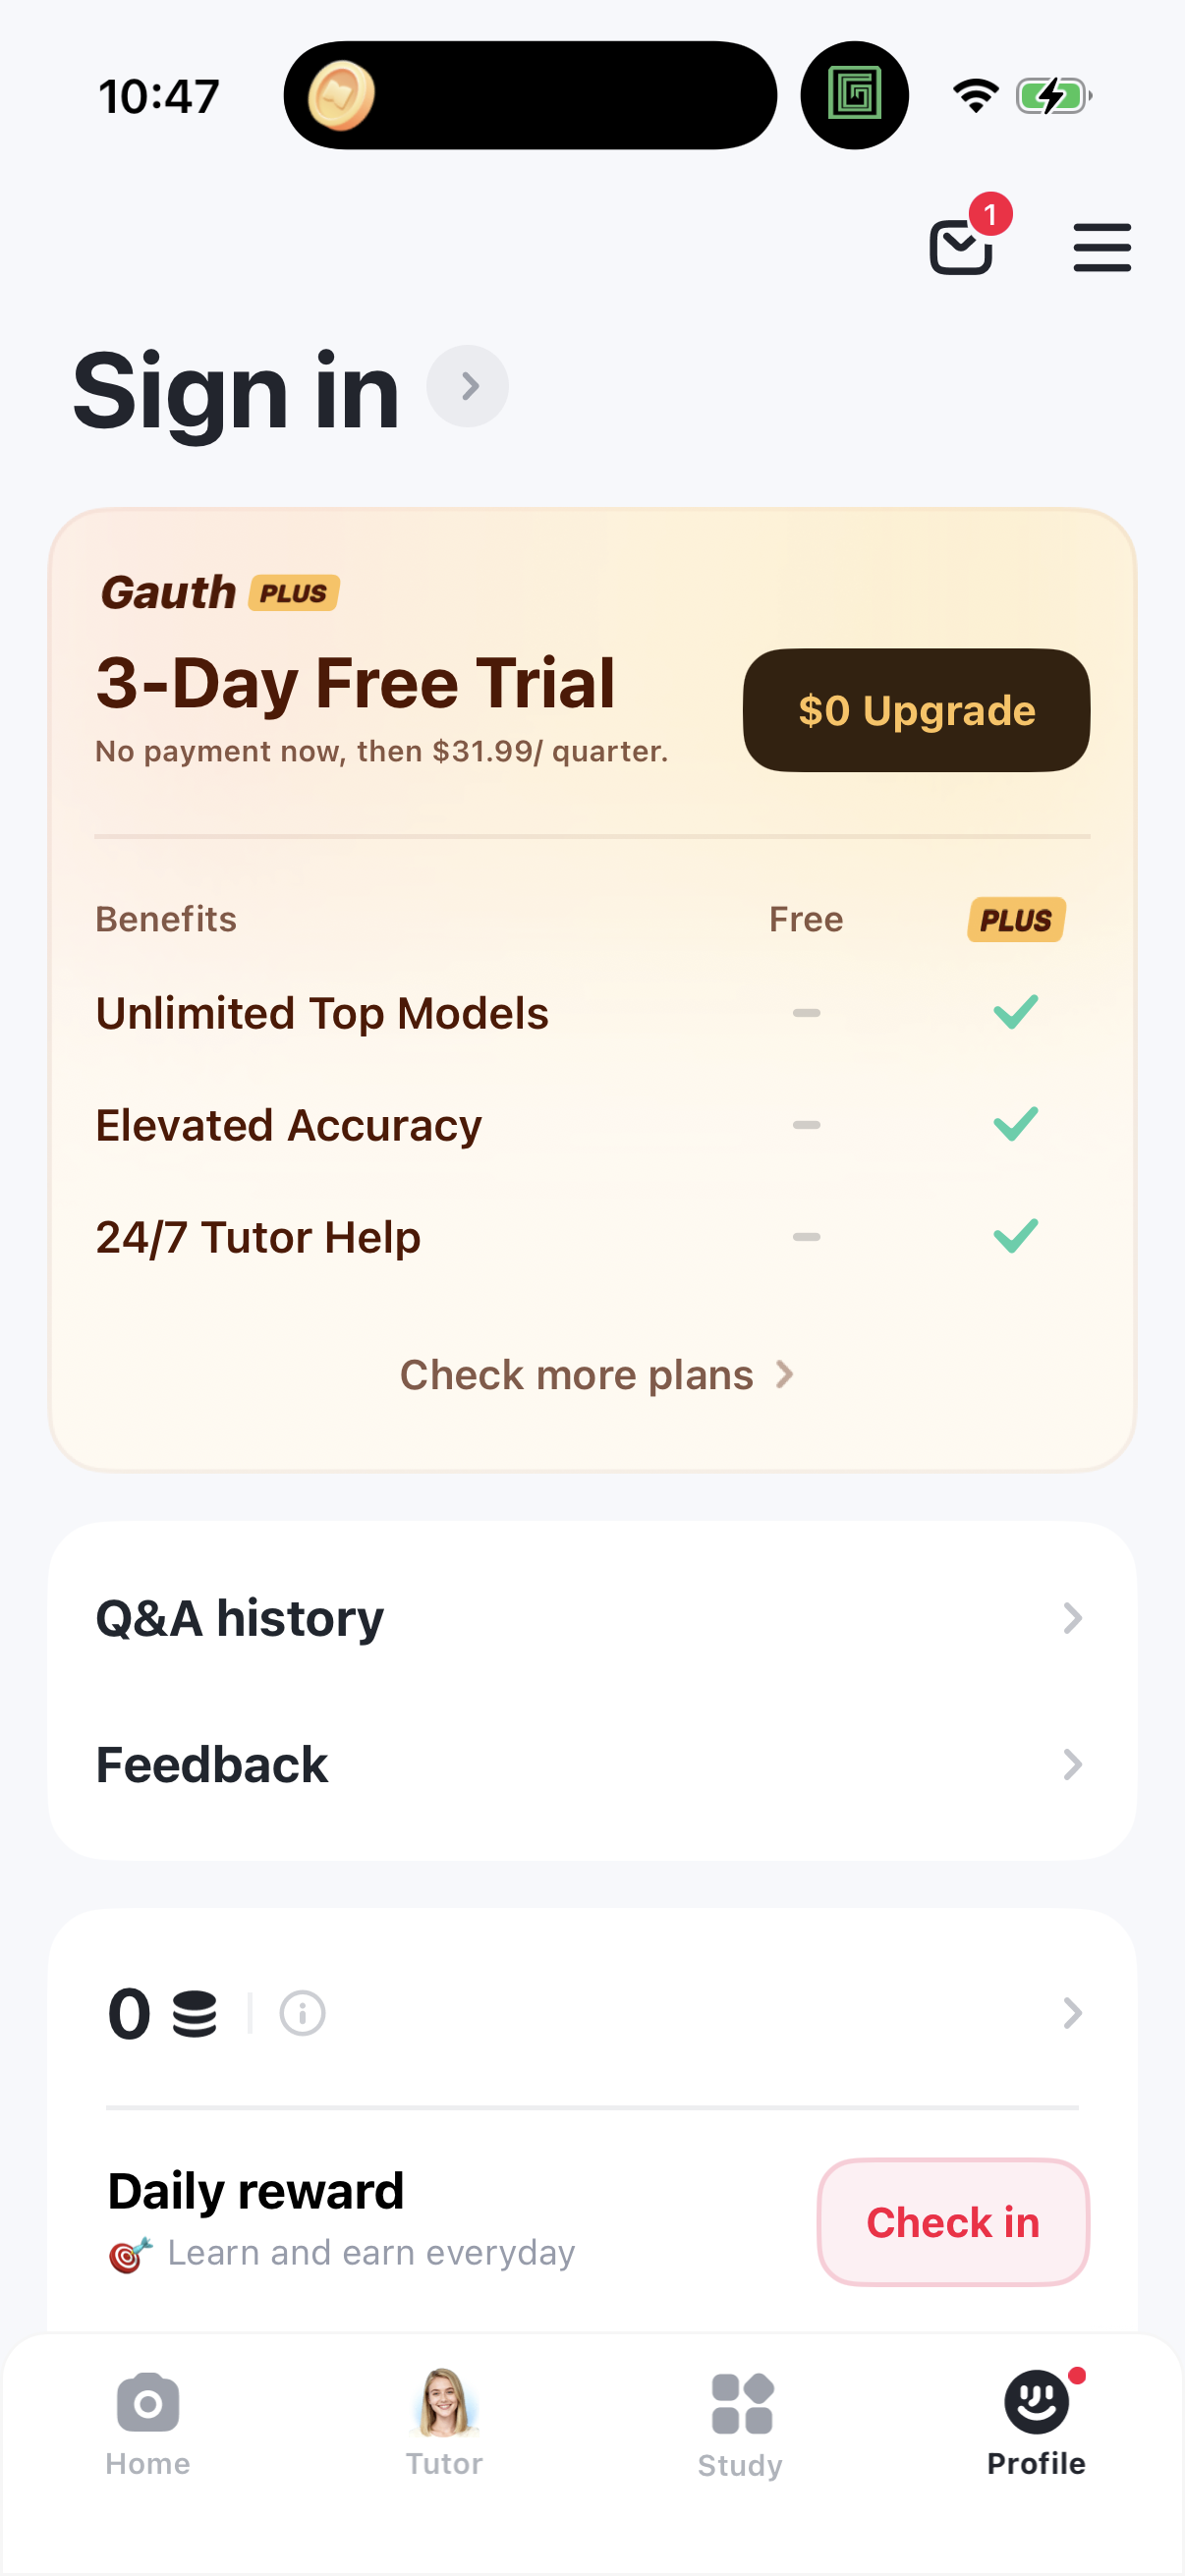
Gauth1206 × 2622opens the full image 
Wonder1170 × 2532opens the full image
The numbers
| # | Stat | Computed from |
|---|---|---|
| [1] | first paywall mean step 14.3, median step 11, avg 17.2-step flow | first_paywall_absolute_step |
| [2] | first paywall mean relative position 0.822 | first_paywall_relative_position |
| [3] | Headspace 11/17, Strava 18/22, Babbel 27/30, MyFitnessPal 23/25, Elevate 33/40, Finch 31/46 | qualitative |
| [4] | flows with paywall avg 17.2 steps vs 12.4 without | flow_length_with_vs_without_paywall |
Methodology
Universe: 40 onboarding flows with a paywall across ~800 tracked apps, July 2026; steps counted via ROW_NUMBER. Caveat: N=40 and long flows skew the mean, so median is preferred.
Sources
- [1]
Lazyweb Research analysis of 40 onboarding flows (~800 tracked apps), July 2026
Absolute first-paywall step via ROW_NUMBER; mean/median and mean flow length.
- [2]
Lazyweb Research analysis of 40 onboarding flows (~800 tracked apps), July 2026
Mean relative first-paywall position.
- [3]
Lazyweb Research qualitative review of onboarding flows (~800 tracked apps), July 2026
Per-company total steps and first-paywall step.
- [4]
Lazyweb Research analysis of 129 onboarding flows (~800 tracked apps), July 2026
Average flow length for flows with vs without a paywall.
Source: Lazyweb Research — proprietary analysis of real, in-market app screens. Cite as Lazyweb Research, 2026-07-07.