Are Onboarding Flows With a Paywall Longer Than Those Without?
- By Ali Abouelatta
- n = 129
- Published
- Updated
- 2 min read
- paywall · onboarding · ux-patterns · monetization · design
Short answer
Across 129 onboarding flows tracked by Lazyweb Research, flows that include a paywall average 17.2 steps (median 14) versus 12.4 steps (median 10) for flows without one source[1]. Paywalled onboarding is meaningfully longer — about 5 extra steps on average. The extra length is where personalization and value-building happen before the offer.
Onboarding flows with a paywall average 17.2 steps vs 12.4 without, Lazyweb Research, July 2026 (N=129).
The finding
The 40 onboarding flows that include a paywall average 17.2 steps with a median of 14; the 89 without a paywall average 12.4 steps with a median of 10 source[1]. That is a gap of roughly 5 steps on the mean and 4 on the median — paywalled flows are consistently longer.
With vs without a paywall
| Onboarding flows | Count | Avg steps | Median steps |
|---|---|---|---|
| With paywall | 40 | 17.2 | 14 |
| Without paywall | 89 | 12.4 | 10 |
The first paywall itself sits at a median of step 11 source[2], so most of the extra length precedes the offer, not follows it.
How to apply it
If you are adding an in-onboarding paywall, expect (and design for) a longer flow: the corpus pattern is to invest more steps in qualification and personalization, then present the paywall late. A very short onboarding with a paywall bolted on is atypical. Budget for the extra screens that justify the ask.
Caveats
This is correlation, not causation — longer flows may attract paywalls or vice versa, and the corpus has no conversion outcomes. Step counts use ROW_NUMBER; N is 129 flows split 40/89 source[1].
Real in-market screens
Screens from real, in-market apps, tracked by Lazyweb Research.

Roku1206 × 2622opens the full image 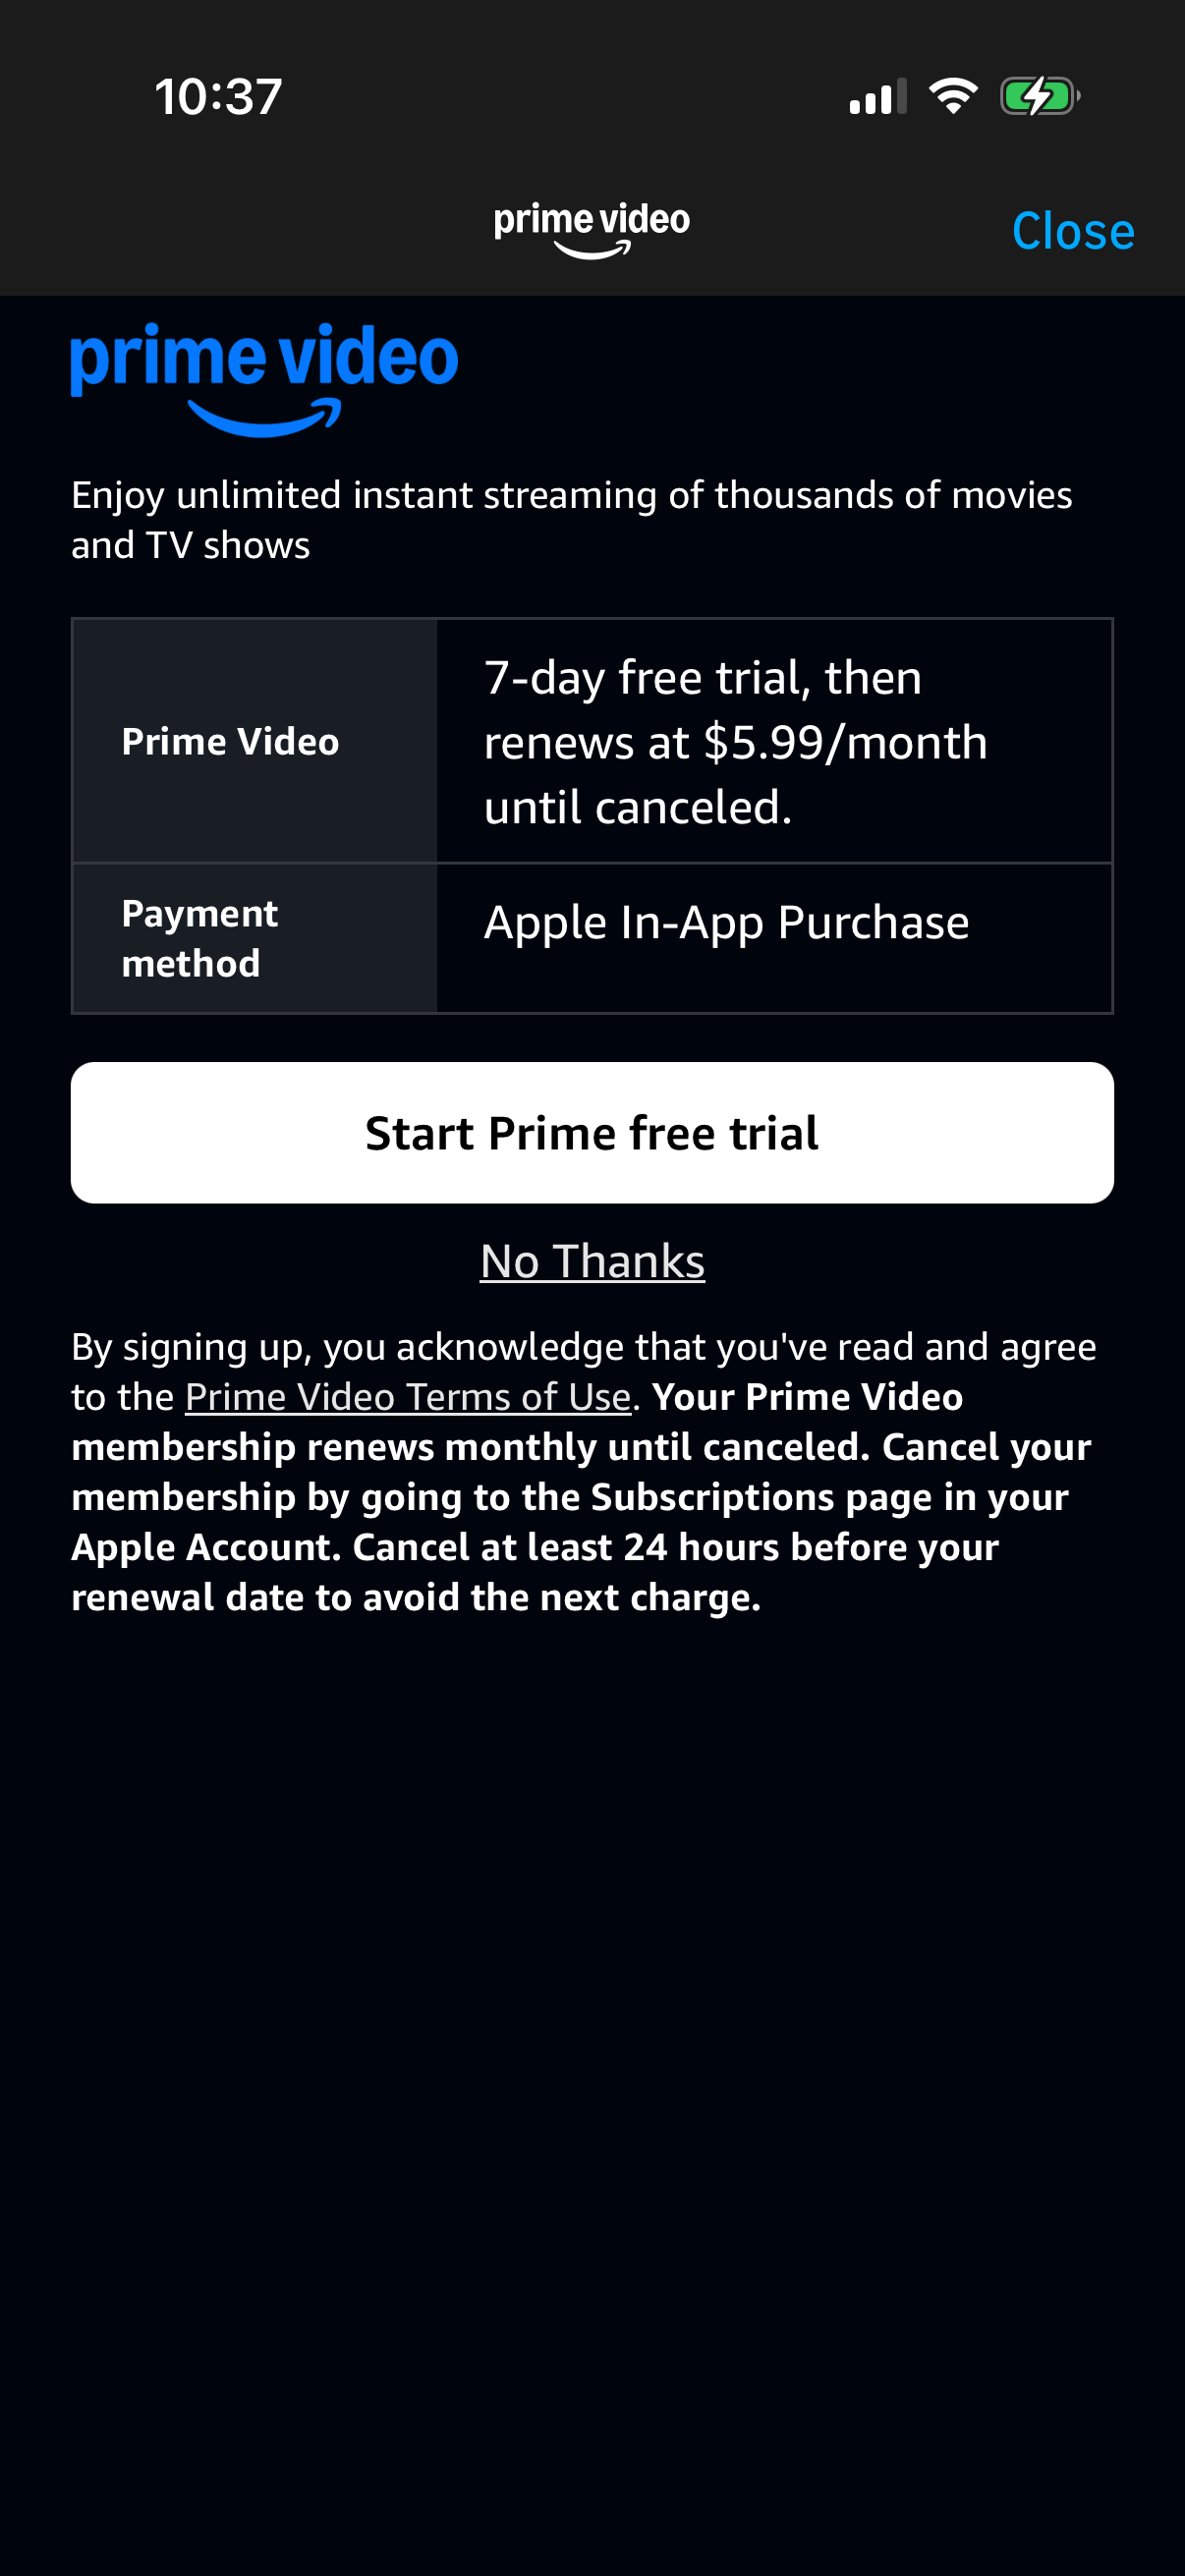
Prime Video1206 × 2622opens the full image 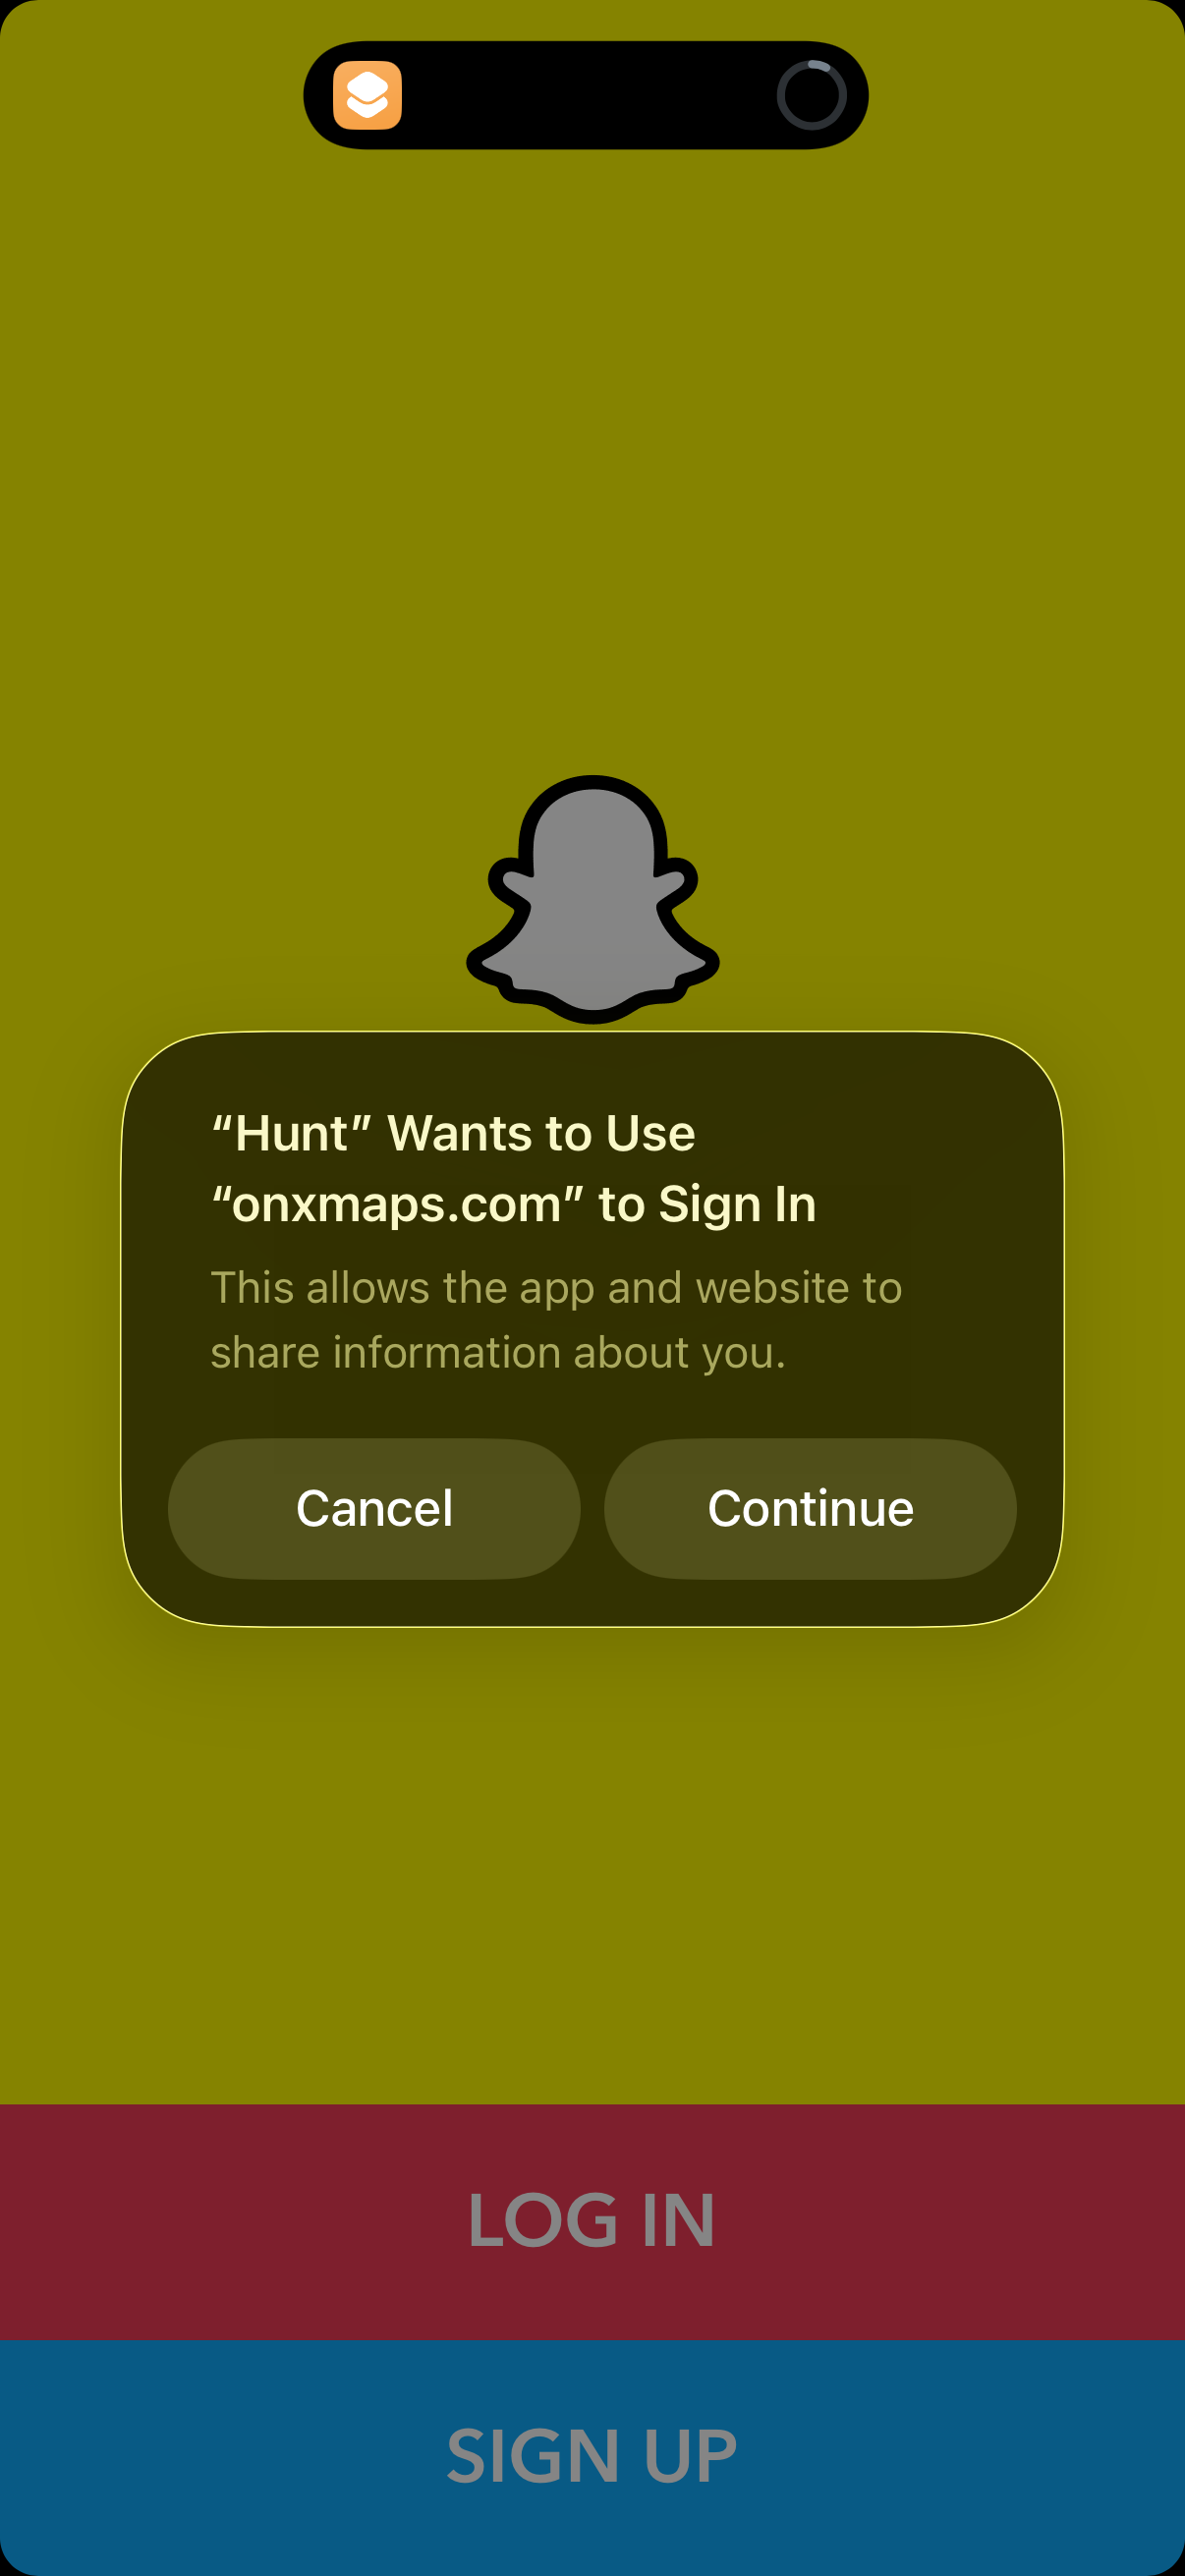
Snapchat1206 × 2622opens the full image 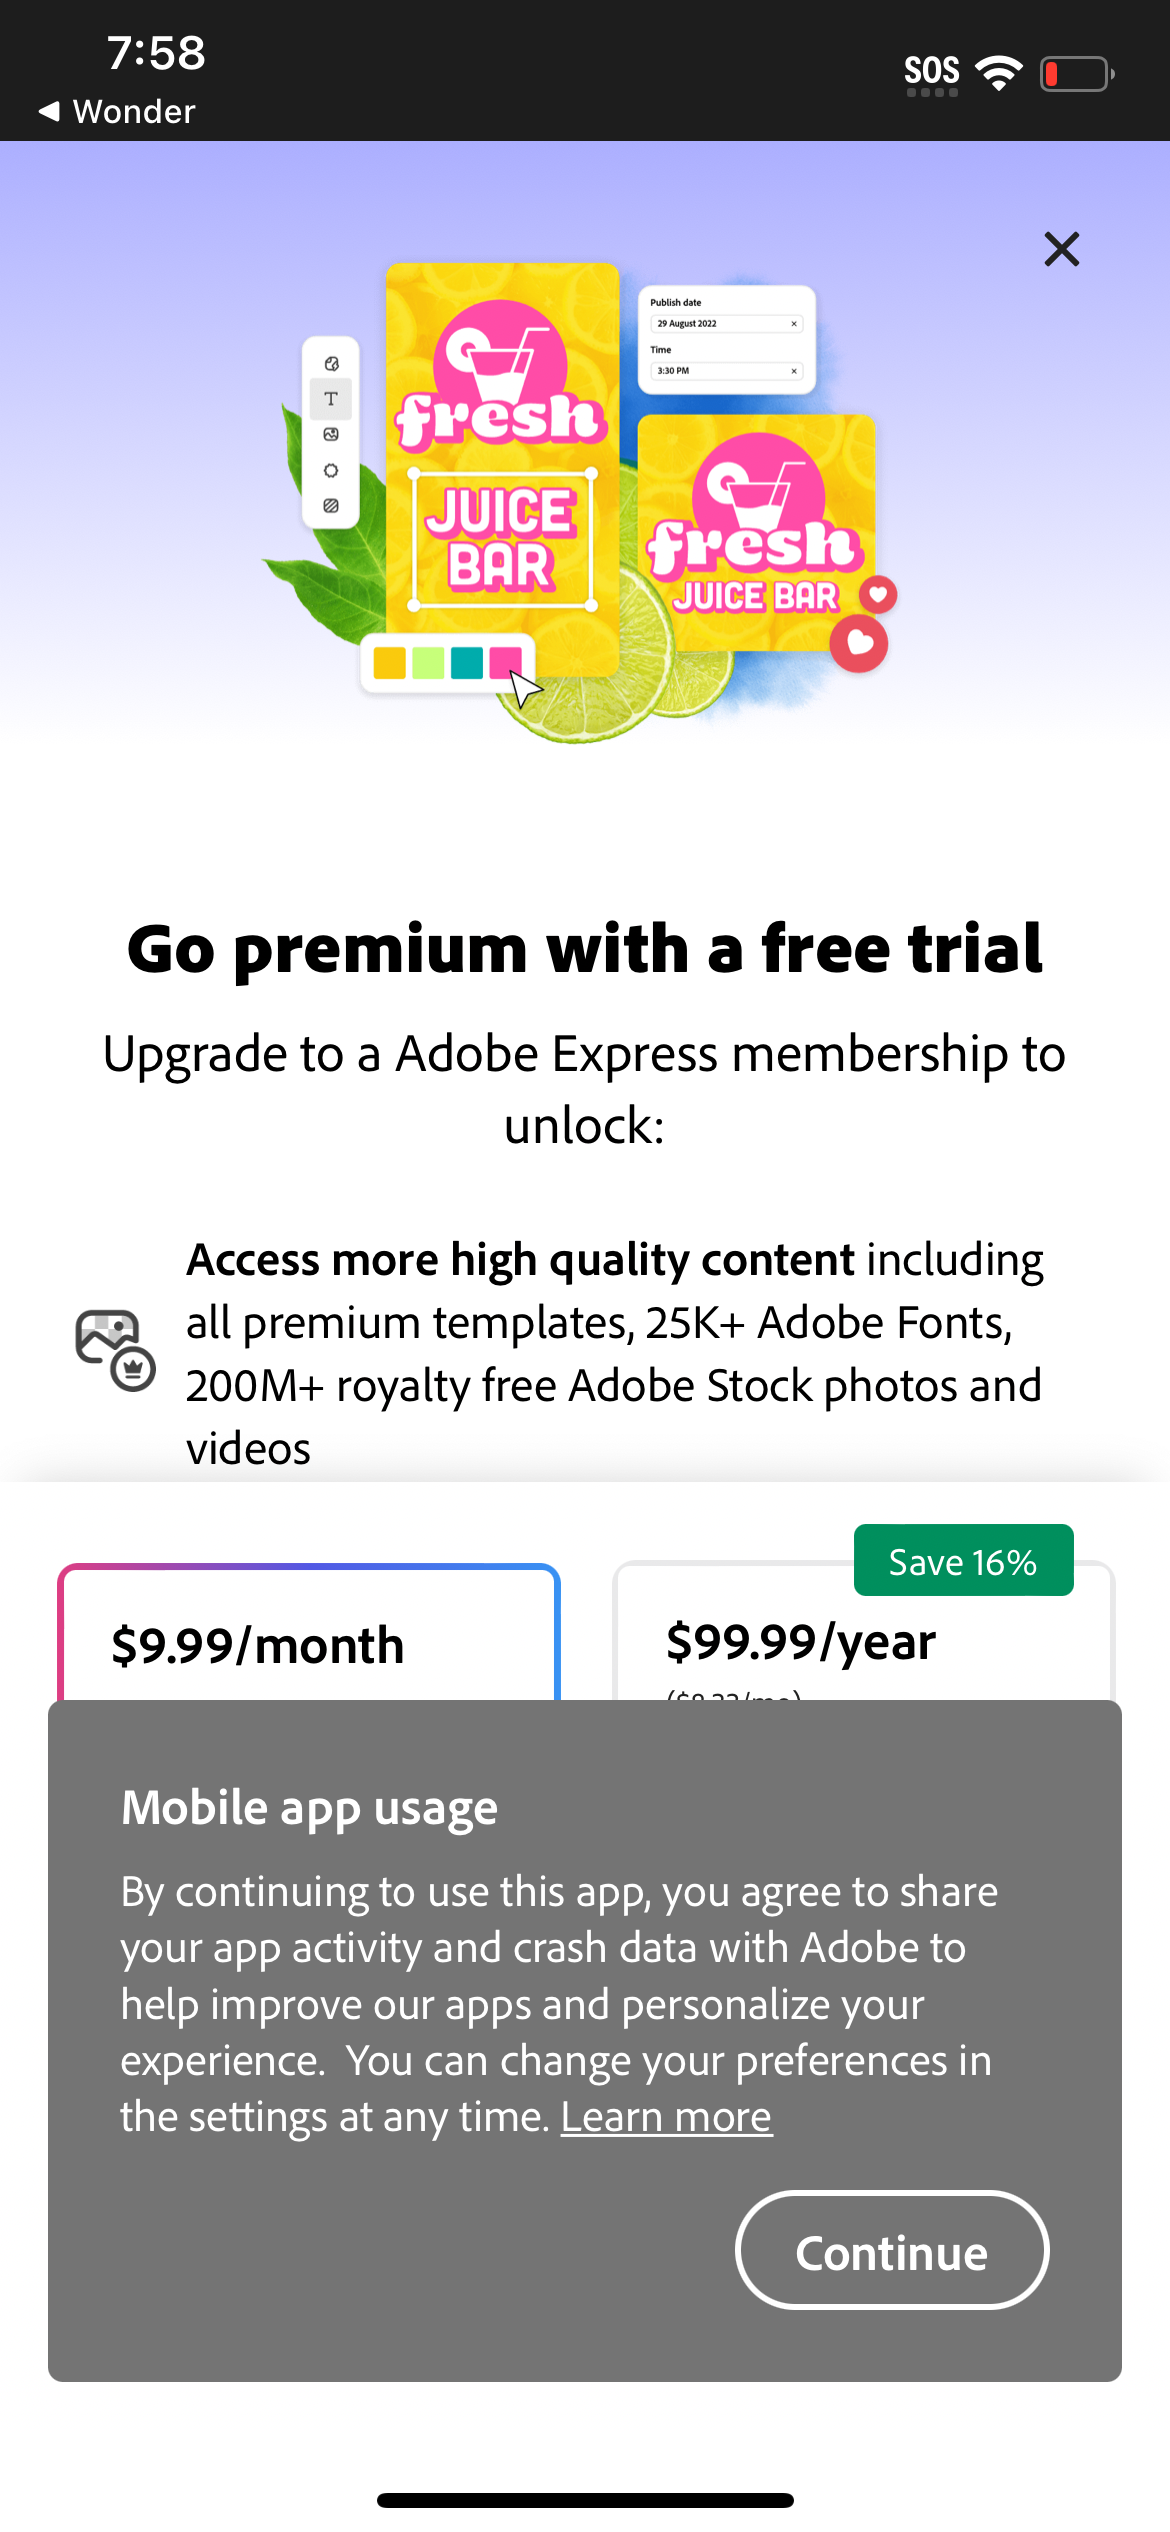
Adobe1170 × 2532opens the full image
The numbers
| # | Stat | Computed from |
|---|---|---|
| [1] | with paywall 17.2 avg / 14 median steps; without 12.4 avg / 10 median (40 vs 89 flows) | flow_length_with_vs_without_paywall |
| [2] | first paywall median step 11 | first_paywall_absolute_step |
Methodology
Universe: 129 onboarding flows (40 with paywall, 89 without) across ~800 tracked apps, July 2026; step counts via ROW_NUMBER. Caveat: correlational, no conversion data.
Sources
- [1]
Lazyweb Research analysis of 129 onboarding flows (~800 tracked apps), July 2026
Per-flow step count via ROW_NUMBER, grouped by whether the flow contains a paywall.
- [2]
Lazyweb Research analysis of 40 onboarding flows (~800 tracked apps), July 2026
Median absolute first-paywall step.
Source: Lazyweb Research — proprietary analysis of real, in-market app screens. Cite as Lazyweb Research, 2026-07-07.