Do Market Leaders Paywall Earlier or Later Than the Rest?
- By Ali Abouelatta
- n = 66
- Published
- Updated
- 2 min read
- paywall · onboarding · monetization · experiments · saas
Short answer
Among 66 onboarding flows tracked by Lazyweb Research that map to a market-leader label, leaders paywall at a similar rate but noticeably earlier: 12 of 35 leader flows carry a paywall at an average first-paywall position of 0.75, versus 10 of 31 non-leader flows at 0.91 source[1]. So the rate is comparable (34% vs 32%), but leaders surface the offer sooner in the flow.
Market leaders place the first onboarding paywall at avg position 0.75 vs 0.91 for the rest, Lazyweb Research, July 2026 (35 vs 31 flows).
The finding
For companies labeled market_leader='Yes', 12 of 35 onboarding flows contain a paywall (34%), with the first paywall at an average relative position of 0.751 source[1]. For market_leader='No', 10 of 31 onboarding flows contain a paywall (32%), with the first paywall at 0.905 source[1]. Same rate, roughly; leaders paywall about 15 points earlier in the flow.
Leaders vs the rest
| Segment | Flows | With paywall | Rate | First paywall position |
|---|---|---|---|---|
| Market leaders | 35 | 12 | 34% | 0.751 |
| The rest | 31 | 10 | 32% | 0.905 |
Only 66 of 129 onboarding flows carry a Yes/No leader label; the remainder are Unknown or NULL source[1]source[2], so read this as directional.
How to apply it
If you benchmark against category leaders, expect them to present the paywall somewhat earlier — closer to three-quarters through onboarding than at the very end. That is consistent with confident products that front-load value quickly and then monetize. But the decision to include a paywall at all is not what separates leaders from the rest; both groups paywall about one flow in three source[1].
Caveats
Small, partially-labeled samples (35 and 31 flows); cite absolute counts alongside percentages. The leader label comes from companies.market_leader, which is Unknown/NULL for 63 of 129 onboarding flows source[2].
Real in-market screens
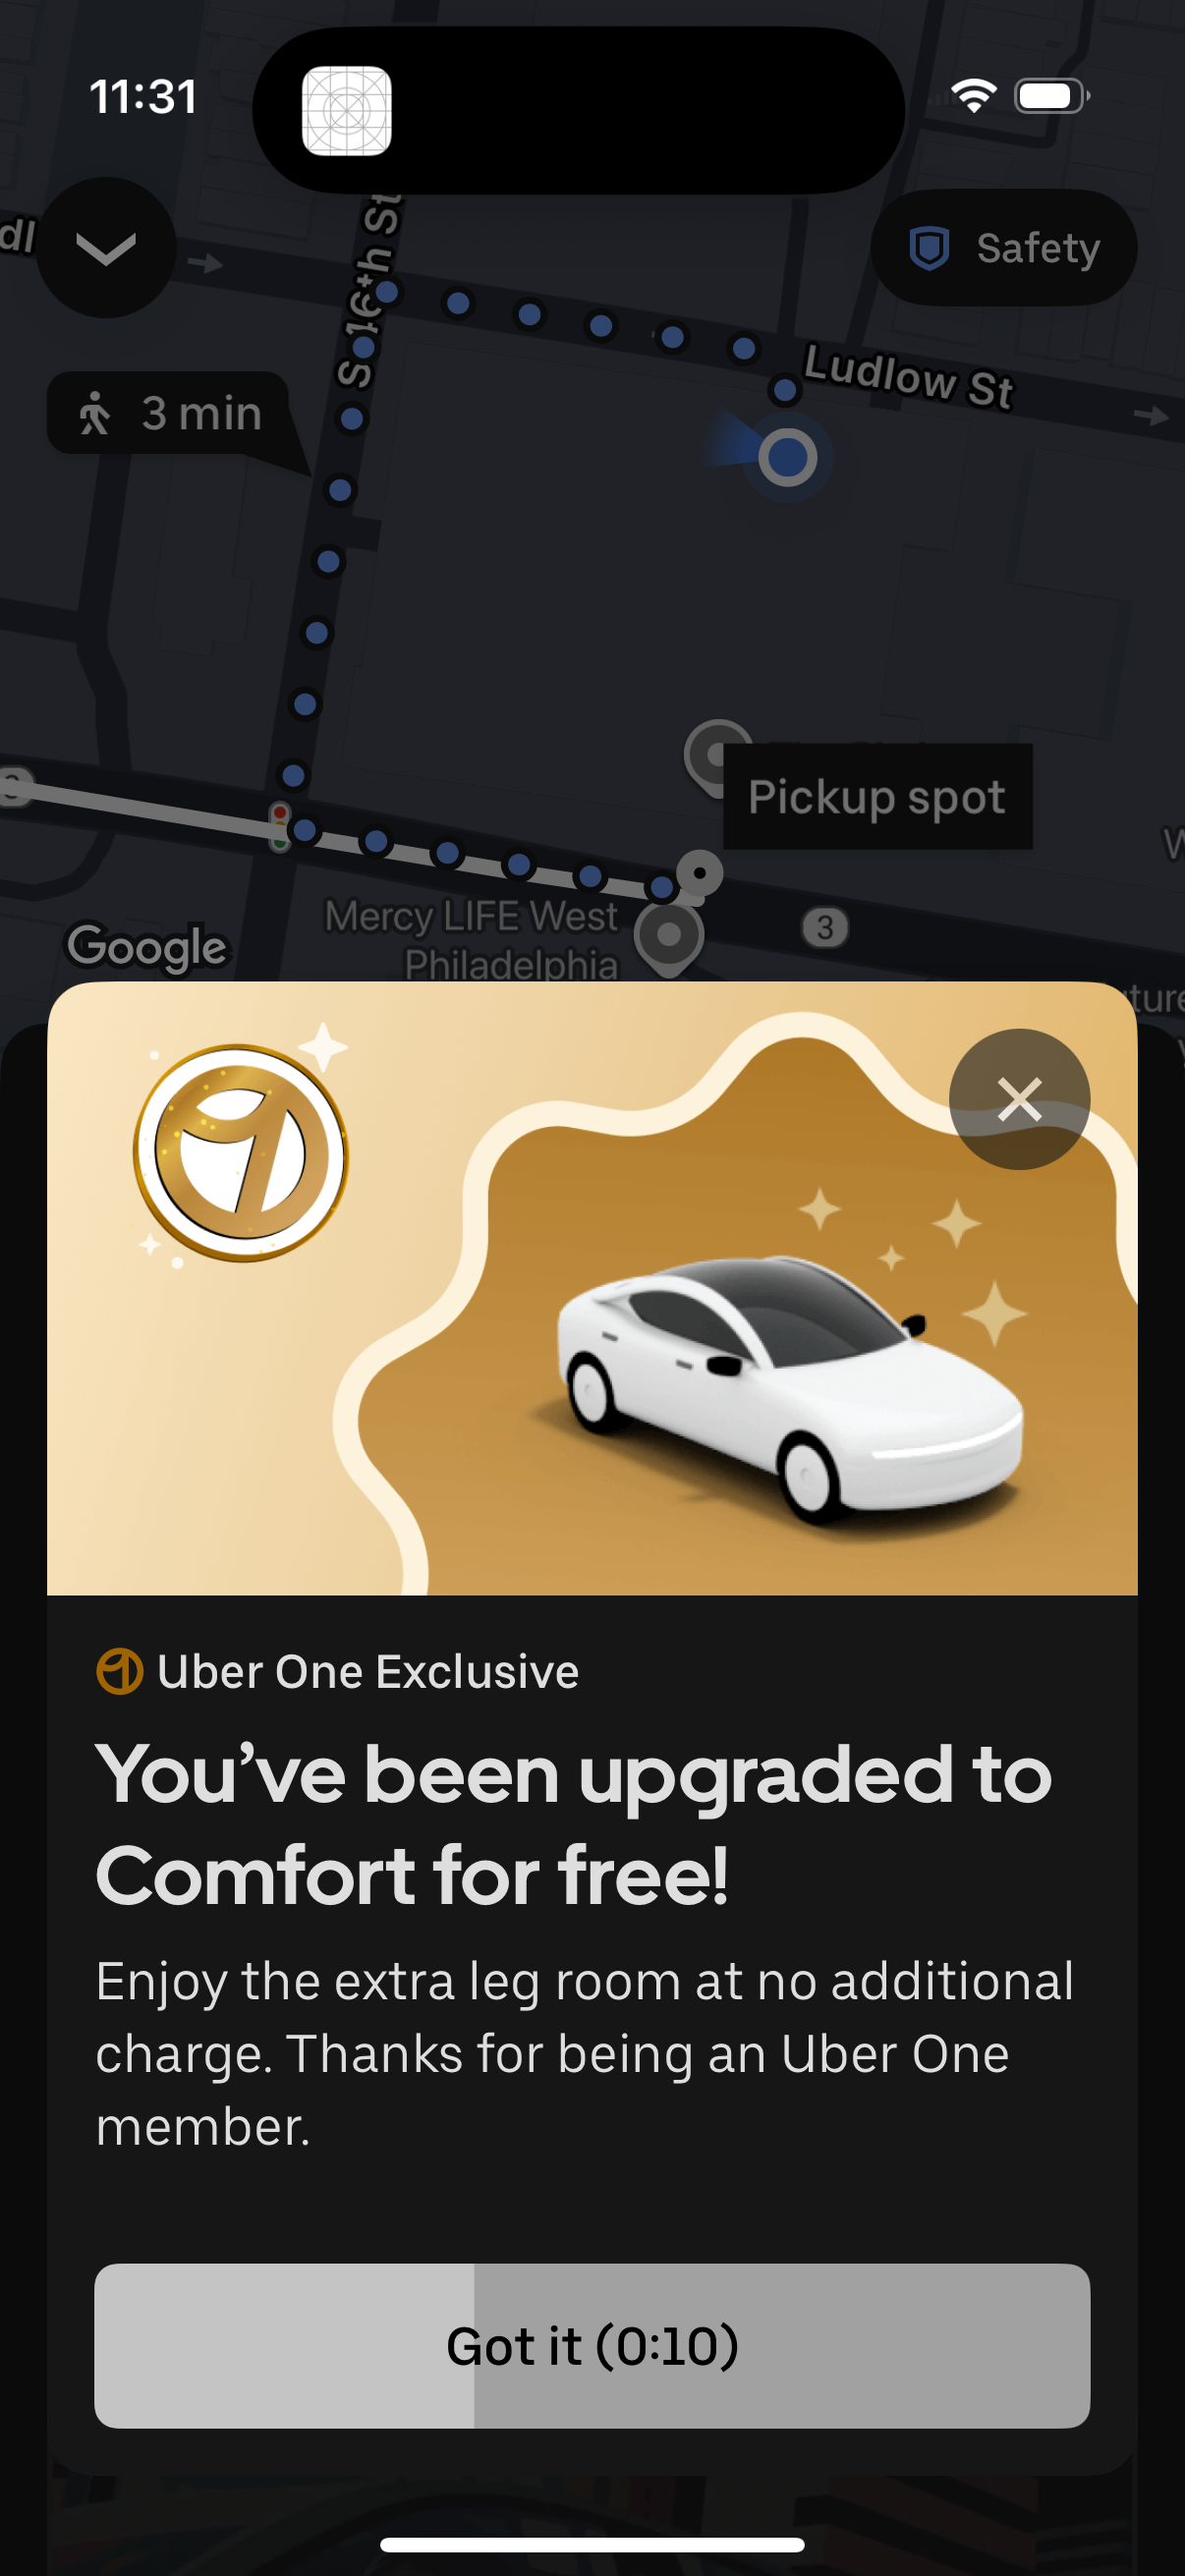
Screens from real, in-market apps, tracked by Lazyweb Research.
Uber1206 × 2622opens the full image 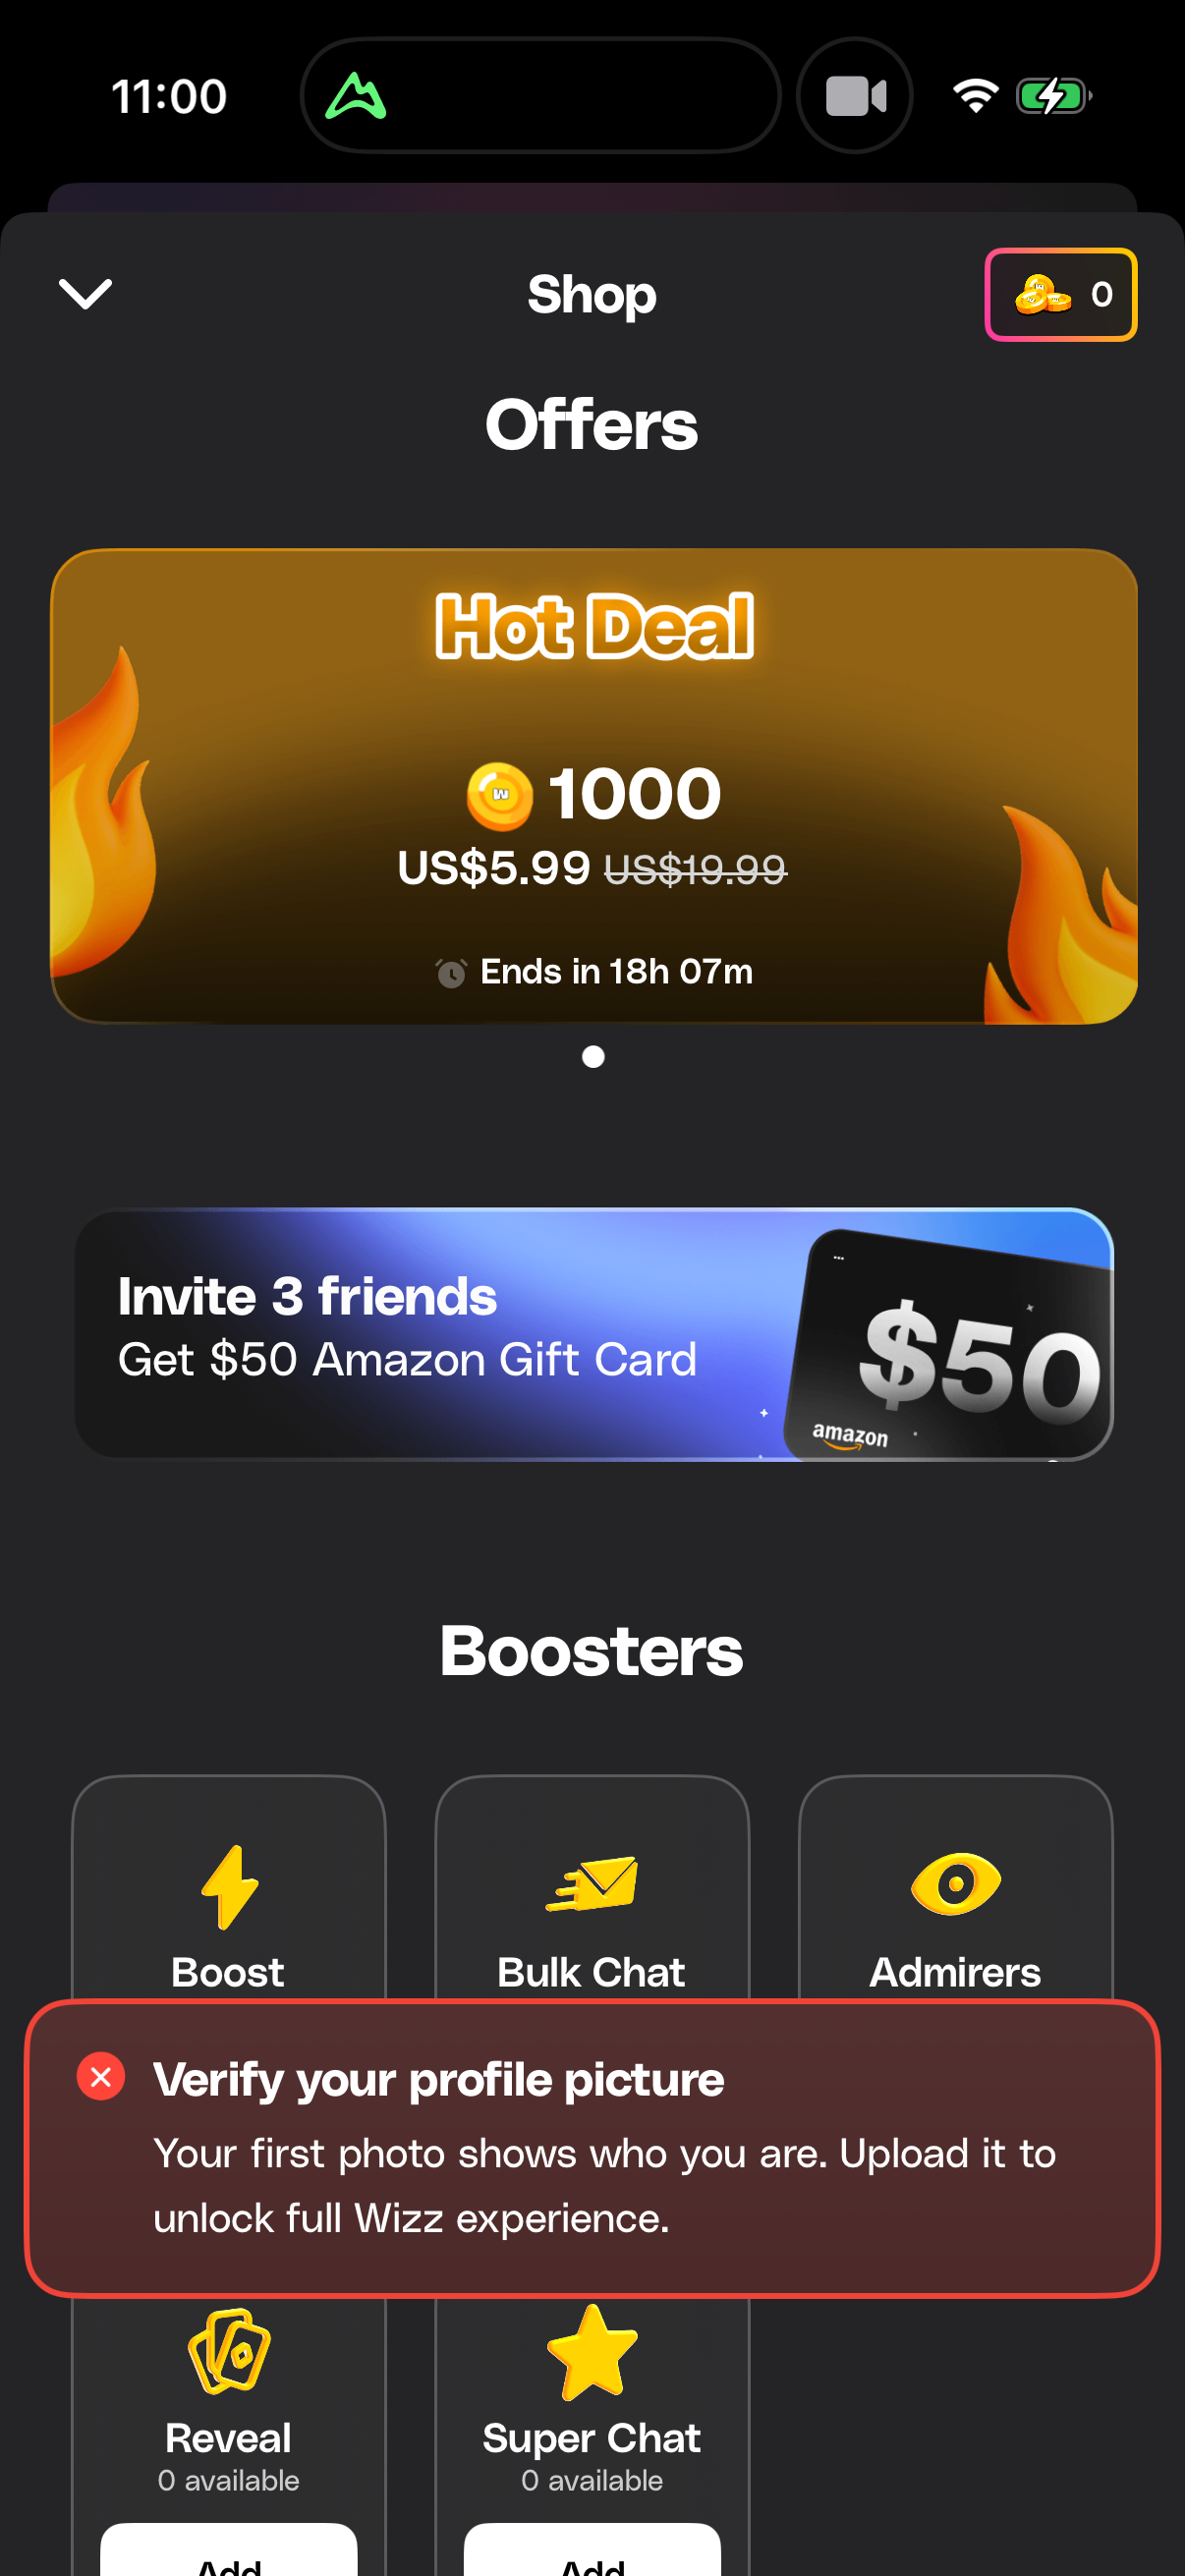
Wizz1206 × 2622opens the full image 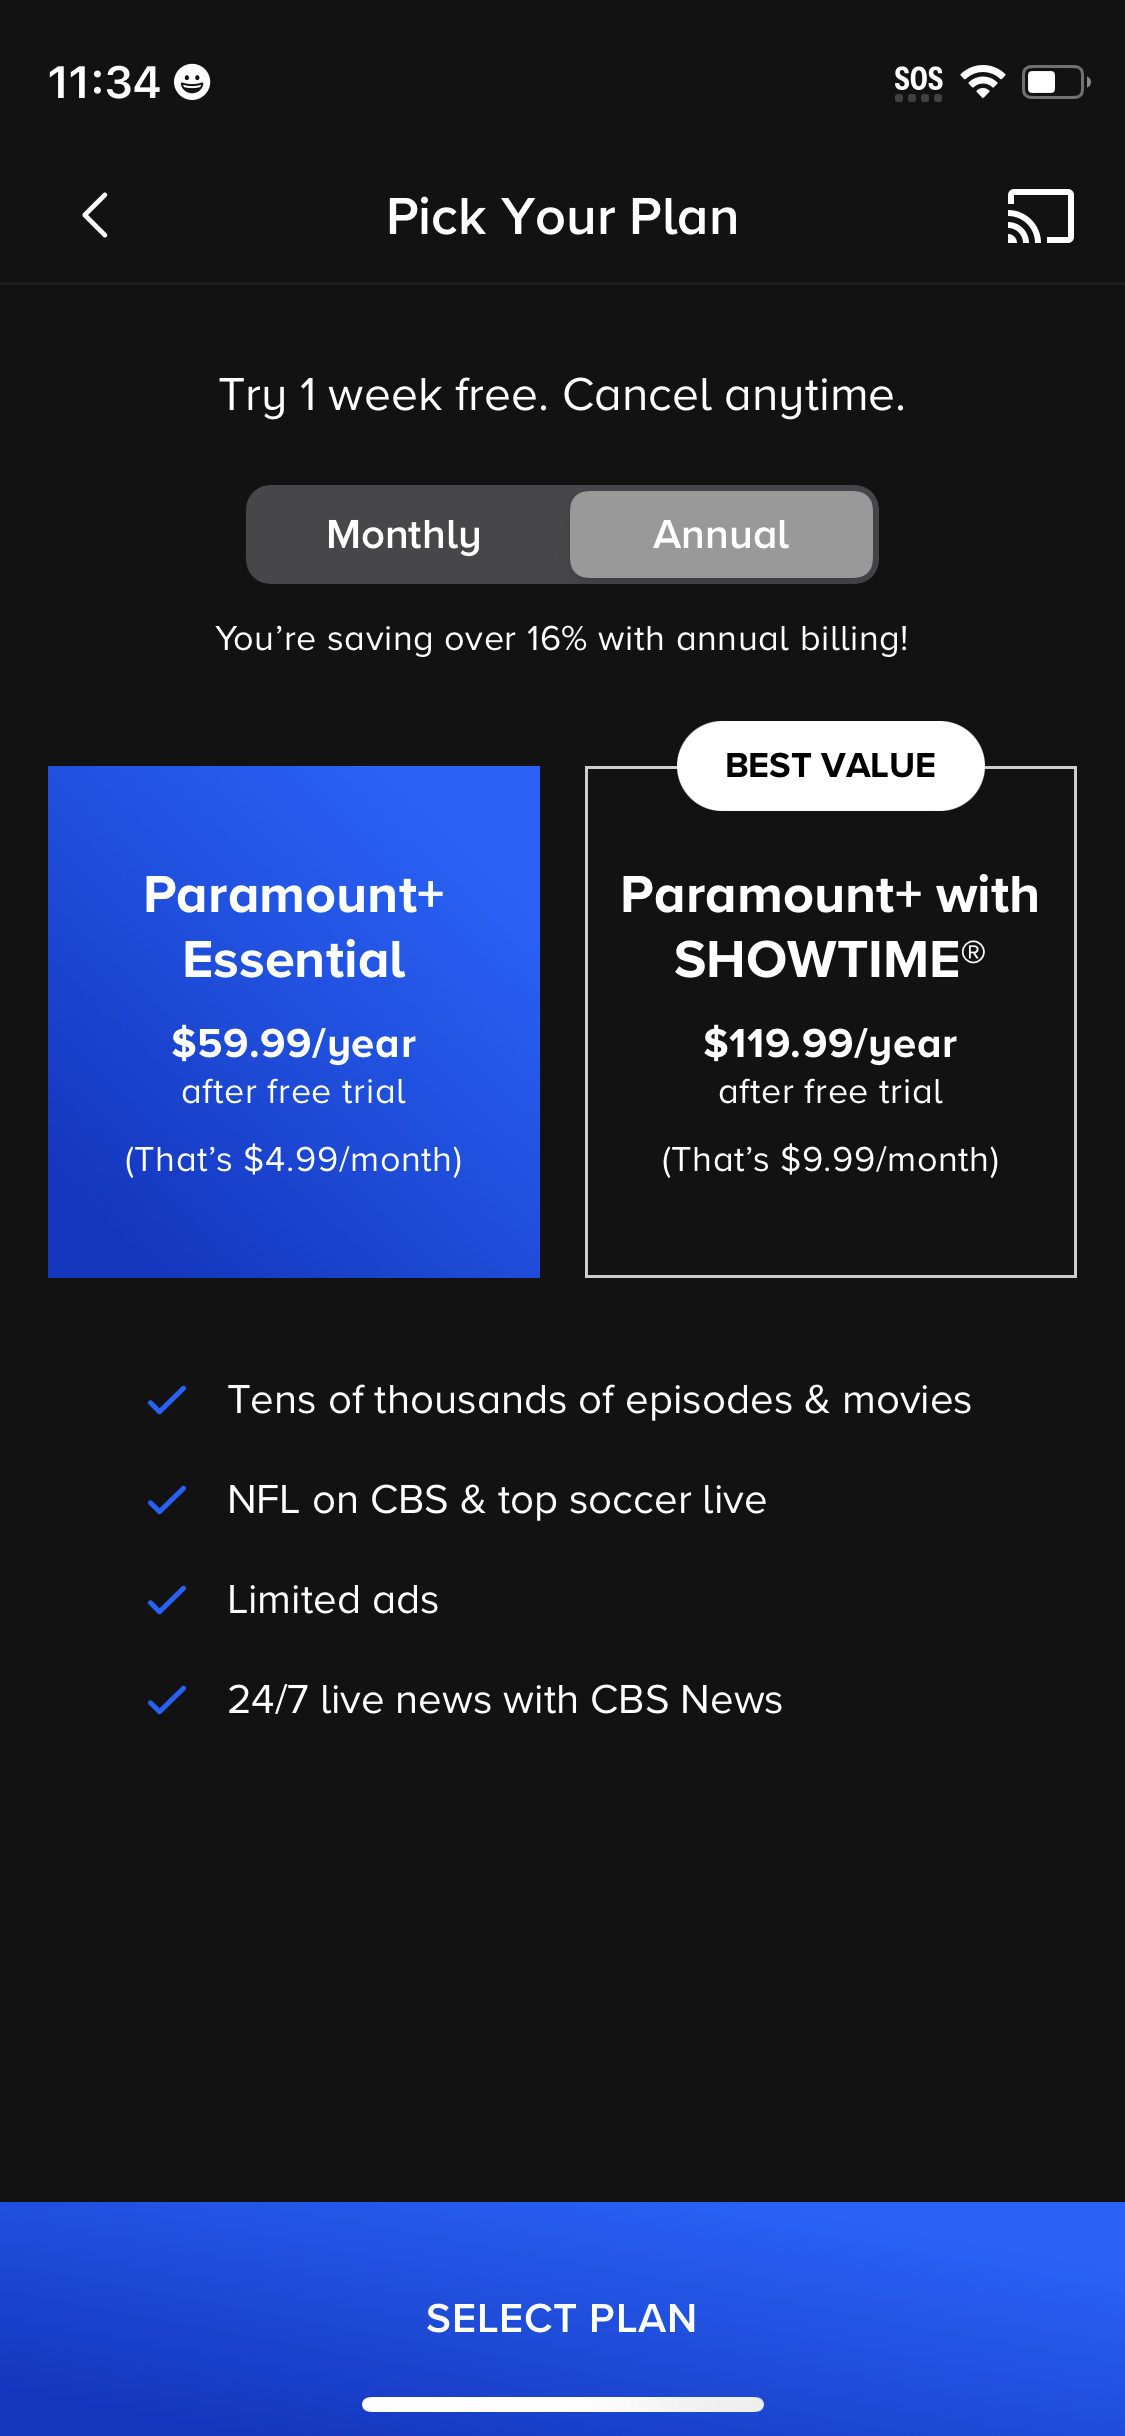
Paramount1125 × 2436opens the full image 
Moviepass1206 × 2622opens the full image
The numbers
| # | Stat | Computed from |
|---|---|---|
| [1] | leaders 12/35 (34%) at 0.751; rest 10/31 (32%) at 0.905 | market_leaders_vs_rest |
| [2] | only 66 of 129 flows have a Yes/No leader label | market_leaders_vs_rest / smallSampleWarnings |
Methodology
Universe: 66 labeled onboarding flows (35 leader, 31 non-leader) of 129 across ~800 tracked apps, July 2026. Key caveat: small, partially-labeled samples; directional only.
Sources
- [1]
Lazyweb Research analysis of 66 onboarding flows (~800 tracked apps), July 2026
Flows joined to companies.market_leader IN ('Yes','No'); rate and avg first-paywall position by group.
- [2]
Lazyweb Research analysis of 129 onboarding flows (~800 tracked apps), July 2026
63 of 129 flows have an Unknown/NULL market_leader label and are excluded from the cut.
Source: Lazyweb Research — proprietary analysis of real, in-market app screens. Cite as Lazyweb Research, 2026-07-07.