How common are paywalls and streaks in Education apps?
- By Ali Abouelatta
- n = 37
- Published
- Updated
- 2 min read
- paywall · retention · onboarding · mobile · monetization
Short answer
68% of tracked Education apps (25 of 37) have a captured paywall and 51% (19 of 37) have a streak screen source[1]. Both rates roughly double the all-app averages (paywall 37.7%, streak 11.6%) number[2]. Education is the twin of Health & Fitness: a heavily monetized, heavily gamified vertical where paywalls and streaks are the norm, not the exception.
25 of 37 tracked Education apps (68%) have a paywall and 19 of 37 (51%) have a streak — Lazyweb Research, July 2026.
Bar chart · Education
Education — The finding
One block is about 2.4%
- Paywall
- 68% (25/37)
- Streak
- 51% (19/37)
- Social login
- 57% (21/37)
The finding
In Education, 25 of 37 apps (68%) show a paywall and 19 of 37 (51%) show a streak — the top streak vertical in the census source[1]. Social login is also unusually high at 57% (21 of 37) number[3]. Against baselines number[2]:
| Pattern | Education | All apps |
|---|---|---|
| Paywall | 68% (25/37) | 37.7% (305/809) |
| Streak | 51% (19/37) | 11.6% (94/809) |
| Social login | 57% (21/37) | 40.7% (329/809) |
How to apply it
Education apps — led by the Duolingo archetype — pair subscription paywalls with streak-driven daily retention and low-friction social login source[1]. If you build in learning or edtech, this triad is the expected pattern: gamify the daily loop, gate premium behind a paywall, and reduce sign-up friction with Apple/Google login. Match the vertical playbook rather than the global average, which understates all three.
Caveats
Education has n=37 apps, a modest vertical sample, so treat percentages as directional source[1]. Prevalence is a lower bound on captured screens. All matches deduped by company across paywall, streak, and social-login tag families.
Real in-market screens
Screens from real, in-market apps, tracked by Lazyweb Research.
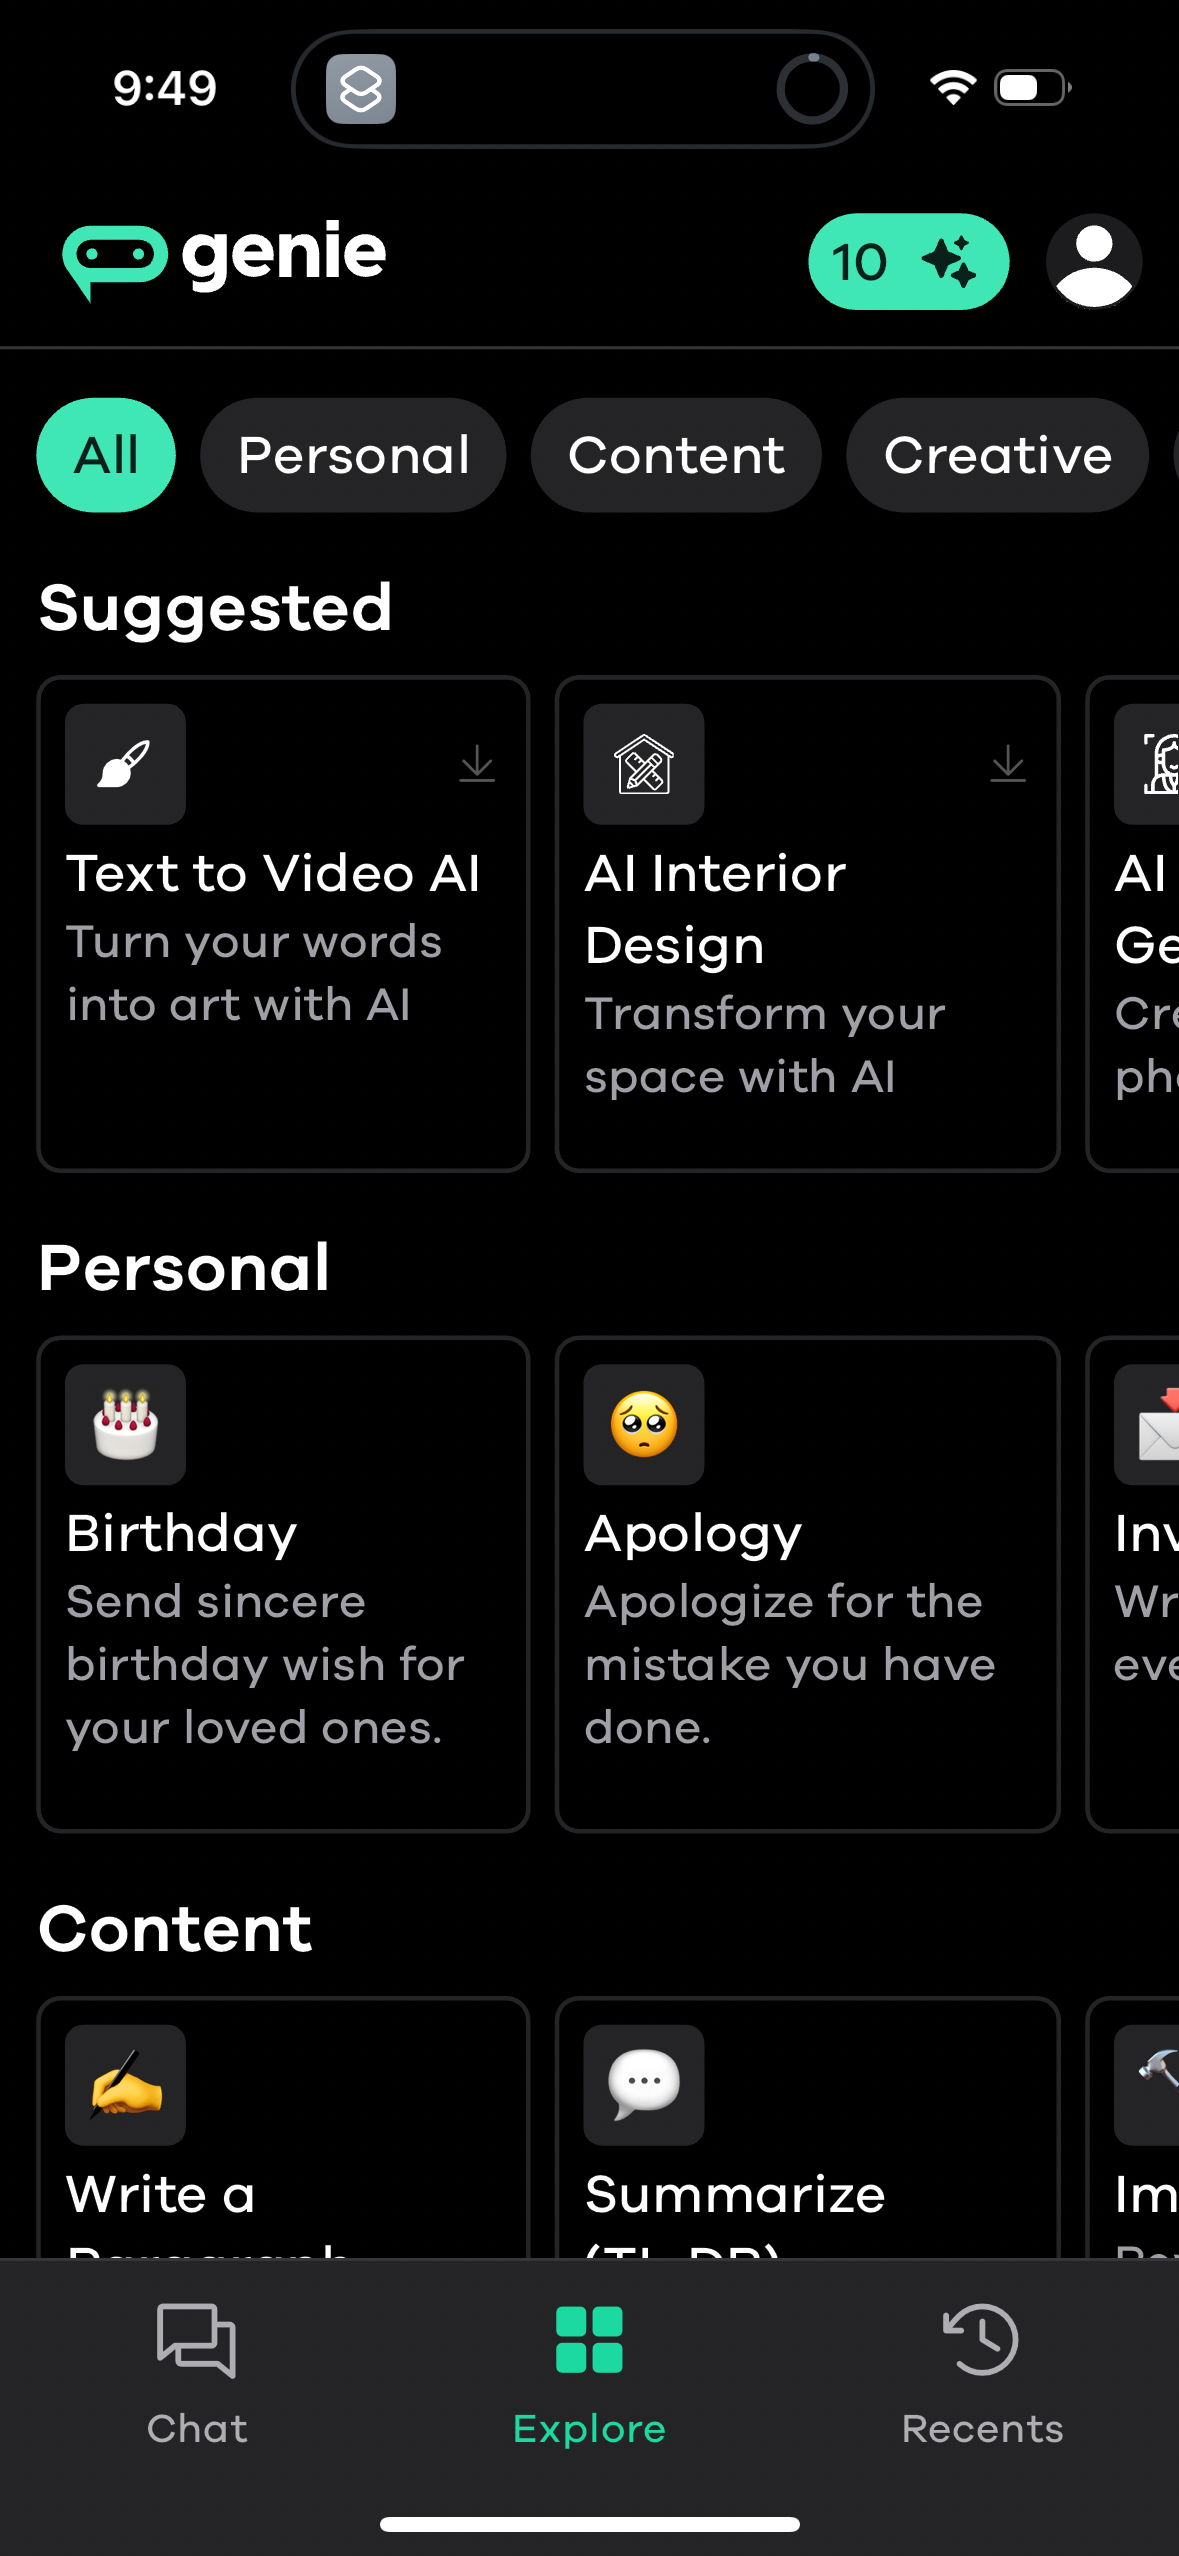
Genie1179 × 2556opens the full image 
Halo Habits1206 × 2622opens the full image 
Trello1206 × 2622opens the full image 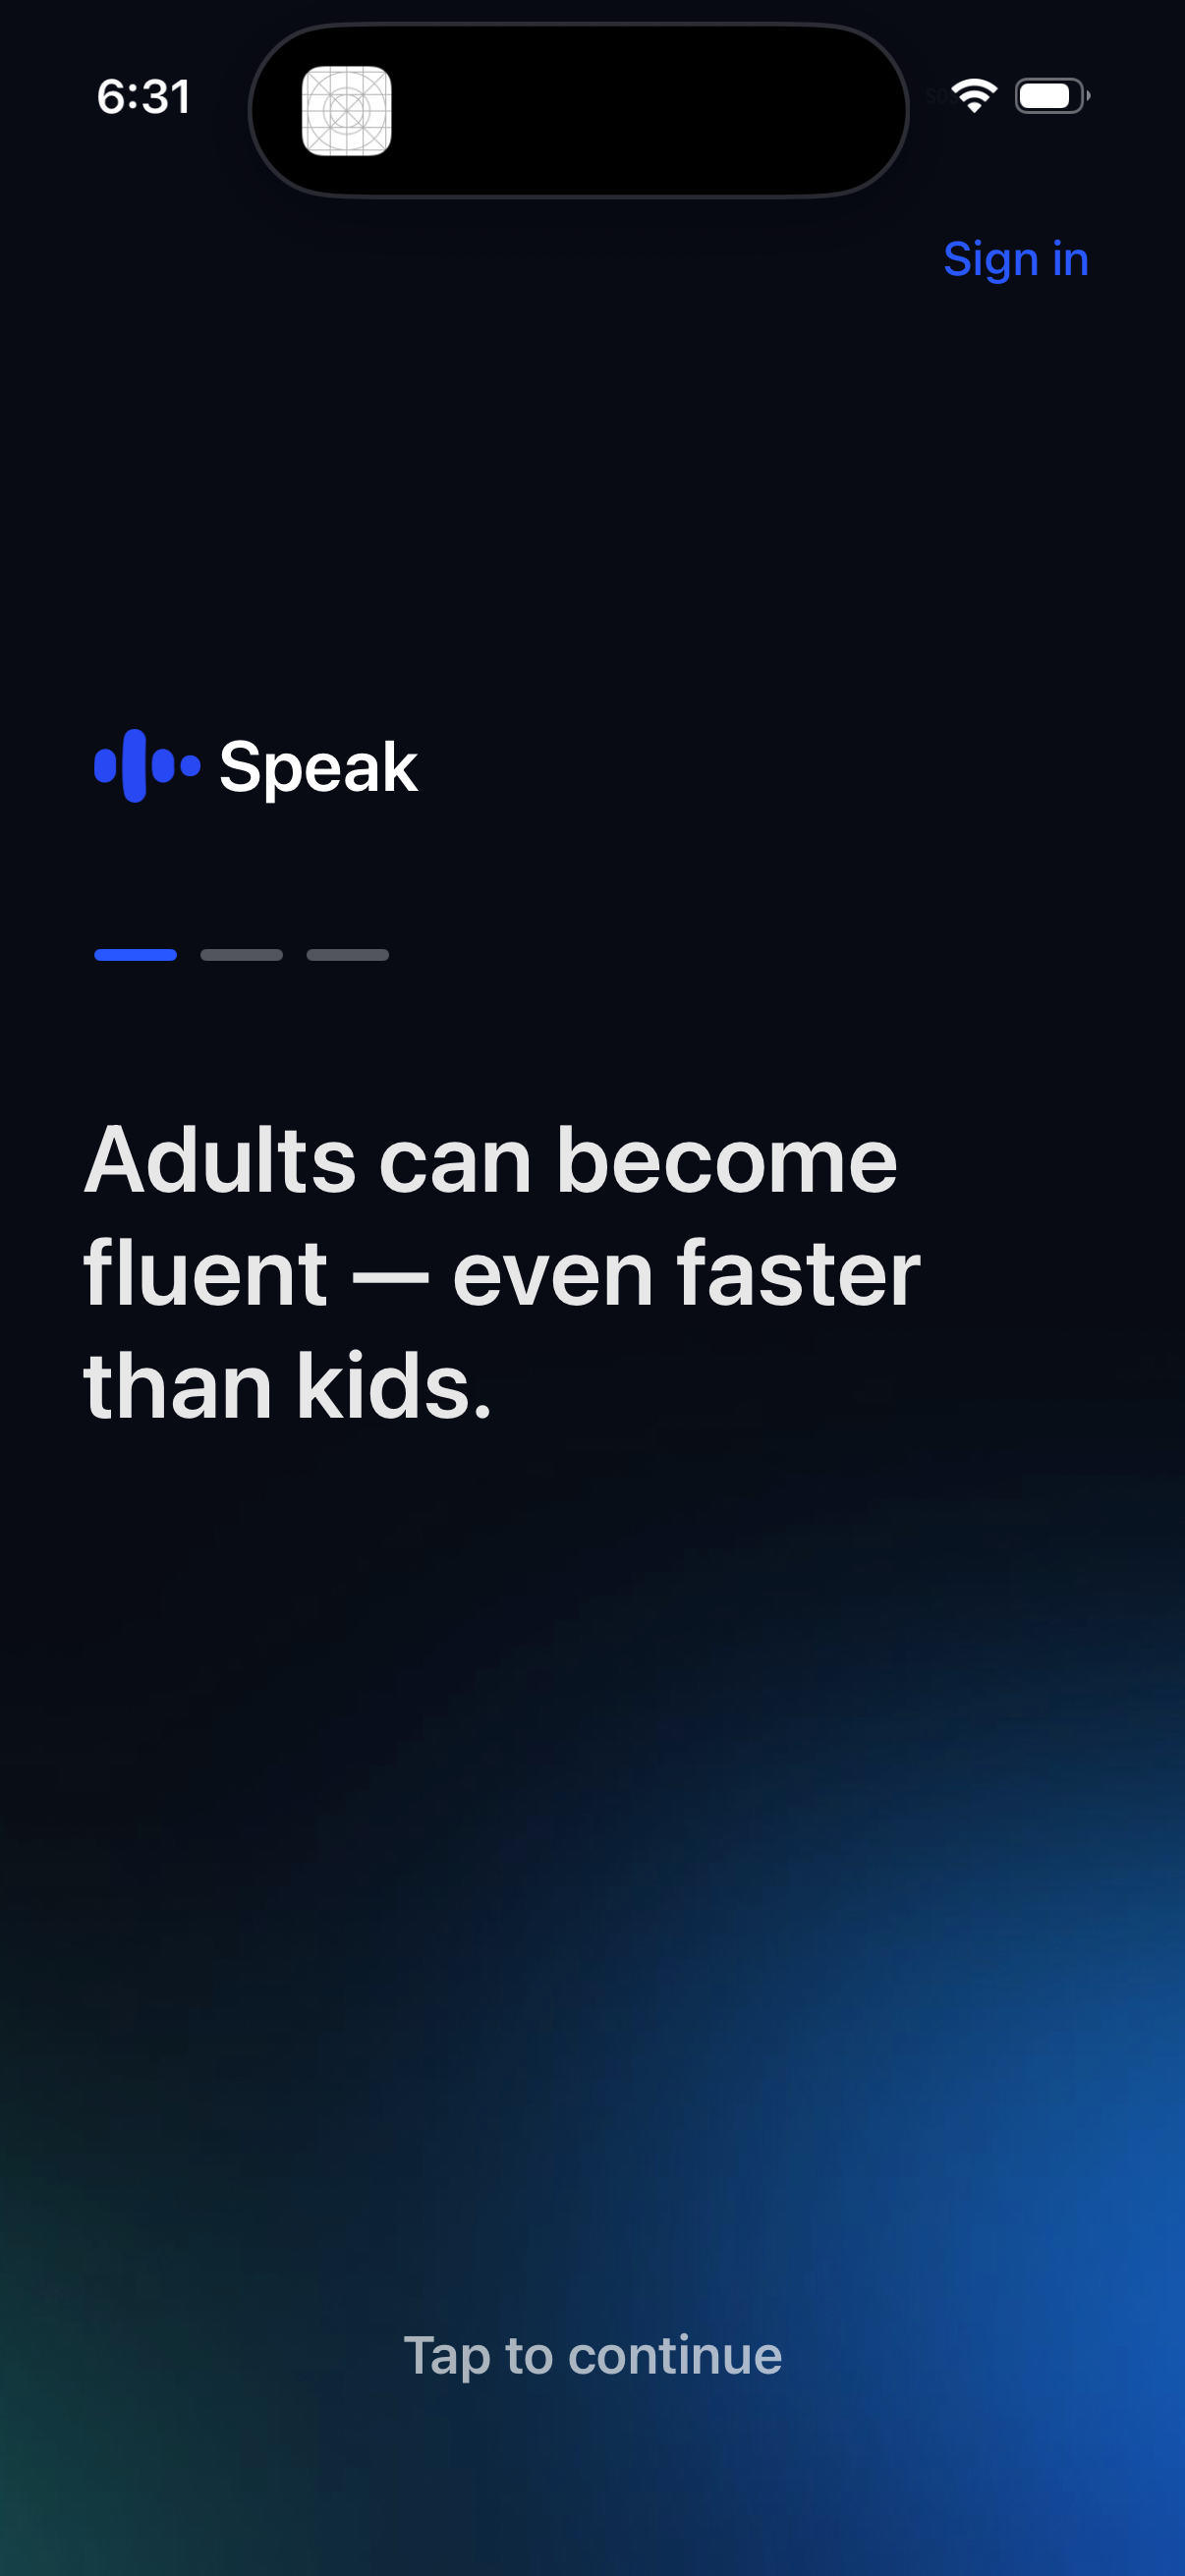
Speak1206 × 2622opens the full image
The numbers
| # | Stat | Computed from |
|---|---|---|
| [1] | Paywall 68% (25/37), Streak 51% (19/37) Education | paywall_by_category['Education']: 25/37; streaks_by_category['Education']: 19/37 |
| [2] | All apps: paywall 37.7% (305/809), streak 11.6% (94/809) | prevalence_paywall_screen; prevalence_streaks |
| [3] | Social login 57% (21/37) Education | social_login_by_category['Education']: 21/37 |
Methodology
Universe: 809 apps; Education n=37. Method: per-vertical COUNT(DISTINCT company_name) matching paywall/streak/social-login tags. July 2026. Caveat: captured screens only; modest n.
Sources
- [1]
Lazyweb Research analysis of 809 mobile apps (809 mobile apps with >=1 captured screen; 751 with tag data; median 41 screens/app), July 2026
Prevalence = COUNT(DISTINCT company_name) over LLM synonym tags; denominator is 809 tracked apps (reported conservatively over all apps-with-screens, not the 62,376-row companies table). Lower bound: only reflects screens Lazyweb captured (median 41/app).
Source: Lazyweb Research — proprietary analysis of real, in-market app screens. Cite as Lazyweb Research, 2026-07-07.