Which Growth Tactics Do Companies Actually A/B Test the Most?
- By Ali Abouelatta
- n = 4,814
- Published
- Updated
- 2 min read
- experiments · monetization · pricing · paywall · ux-patterns
Short answer
Across 4,814 before/after UI experiments Lazyweb Research detected (362 companies, 1,358 canonical screens), discount badges lead at 1,133 mentions, followed by CTA copy (561), trials (517), and urgency/countdowns (317) source[1]source[2]. Price anchoring (279), social proof (120), pricing-tier removal (117), and free-plan removal (10) round out the tail number[3]. These are experiments that mention each tactic, not a curated pure-tactic set.
Discount badges are the single most-touched tactic at 1,133 of 4,814 detected experiments (222 companies) — Lazyweb Research, July 2026.
Bar chart · Experiments
Experiments — The tactic leaderboard
One block is about 20 Experiments
- Discount badges
- 1,133
- CTA copy changes
- 561
- Trials
- 517
- Urgency / countdowns
- 317
- Price anchoring
- 279
- Social proof
- 120
- Pricing-tier removal
- 117
- Free-plan removal
- 10
The tactic leaderboard
Discounts dominate both by experiment count and company reach source[1].
Where the tests land on the page
By annotated change area, the hero is the most-tested surface (405 experiments), followed by offer (281), pricing (229), CTA (225), and value props (178) number[10]. So even though discount and CTA copy lead by keyword, the hero is where the largest share of annotated experiments concentrate number[10].
How to apply it
Use this as a prior on how mainstream a tactic is before you spend a test slot. Heavily-tested levers (discounts, CTA copy, trials) have deep precedent and named examples; thinly-tested ones (free-plan removal, n=10) mean you're closer to the frontier with less benchmark to lean on number[9]. Pair the frequency read with retention: social proof and anchoring are almost never reversed once added, while trials churn most number[11].
Caveats
Counts are experiments that mention a tactic via keyword tagging, which has precision limits ('%anchor%' overcounts, '%save %' inflates discounts) — read them as theme prevalence, not exact test counts number[12]. Free-plan removal (n=10) is publishable as absolute counts only number[9]. Learnings are LLM-inferred, not measured A/B lift.
Real in-market screens
Screens from real, in-market apps, tracked by Lazyweb Research.
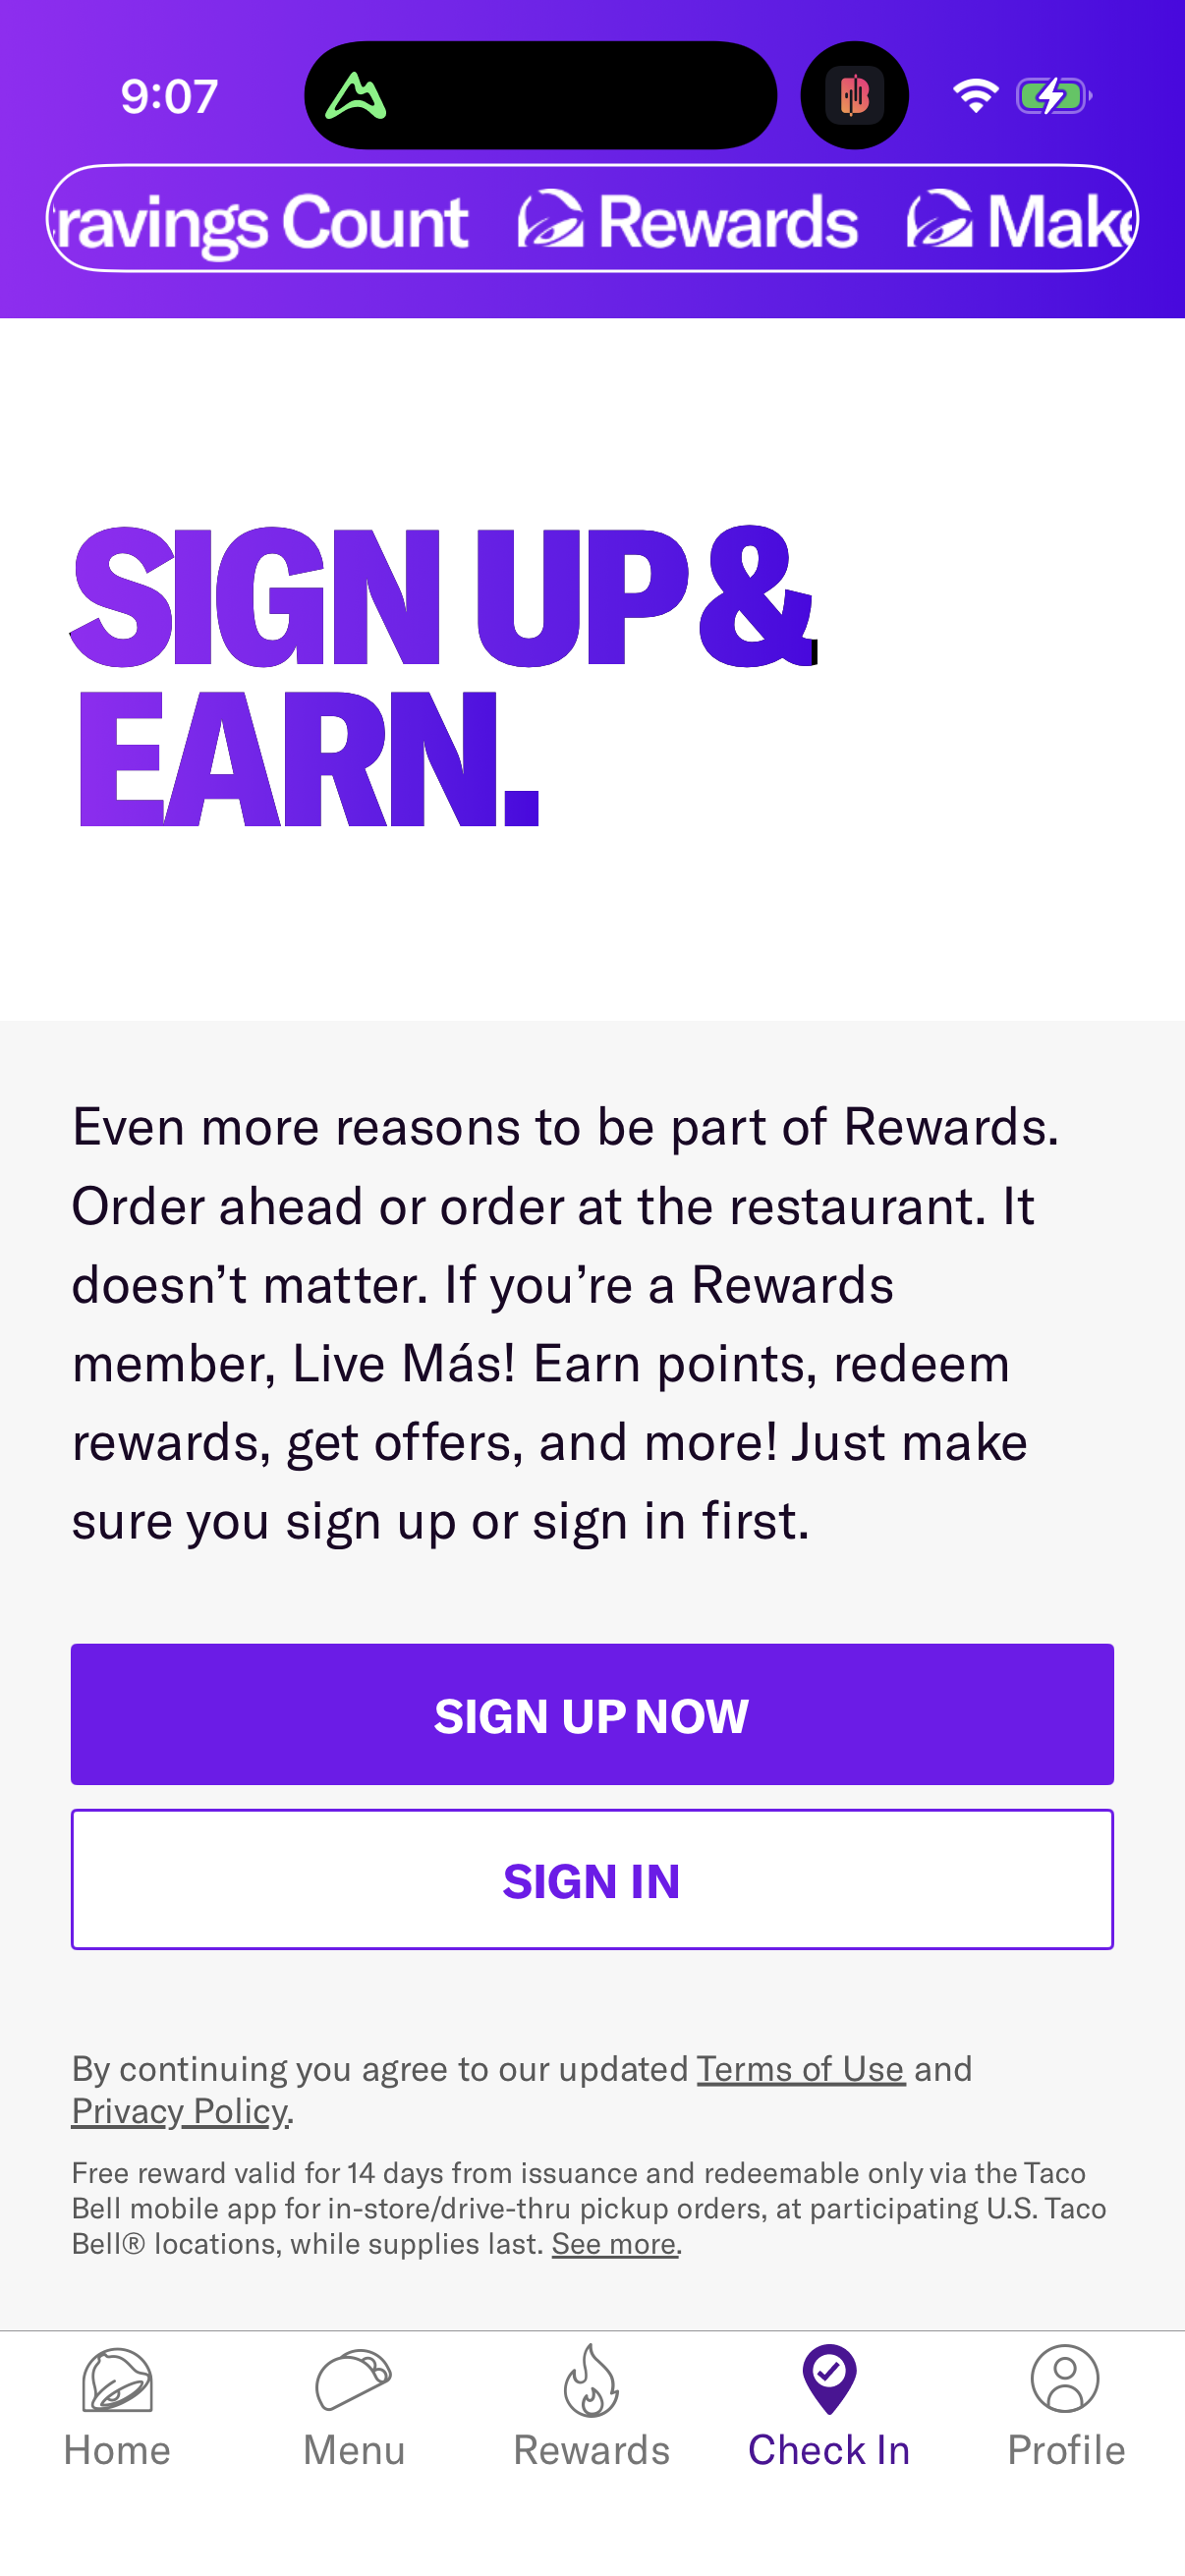
Taco Bell1206 × 2622opens the full image 
Opal602 × 1308opens the full image 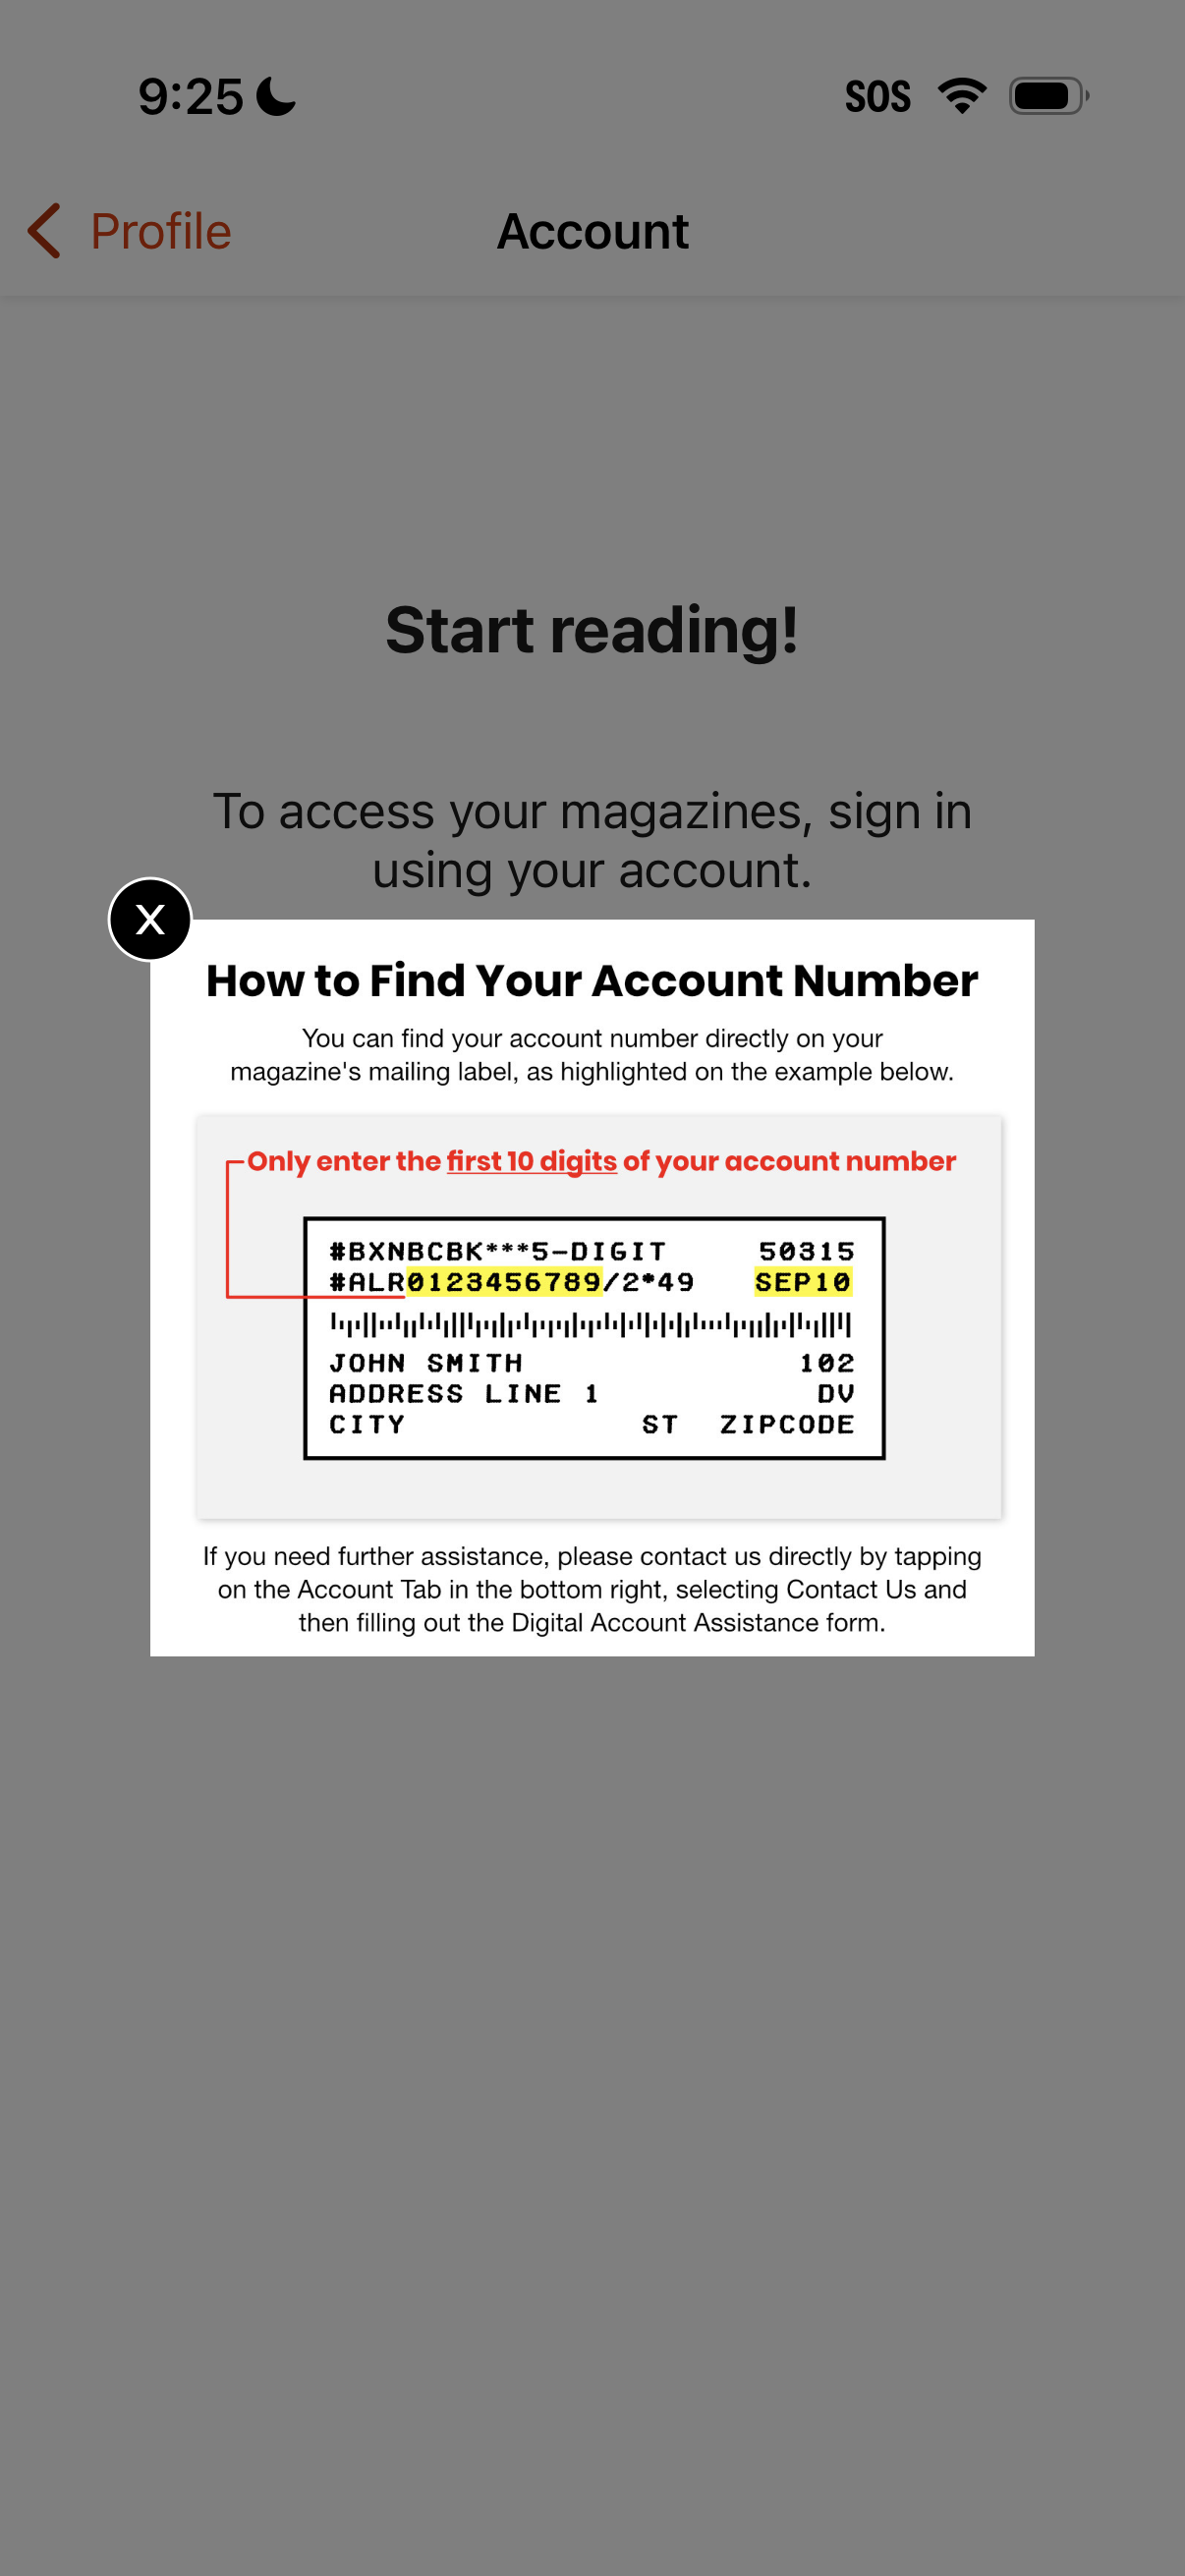
Allrecipes1206 × 2622opens the full image 
Apple Music1206 × 2622opens the full image
The numbers
| # | Stat | Computed from |
|---|---|---|
| [1] | discount badges 1,133 experiments, 222 companies (most-touched) | tactic_mentions__discount_badges |
| [2] | 4,814 detected experiments, 362 companies, 1,358 canonical screens | total_detected_experiments; distinct_companies_in_experiment_corpus |
| [3] | price anchoring 279 experiments, 136 companies | tactic_mentions__price_anchoring |
| [4] | CTA copy 561 experiments, 201 companies | tactic_mentions__cta_copy |
| [5] | trials 517 experiments, 140 companies | tactic_mentions__trial_length |
| [6] | urgency/countdown 317 experiments, 97 companies | tactic_mentions__urgency_countdown |
| [7] | social proof 120 experiments, 62 companies | tactic_mentions__social_proof |
| [8] | pricing-tier removal 117 experiments, 83 companies | tactic_mentions__pricing_tier_removal |
| [9] | free-plan removal 10 experiments, 8 companies (absolute counts only) | tactic_mentions__free_plan_removal; smallSampleWarnings |
| [10] | hero 405, offer 281, pricing 229, CTA 225, value props 178 (annotated areas) | annotation_area_breakdown |
| [11] | social proof 100% and anchoring 98% retained; trial 85% (lowest) | retention__social_proof; retention__price_anchoring; retention__trial |
| [12] | keyword tags have precision limits ('%anchor%', '%save %' overcount) | smallSampleWarnings |
Methodology
Universe: 4,814 detected before/after UI experiments (362 companies, 1,358 canonical screens); tactic counts are keyword mentions on what_changed+learning, area counts from LLM annotations, July 2026 pull. Counts reflect experiments that mention each tactic, not measured A/B results.
Sources
- [1]
Lazyweb Research analysis of 4,814 detected experiments (362 companies, 1,358 canonical screens), July 2026
Tactic counts are keyword mentions on what_changed+learning; distinct companies via control screenshot join.
- [2]
Lazyweb Research analysis of experiment annotation areas (2,160+ annotated experiments), July 2026
Area counts are distinct experiments per annotated change area; LLM-derived, not measured outcomes.
Source: Lazyweb Research — proprietary analysis of real, in-market app screens. Cite as Lazyweb Research, 2026-07-07.