Do Apps That Add Social Proof to Their Screens Keep It?
- By Ali Abouelatta
- n = 120
- Published
- Updated
- 3 min read
- experiments · ux-patterns · monetization · landing-page · design
Short answer
Across 29 tracked screens where Lazyweb Research detected social proof being added, 29 of 29 (100%) still had it in later captures, with zero detected removals source[1]source[2]. Social proof is the stickiest of the five tactics we track for reversal: additions outnumber removals roughly 12:1 across the 120 experiments that mention it number[3]number[4]. Treat this as a persistence signal from observed before/after UI diffs, not a measured A/B lift.
Of 29 tracked screens where social proof was added, 0 later removed it (29/29 retained) — Lazyweb Research, July 2026.
Bar chart · Screens kept / added
Screens kept / added — How it compares to other tactics
One block is about 3.6%
- Social proof
- 29 / 29
- Price anchoring
- 42 / 43
- Urgency / countdown
- 56 / 58
- Discount badges
- 147 / 162
- Trial-related
- 69 / 81
The finding: added social proof stays added
Lazyweb Research tracks 120 detected experiments across 62 companies whose before/after diff mentions social proof (social proof, testimonial, star rating, review count, user count, or 'trusted by') number[3]. When we narrow to screens where social proof was clearly added and then re-captured later, 29 of 29 screens still showed it — no detected removal on any of them source[1]. Directionally, additions dominate: of the classifiable social-proof changes, 37 added versus 3 removed (with 6 mixed and 74 unclassifiable), roughly a 12:1 add-to-remove ratio number[4].
How it compares to other tactics
Retention (share of add-screens with no later detected removal) across the five tactics we measure:
Social proof and anchoring are the least likely to be walked back; trial changes are the most number[8].
How to apply it
The signal says teams that add social proof rarely reverse it, which is weak evidence it isn't actively hurting. Only 48 of 4,814 detected experiments are annotated in the 'social proof' area directly, and 18 more are hero-area experiments that also touch social proof — so testing it in the hero specifically is comparatively rare number[9]number[10]. If you add it, favor the pattern real apps keep: named testimonials or an aggregate count (e.g. voice-notes' 'Loved by 500,000+' treatment) rather than an unsupported claim number[11].
Caveats
The 29-screen and 120-experiment samples are small; percentages here are directional. 'Kept it' means no later detected experiment on the same canonical screen removed the tactic — capture cadence varies by company, so absence of a detected removal is weaker than presence of one source[2]. Learnings are LLM-inferred hypotheses about observed diffs, never measured A/B results.
Real in-market screens
Screens from real, in-market apps, tracked by Lazyweb Research.
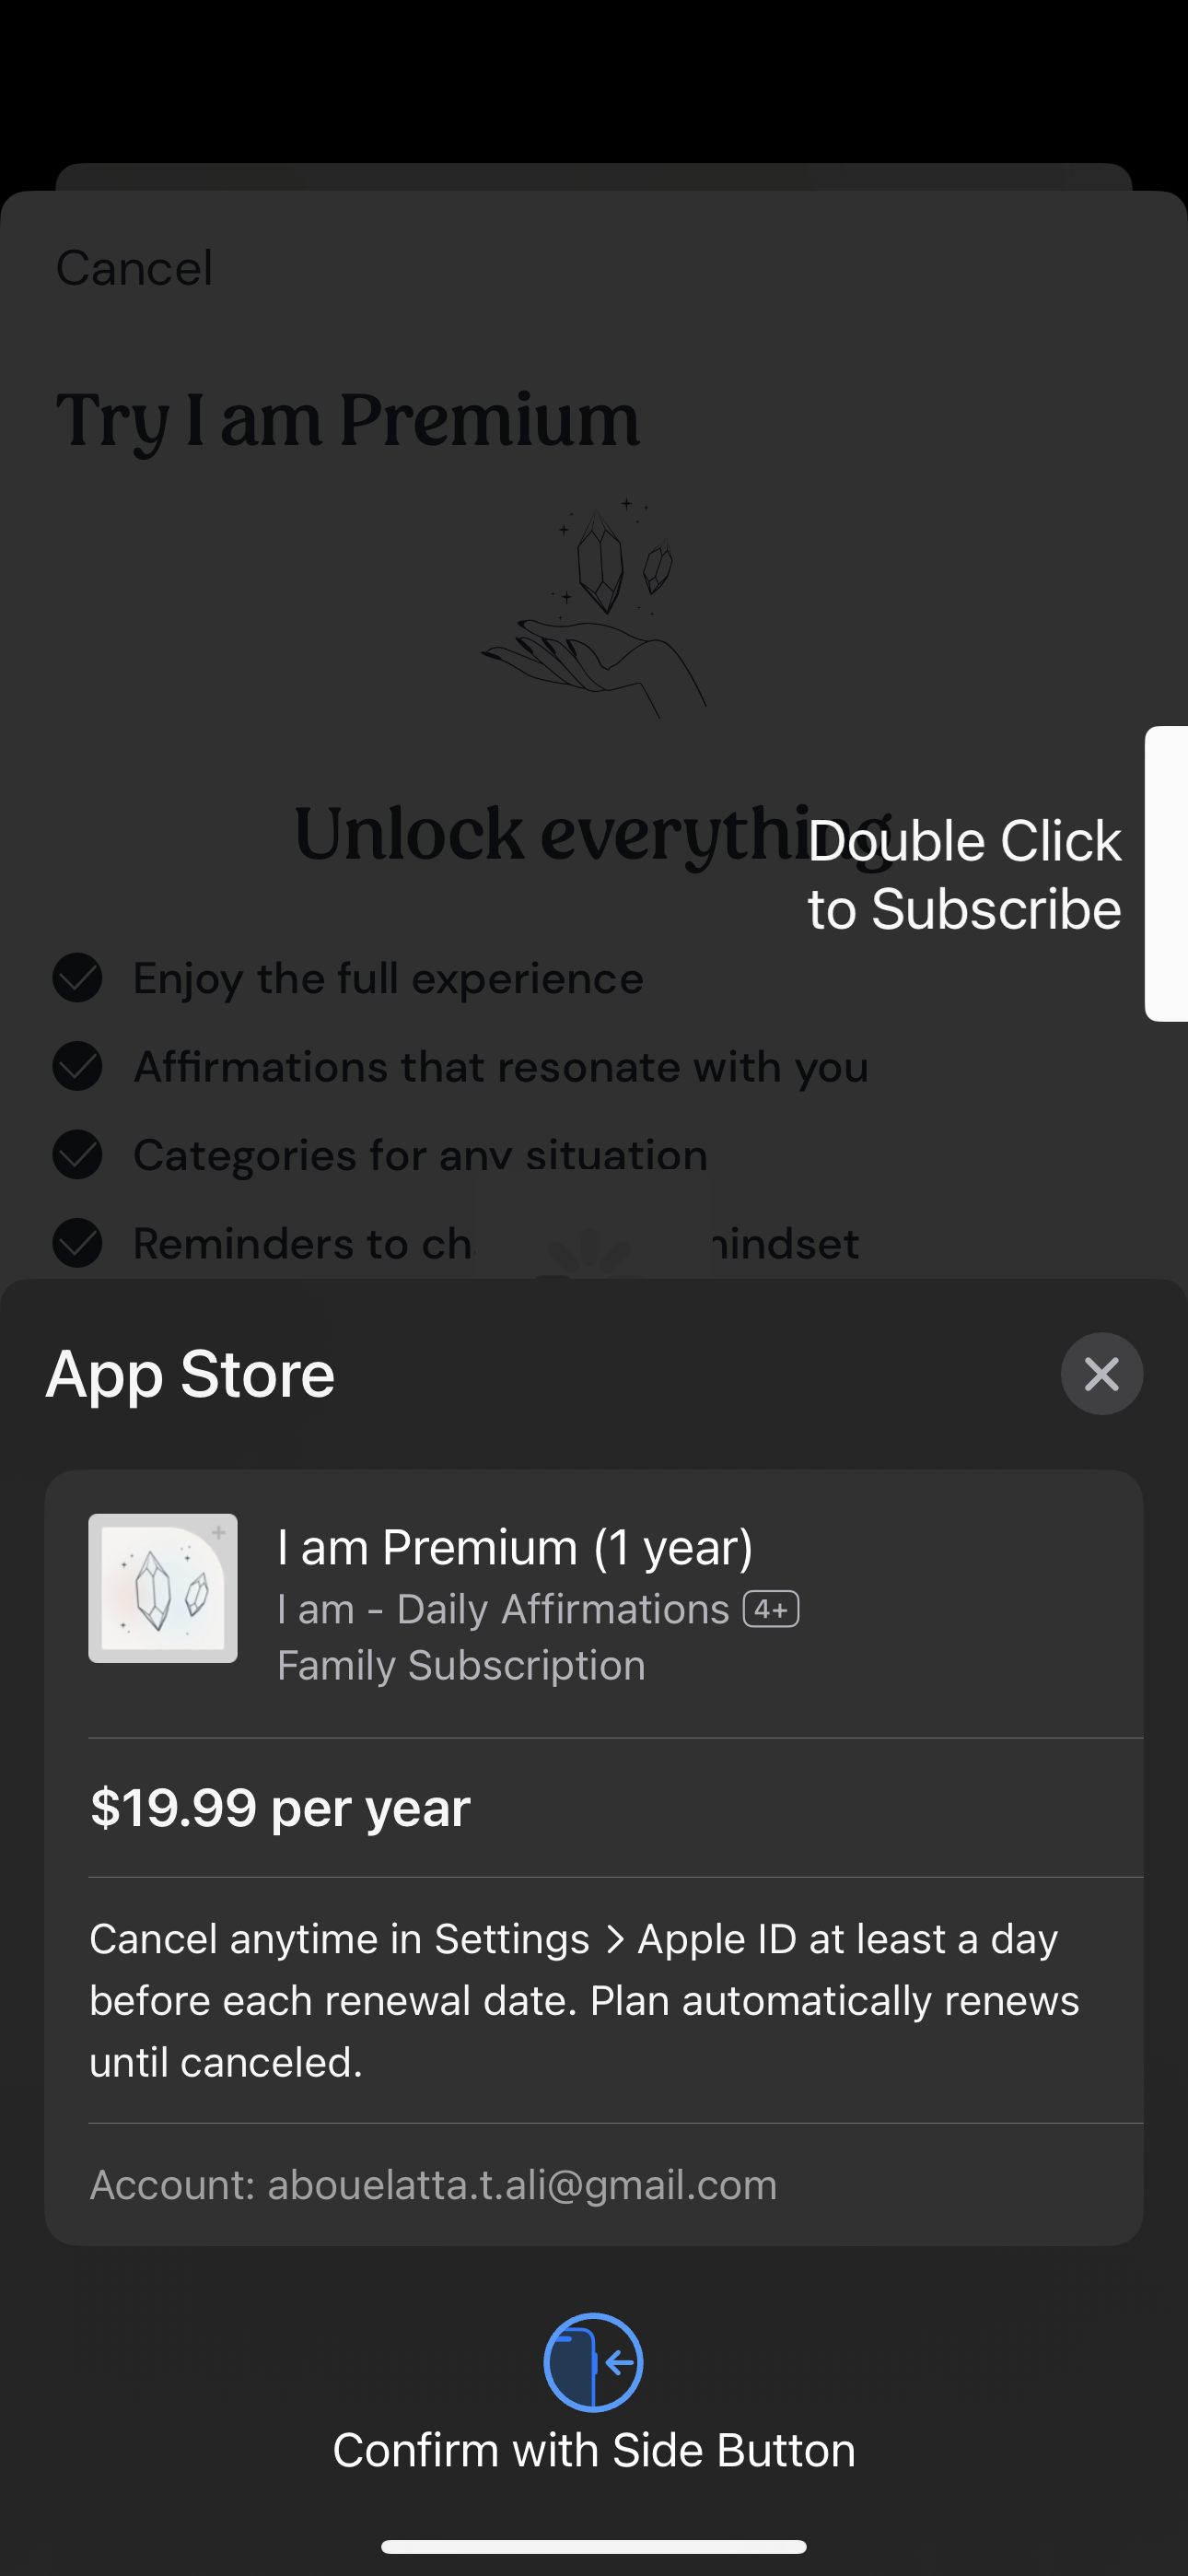
Iam1290 × 2796opens the full image 
Nyt Cooking1206 × 2622opens the full image 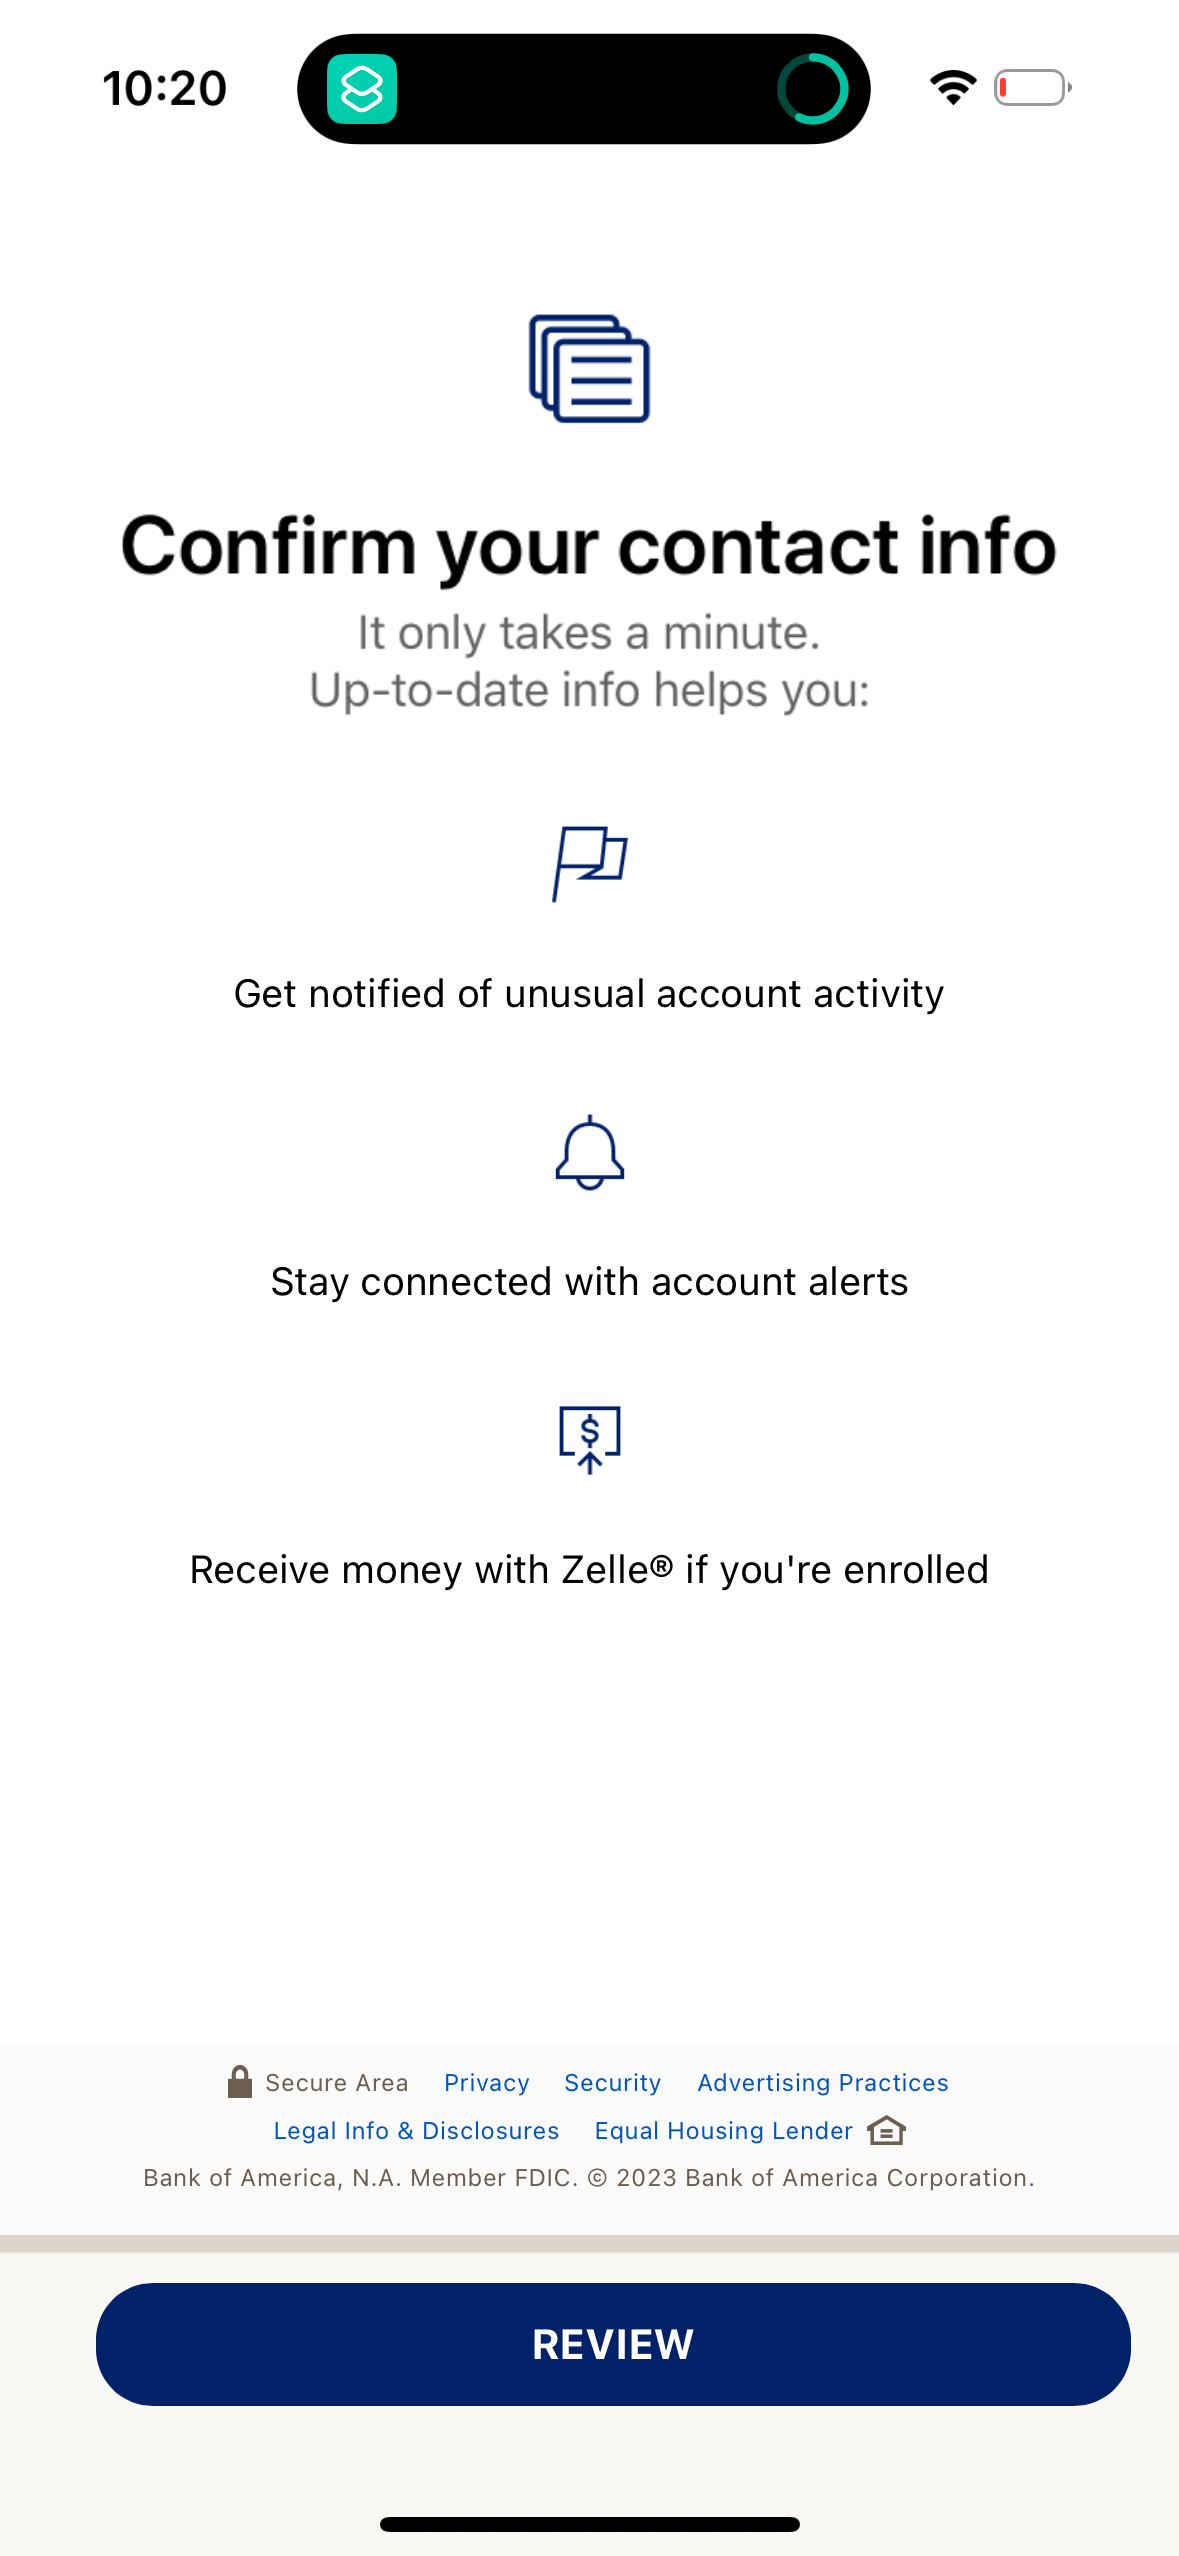
Bofa1179 × 2556opens the full image 
Expedia1290 × 2796opens the full image
The numbers
| # | Stat | Computed from |
|---|---|---|
| [1] | 29 of 29 screens kept added social proof (100%) | retention__social_proof: of 29 screens where social proof was added, 0 later removed it |
| [2] | retention is a persistence proxy, not a measured A/B result | smallSampleWarnings: 'kept it' means no later detected removal on the same canonical screen |
| [3] | 120 experiments mention social proof across 62 companies | tactic_mentions__social_proof: 120 experiments, 62 companies |
| [4] | 37 added / 3 removed / 6 mixed / 74 other social-proof changes (~12:1 add:remove) | direction_split__social_proof |
| [5] | 42 of 43 anchoring add-screens kept it | retention__price_anchoring |
| [6] | 56 of 58 urgency add-screens kept it (97%) | retention__urgency |
| [7] | 147 of 162 discount add-screens kept it (91%) | retention__discount |
| [8] | 69 of 81 trial add-screens kept it (85%), highest rollback rate | retention__trial |
| [9] | 48 experiments annotated in the 'social proof' area | hero_social_proof_experiments / annotation_area_breakdown: social proof 48 |
| [10] | 18 hero-area experiments also mention social proof (of 405 hero-area experiments) | hero_social_proof_experiments: 18 of 405 hero-area experiments |
| [11] | voice-notes added heart decorations around testimonial cards; 'Loved by 500,000+' claim | qualitative: voice-notes, 2026-07-04 |
Methodology
Universe: 120 of 4,814 detected before/after UI experiments (362 companies, 1,358 canonical screens) whose diff text mentions social proof, keyword-tagged on what_changed+learning, July 2026 pull. Retention is a persistence proxy (no later detected removal on the same canonical screen), not a measured A/B result.
Sources
- [1]
Lazyweb Research analysis of 120 detected experiments (4,814-experiment corpus, 1,358 canonical screens), July 2026
Retention computed per canonical screen: a later detected experiment removing the tactic counts as a reversal.
- [2]
Lazyweb Research analysis of 4,814 detected experiments (362 companies, 1,358 canonical screens), July 2026
Detected before/after UI diffs 2022-10-10 to 2026-07-04; learnings are LLM-inferred, not measured A/B outcomes.
Source: Lazyweb Research — proprietary analysis of real, in-market app screens. Cite as Lazyweb Research, 2026-07-07.