How Many Onboarding Screens Do Photo & Video Apps Have?
- By Ali Abouelatta
- n = 12
- Published
- Updated
- 2 min read
- onboarding · ux-patterns · mobile · design
Short answer
Across 12 tracked Photo & Video onboarding flows (11 companies), the median is 9 screens and the average is 9.5 source[1] — shorter than the 11-screen all-category median source[2]. Lengths range from 4 to 17 screens source[1]. This is a small sample reported as medians with explicit n.
Photo & Video apps run a median 9 onboarding screens, below the all-category median of 11 (n=12 flows, July 2026).
Bar chart · Photo & Video (n=12)
Photo & Video (n=12) — Photo & Video vs the overall benchmark
One block is about 0.3 Photo & Video (n=12)
- Average
- 9.5 [1]
- Median
- 9 [1]
- Range
- 4-17 [1]
The finding: leaner than the overall median
Photo & Video onboardings average 9.5 screens with a median of 9 across 12 flows source[1] — below the all-category median of 11 source[2]. These apps get users to the creative surface faster, and the 4-17 range is one of the tighter category spreads source[1], with no extreme long-tail flows.
Photo & Video vs the overall benchmark
Sample is 12 flows across 11 companies — directional only.
How to apply it
For a photo or video app, ~9 screens is the tracked norm, and there's no precedent for pushing far past 17. The value proposition is visual and immediate, so the data supports getting users into the editor quickly rather than front-loading account setup or quizzes.
Real in-market screens
Screens from real, in-market apps, tracked by Lazyweb Research.
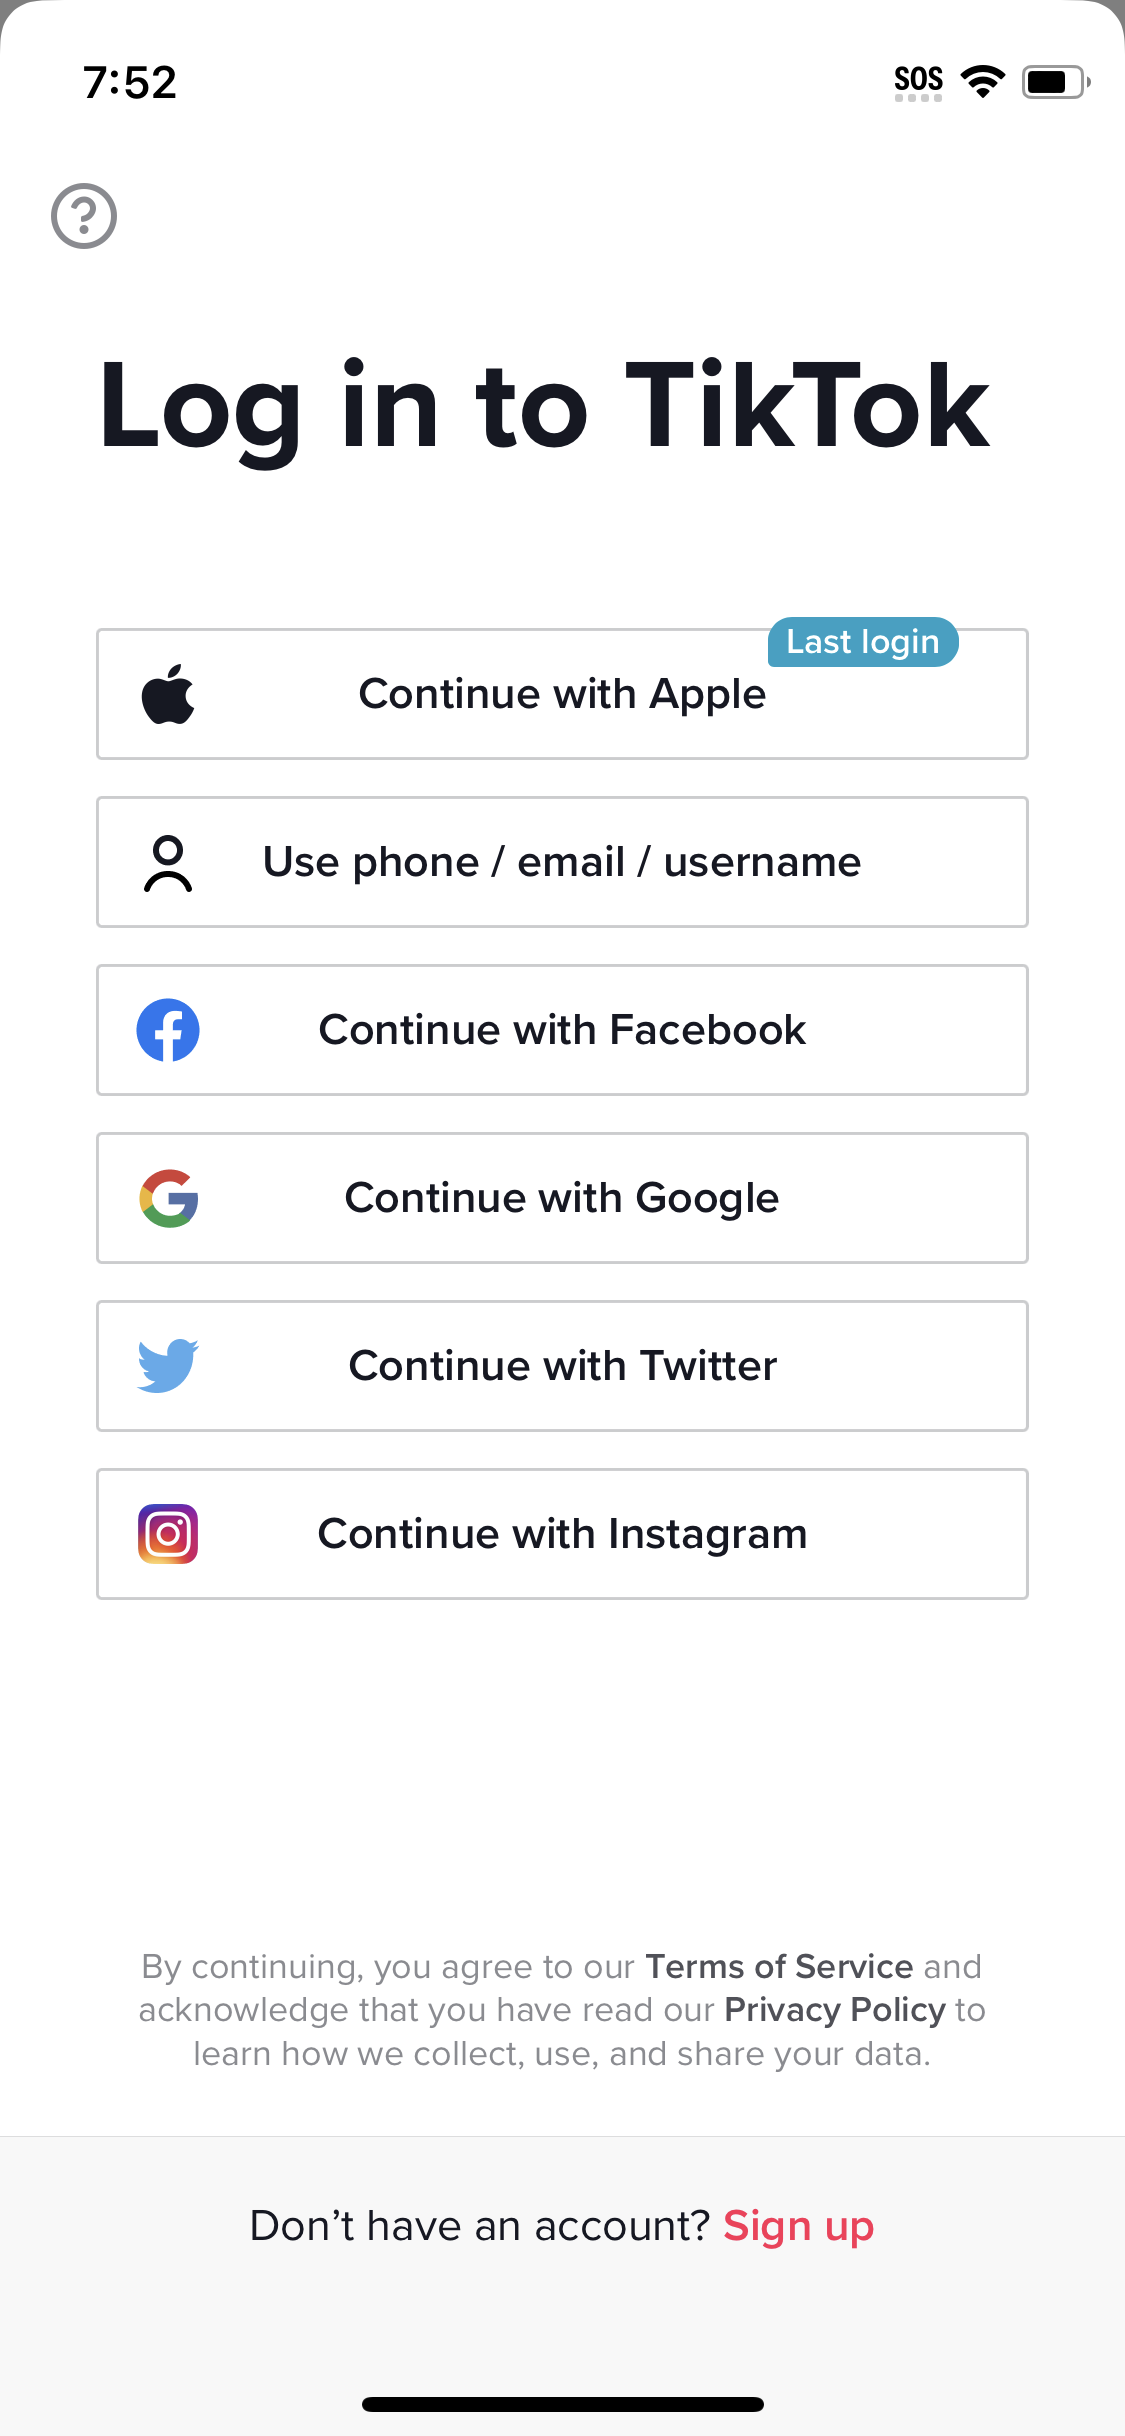
Tiktok1125 × 2436opens the full image 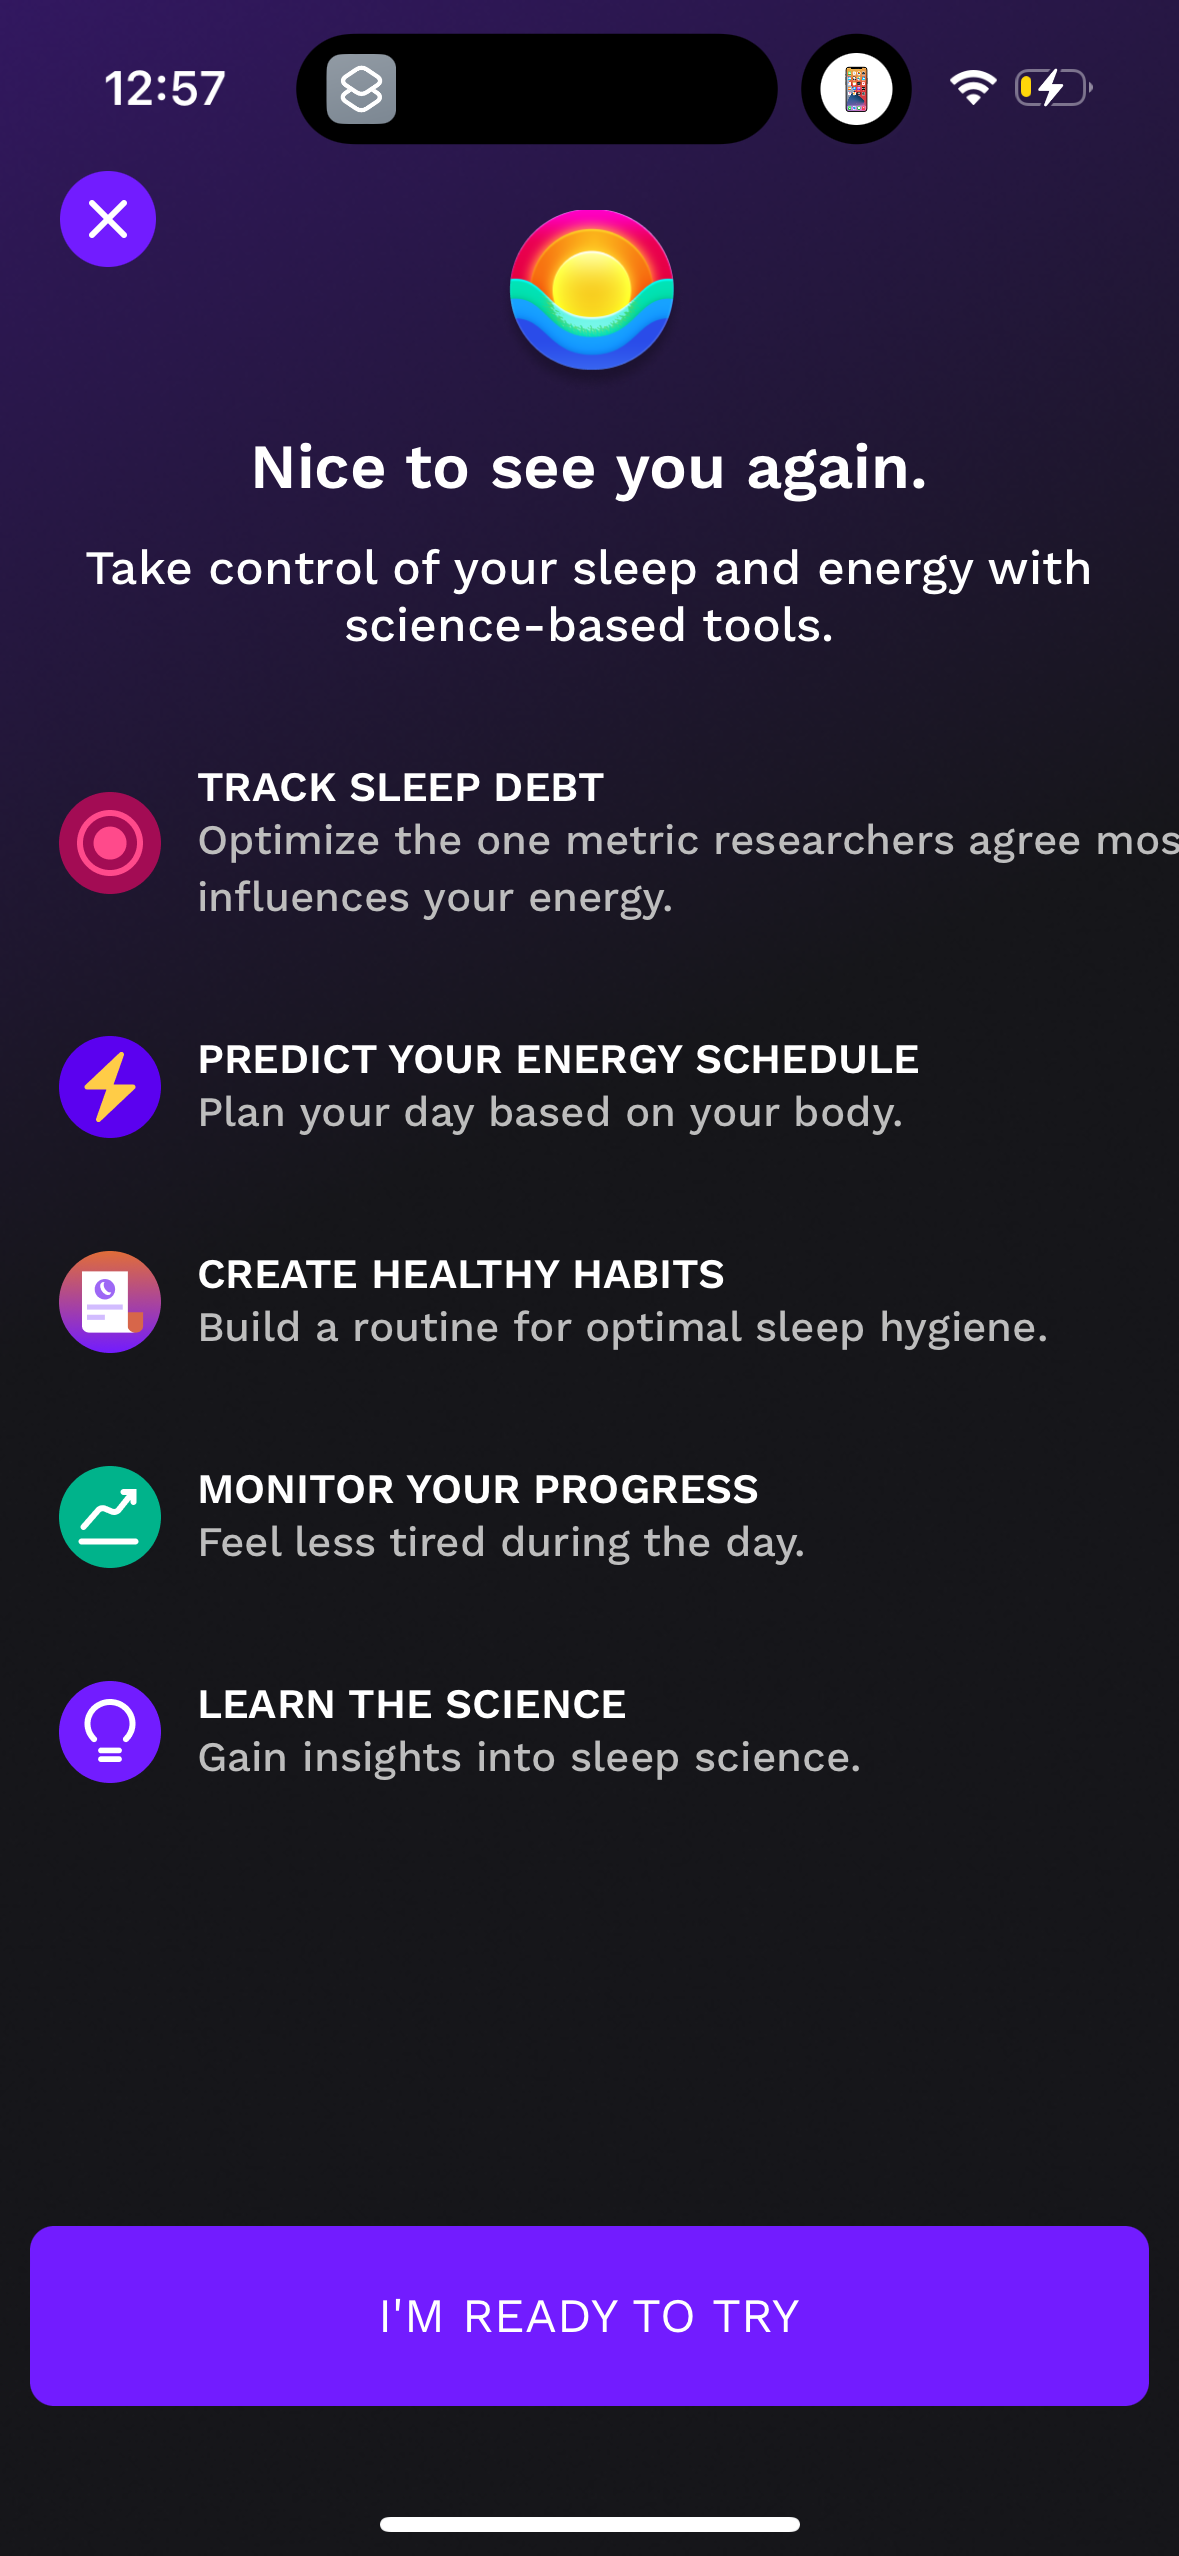
Rise1179 × 2556opens the full image 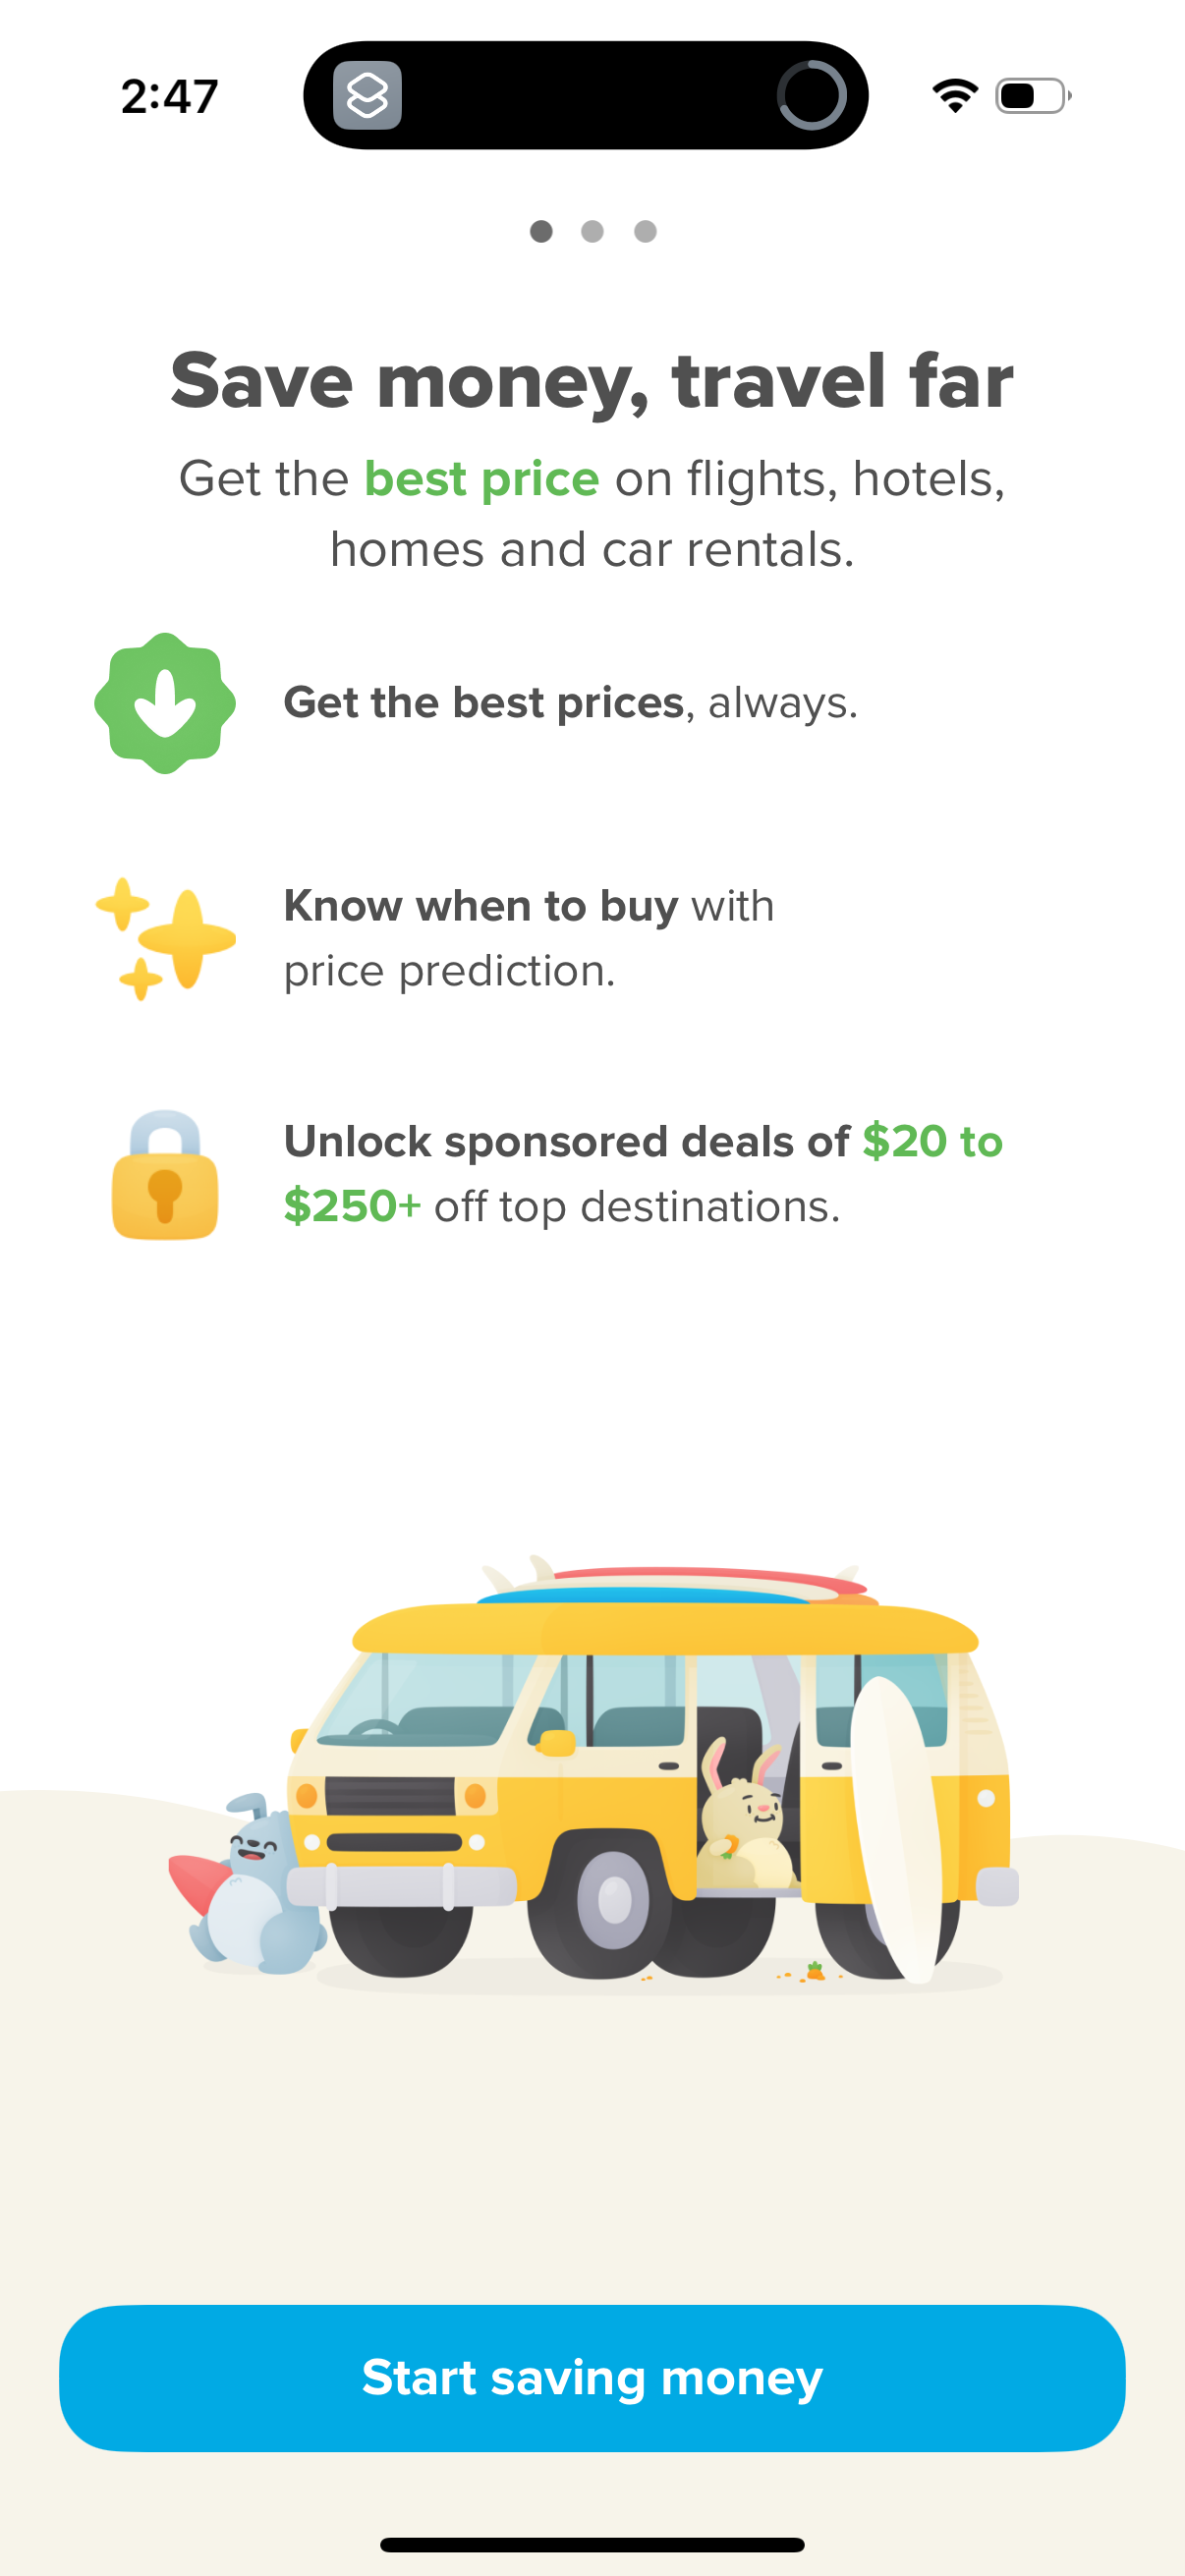
Hopper1206 × 2622opens the full image 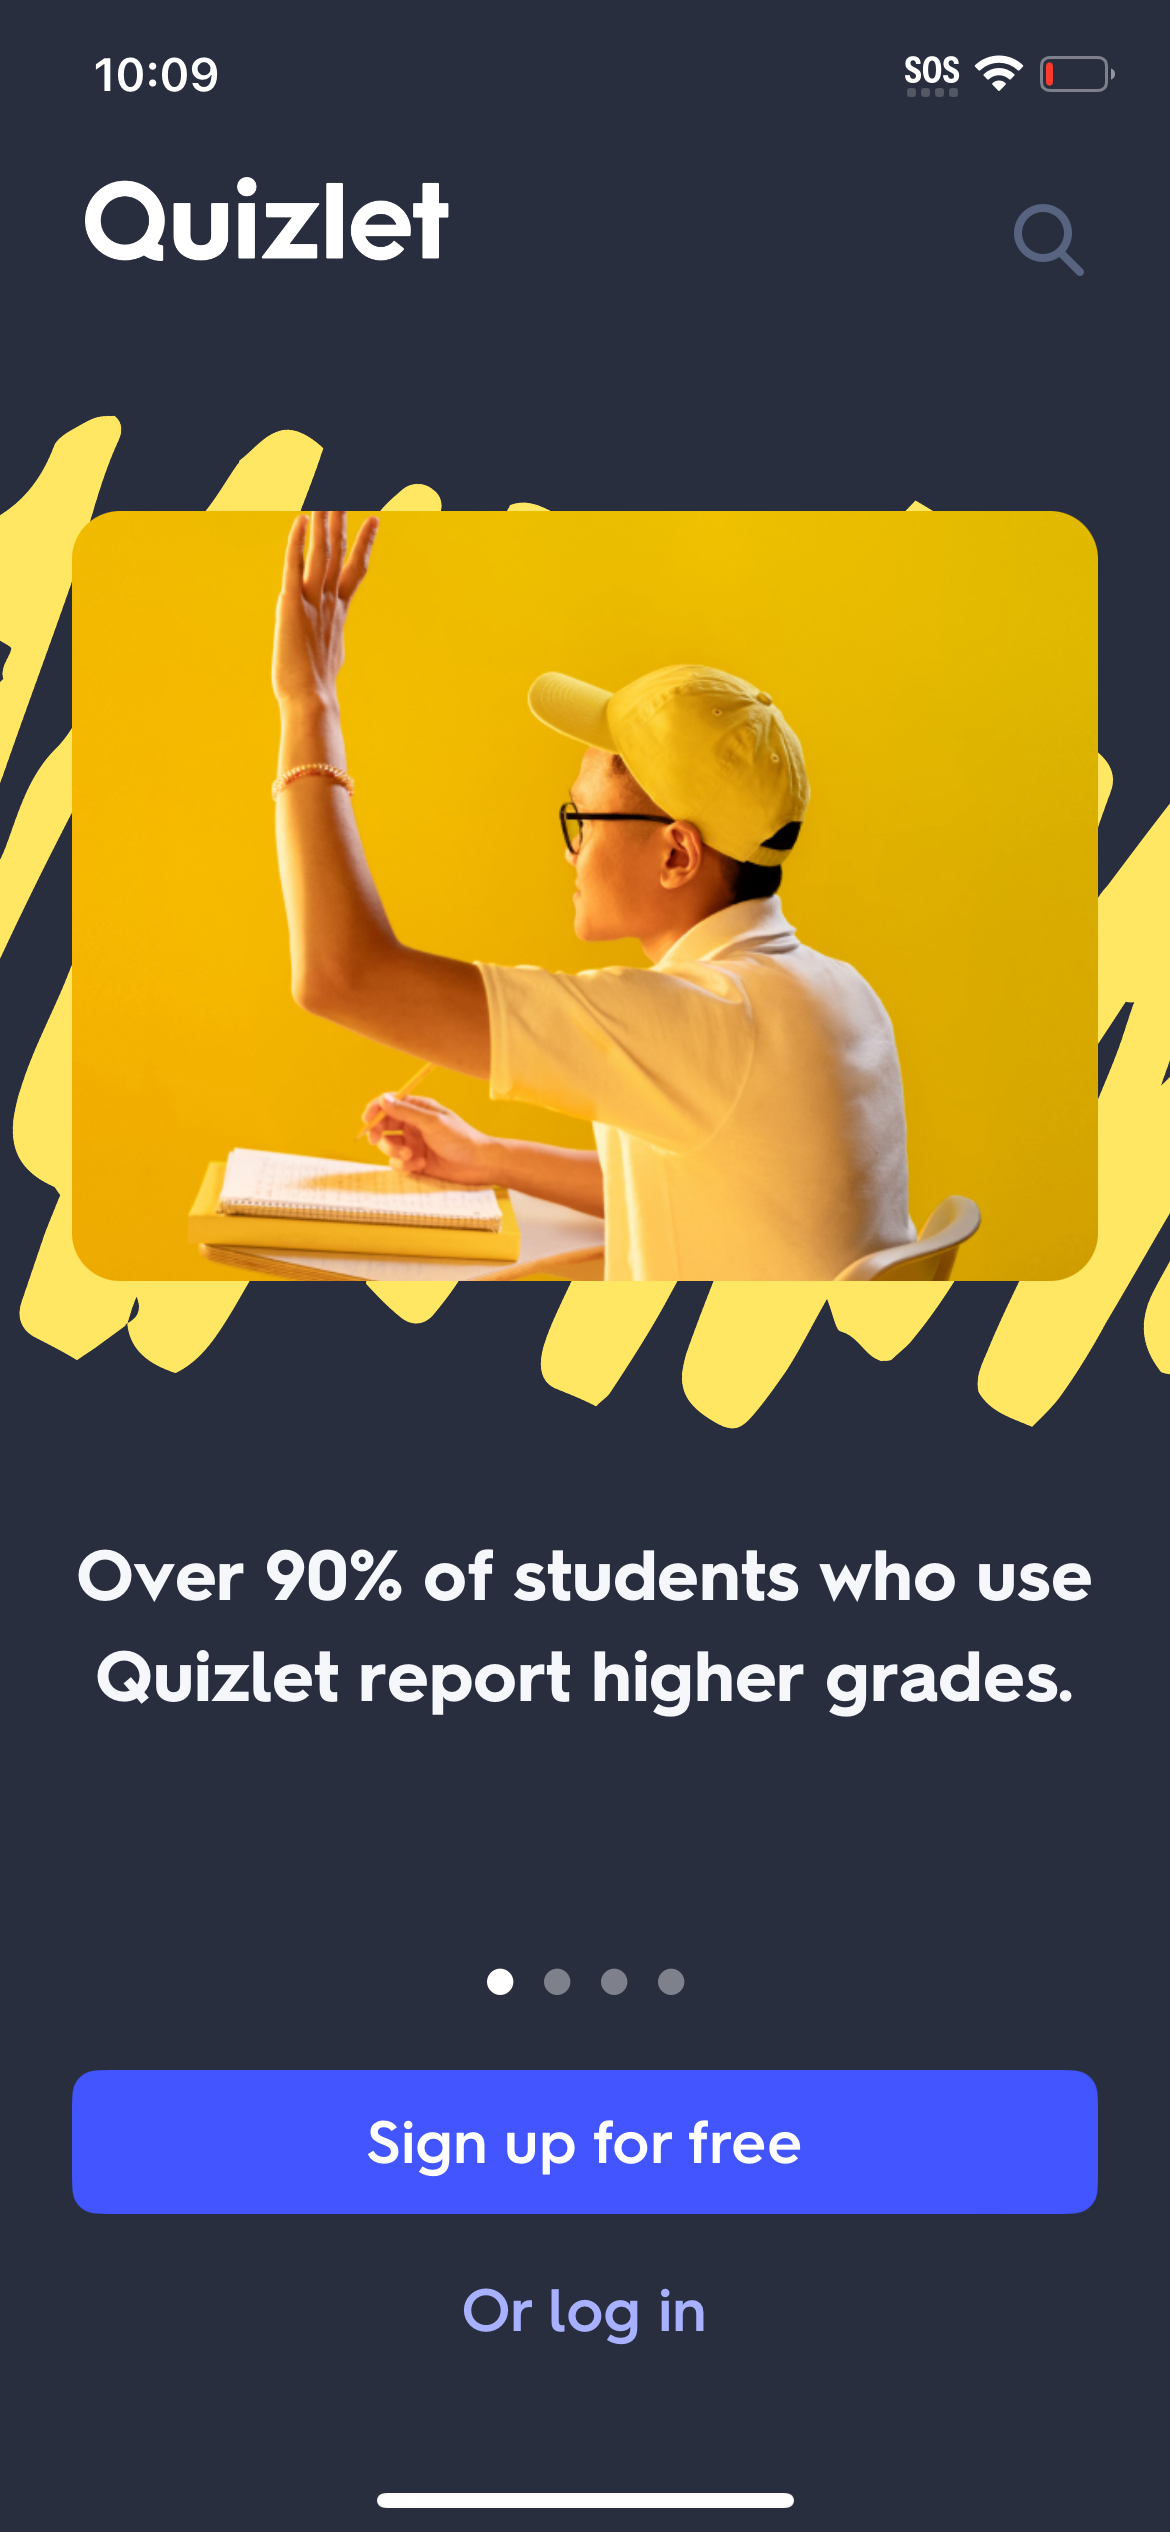
Quizlet1170 × 2532opens the full image
The numbers
| # | Stat | Computed from |
|---|---|---|
| [1] | 12 flows / 11 companies; avg 9.5; median 9; range 4-17 | category_photo_video |
| [2] | all-category avg 13.9; median 11; range 2-70 | onboarding_headline_distribution |
Methodology
Universe: 12 Photo & Video onboarding flows across 11 companies, within 129 total. Small sample (n=12): median, range, absolute counts only. Caveat: screens captured, not completions.
Sources
- [1]
Lazyweb Research analysis of 12 Photo & Video onboarding flows (11 companies), July 2026
Small-sample category cut; median + range with explicit n.
- [2]
Lazyweb Research analysis of 129 canonical onboarding flows (subset of 2,468 tracked flows), July 2026
All-category baseline.
Source: Lazyweb Research — proprietary analysis of real, in-market app screens. Cite as Lazyweb Research, 2026-07-07.
Explore the evidence
- Full 45-frame August 2026 capture
- Three captured screens · August 2026