Is 5 Onboarding Steps Too Many?
- By Ali Abouelatta
- n = 129
- Published
- Updated
- 2 min read
- onboarding · ux-patterns · signup · mobile · saas
Short answer
No. Across 129 tracked onboarding flows, 87% run 5 screens or more source[1], so a 5-step flow is shorter than the vast majority of apps. The median is 11 screens source[2], so at 5 steps you are well under typical. Only about 13% of tracked onboardings are shorter than 5 screens source[1].
113 of 129 tracked onboardings (87%) are 5 screens or longer, so a 5-step flow is leaner than most apps (July 2026).
Bar chart · Share
Share — How 5 compares to common thresholds
One block is about 3.1%
- >=5 screens
- 87% [1]
- >=10
- 57% [1]
- >=15
- 32% [1]
- >=20
- 20% [1]
The finding: 5 steps is short, not long
112 of 129 flows are 5 screens or more source[1], meaning 87% of tracked apps run at least as long as a 5-step flow, and only ~13% are shorter. Against a median of 11 source[2], a 5-step onboarding sits near the 25th percentile (p25 = 6) source[3]. Far from too many, 5 steps is on the lean side.
How 5 compares to common thresholds
A 5-step flow clears the lowest bar comfortably; more than half of apps go on to 10+ screens.
How to apply it
If you are worried 5 steps feels heavy, the benchmark data says the opposite — it's a fast flow relative to peers. The real question is whether each of those 5 screens earns its place, not whether the count is high. Save the friction budget for later screens if you need personalization or a paywall handoff.
Real in-market screens
Screens from real, in-market apps, tracked by Lazyweb Research.
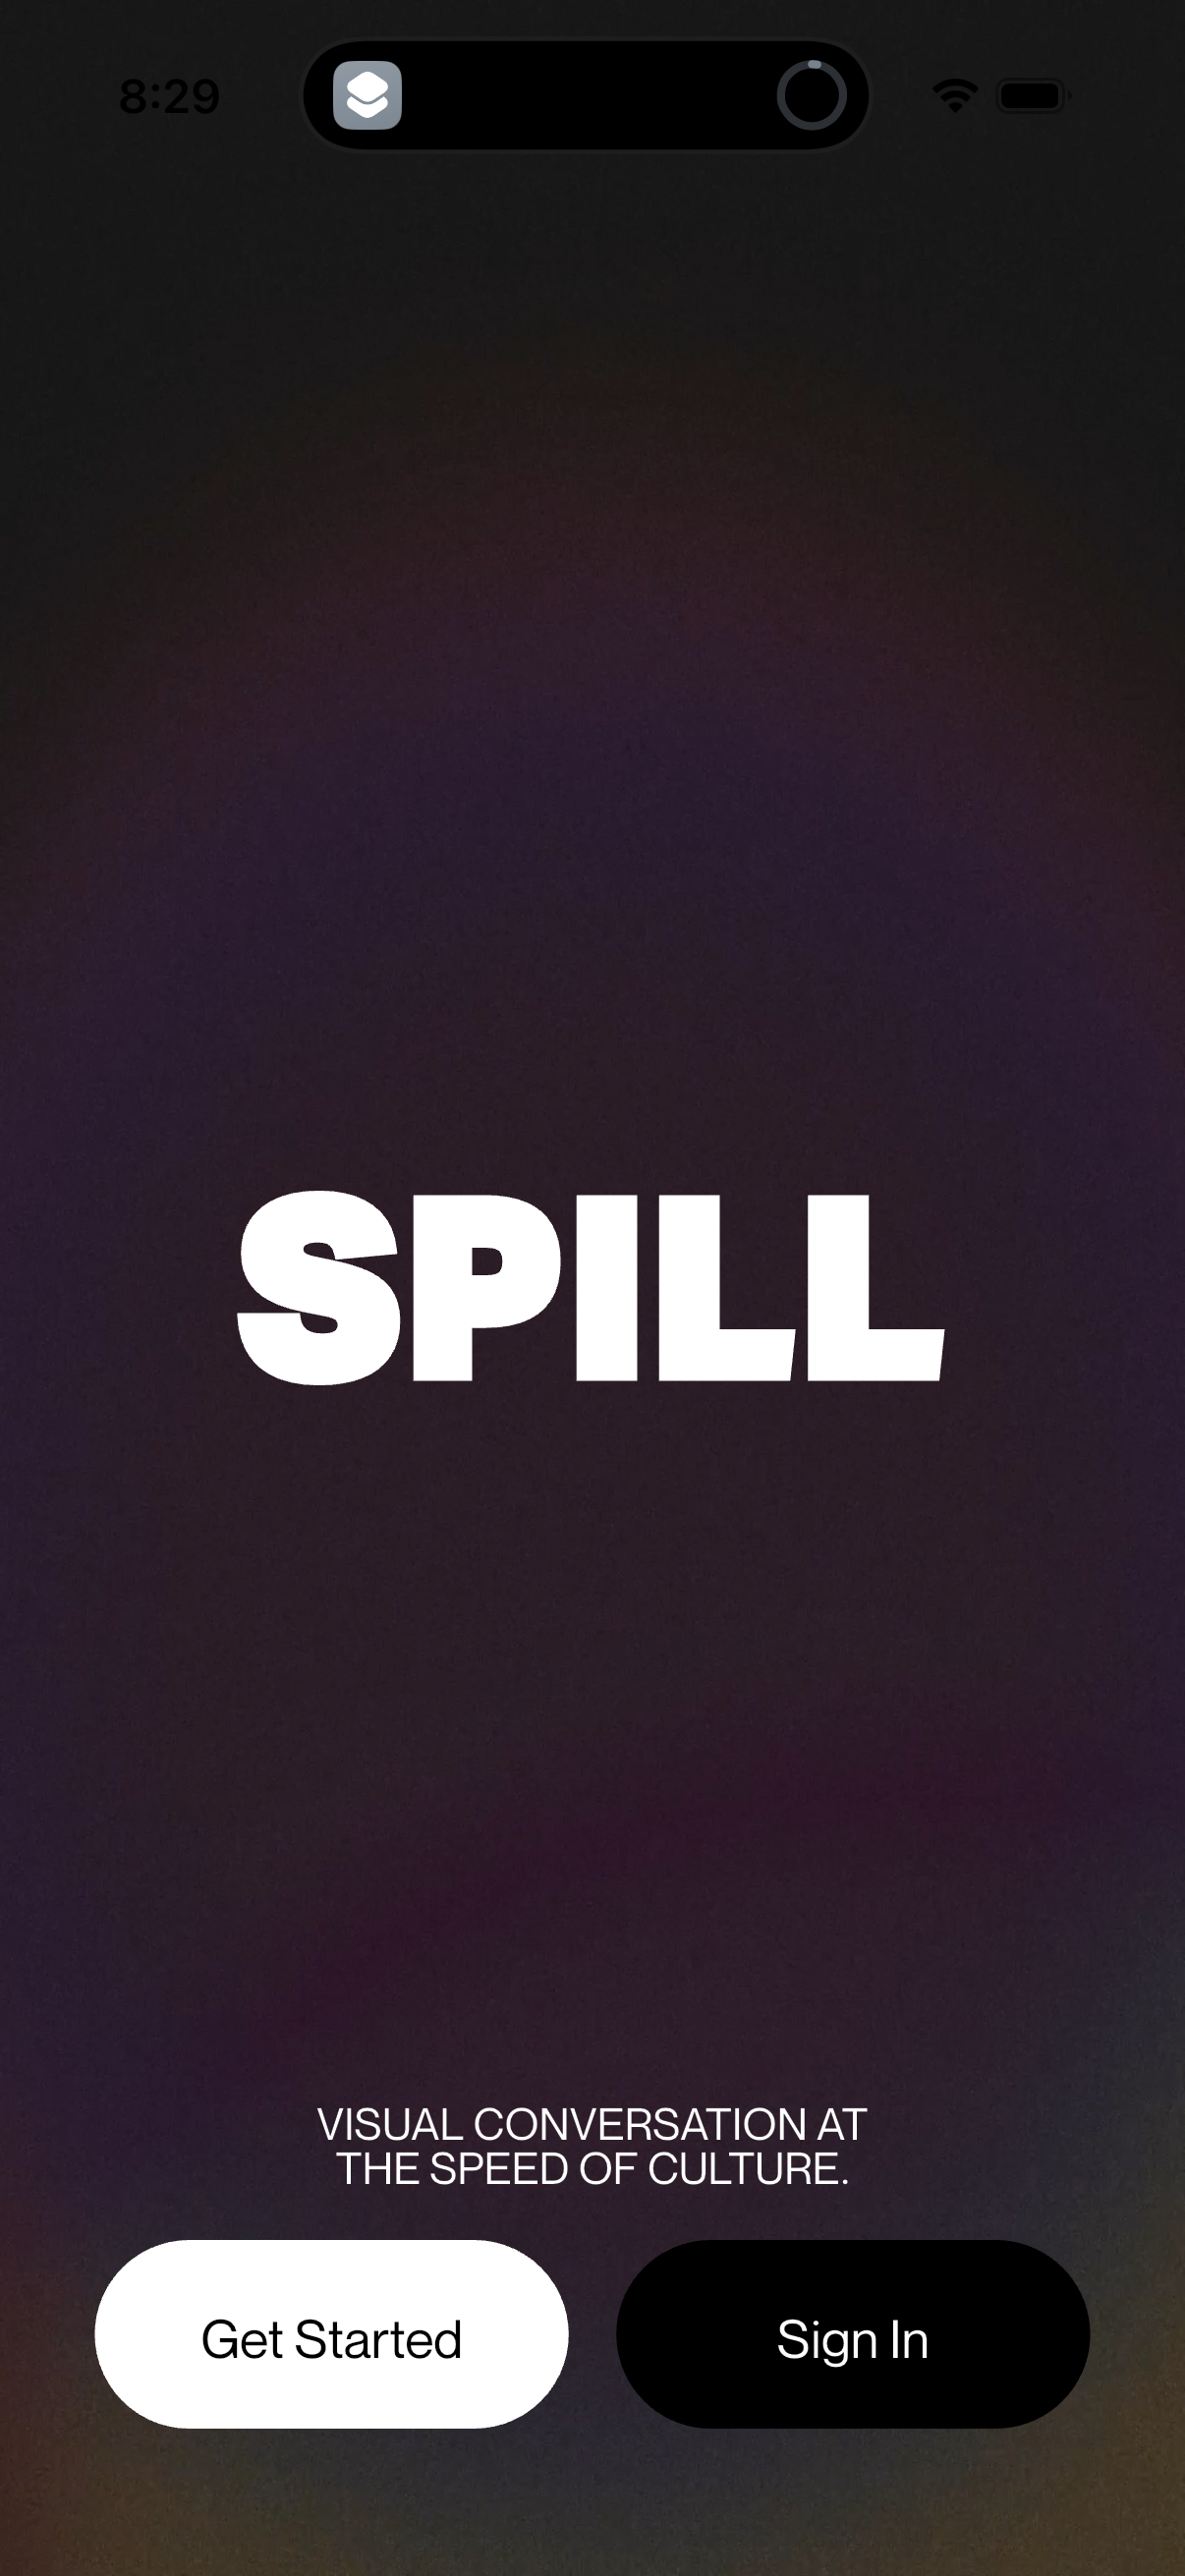
Spill1206 × 2622opens the full image 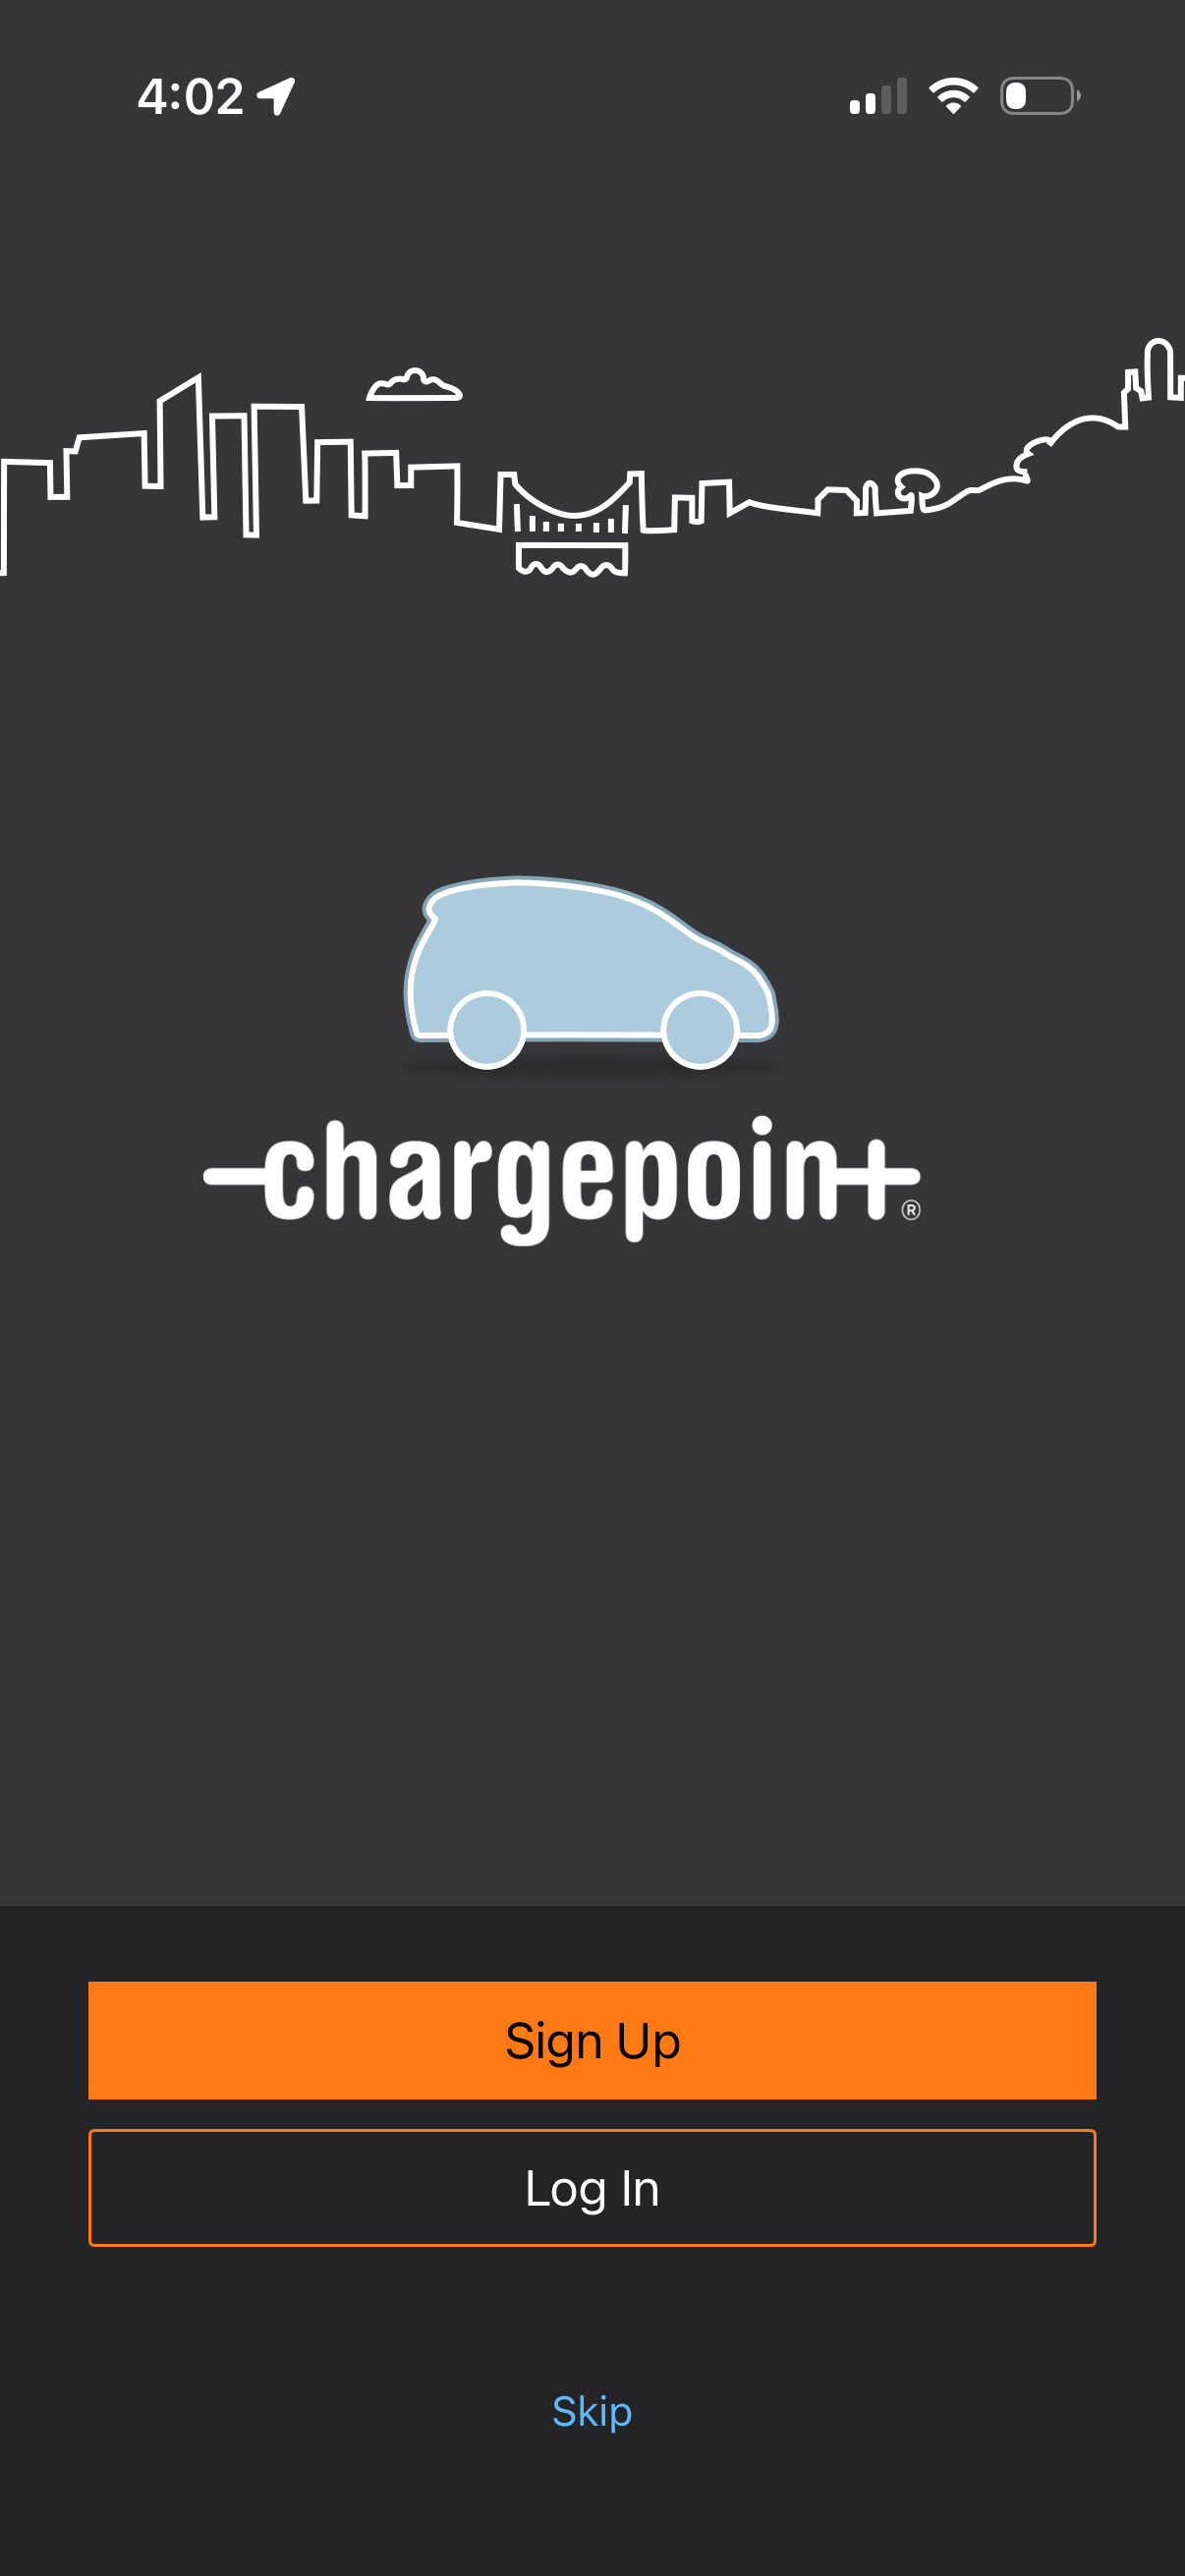
Chargepoint1206 × 2622opens the full image 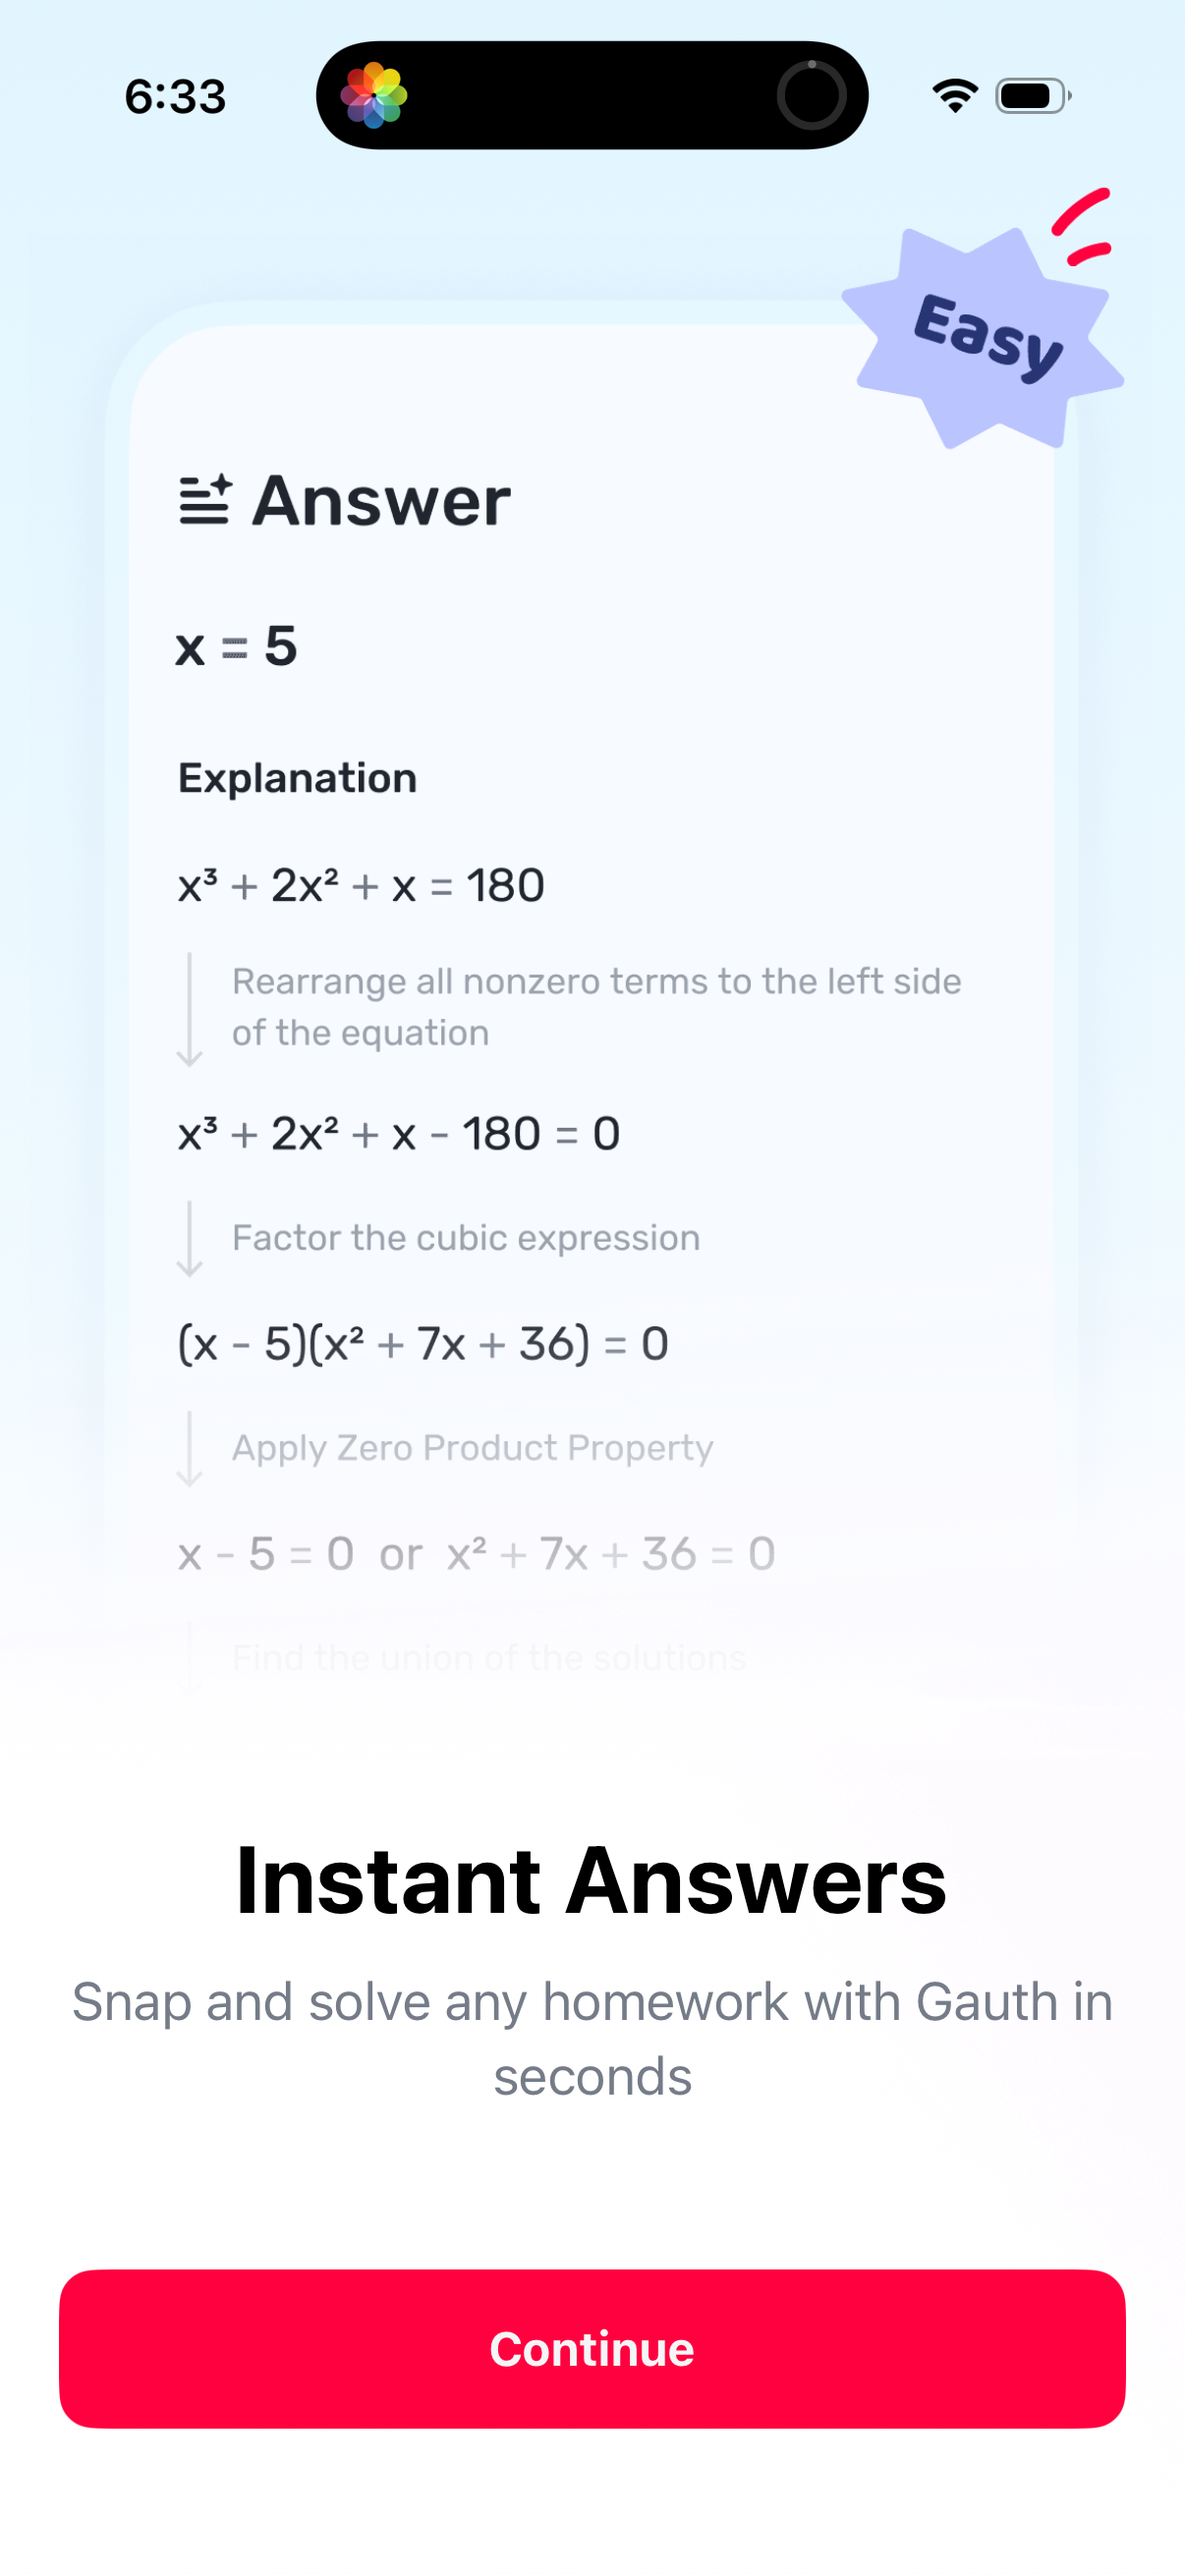
Gauthmath1206 × 2622opens the full image 
Calendly1179 × 2556opens the full image
The numbers
| # | Stat | Computed from |
|---|---|---|
| [1] | >=5: 112/129 (86.8%); >=10: 73/129; >=15: 41/129; >=20: 26/129 | is_N_too_many_thresholds |
| [2] | median 11 | onboarding_headline_distribution |
| [3] | p25 = 6 | onboarding_headline_distribution percentiles |
Methodology
Universe: 129 canonical onboarding flows within 2,468 tracked flows. Threshold shares are counts of flows with screen count at or above N, over n=129. Caveat: screens captured, not user completions.
Sources
- [1]
Lazyweb Research analysis of 129 canonical onboarding flows (subset of 2,468 tracked flows), July 2026
Share of flows at or above each screen threshold.
- [2]
Lazyweb Research analysis of 129 canonical onboarding flows (subset of 2,468 tracked flows), July 2026
Median screens per flow.
- [3]
Lazyweb Research analysis of 129 canonical onboarding flows (subset of 2,468 tracked flows), July 2026
p25 from the distribution.
Source: Lazyweb Research — proprietary analysis of real, in-market app screens. Cite as Lazyweb Research, 2026-07-07.
Explore the evidence
- Full 45-frame August 2026 capture
- Three captured screens · August 2026