What's the Median vs P90 Onboarding Length Across Tracked Apps?
- By Ali Abouelatta
- n = 129
- Published
- Updated
- 2 min read
- onboarding · ux-patterns · mobile · saas · design
Short answer
Across 129 tracked onboarding flows, the median is 11 screens and the p90 is 27 source[1]. That means the longest 10% of onboardings are more than twice the length of the typical one. The average (13.9) sits between them because a small number of 30-70 screen flows drag it upward source[1].
Median onboarding is 11 screens but p90 is 27 — the top decile runs 2.5x the typical flow (n=129, July 2026).
Bar chart · Flows
Flows — Where the long tail lives
One block is about 1.3 Flows
- 2-5 screens
- 27 [3]
- 6-10
- 36 [3]
- 11-15
- 29 [3]
- 16-20
- 13 [3]
- 21-30
- 13 [3]
- 31+
- 11 [3]
The finding: a 16-screen gap between median and p90
The median tracked onboarding is 11 screens; the p90 is 27 source[1]. The 16-screen spread between them shows how uneven onboarding length is across apps. For context, p25 is 6 and p75 is 17 source[2], so the middle 50% of apps live in a fairly tight 6-17 band, and the divergence happens entirely in the top decile.
Where the long tail lives
Of 129 flows, 11 exceed 30 screens source[3]. These are concentrated in Health & Fitness, whose category median is 20.5 source[4] — roughly double the overall median.
How to apply it
Report both numbers when you benchmark. The median (11) tells you what typical looks like; the p90 (27) tells you what a long flow looks like before it's a true outlier. If a stakeholder cites a 30-screen competitor onboarding as the norm, the data says only about 9% of tracked flows reach 30 source[3] — it's an outlier, not a standard.
Real in-market screens
Screens from real, in-market apps, tracked by Lazyweb Research.

Tolan602 × 1308opens the full image 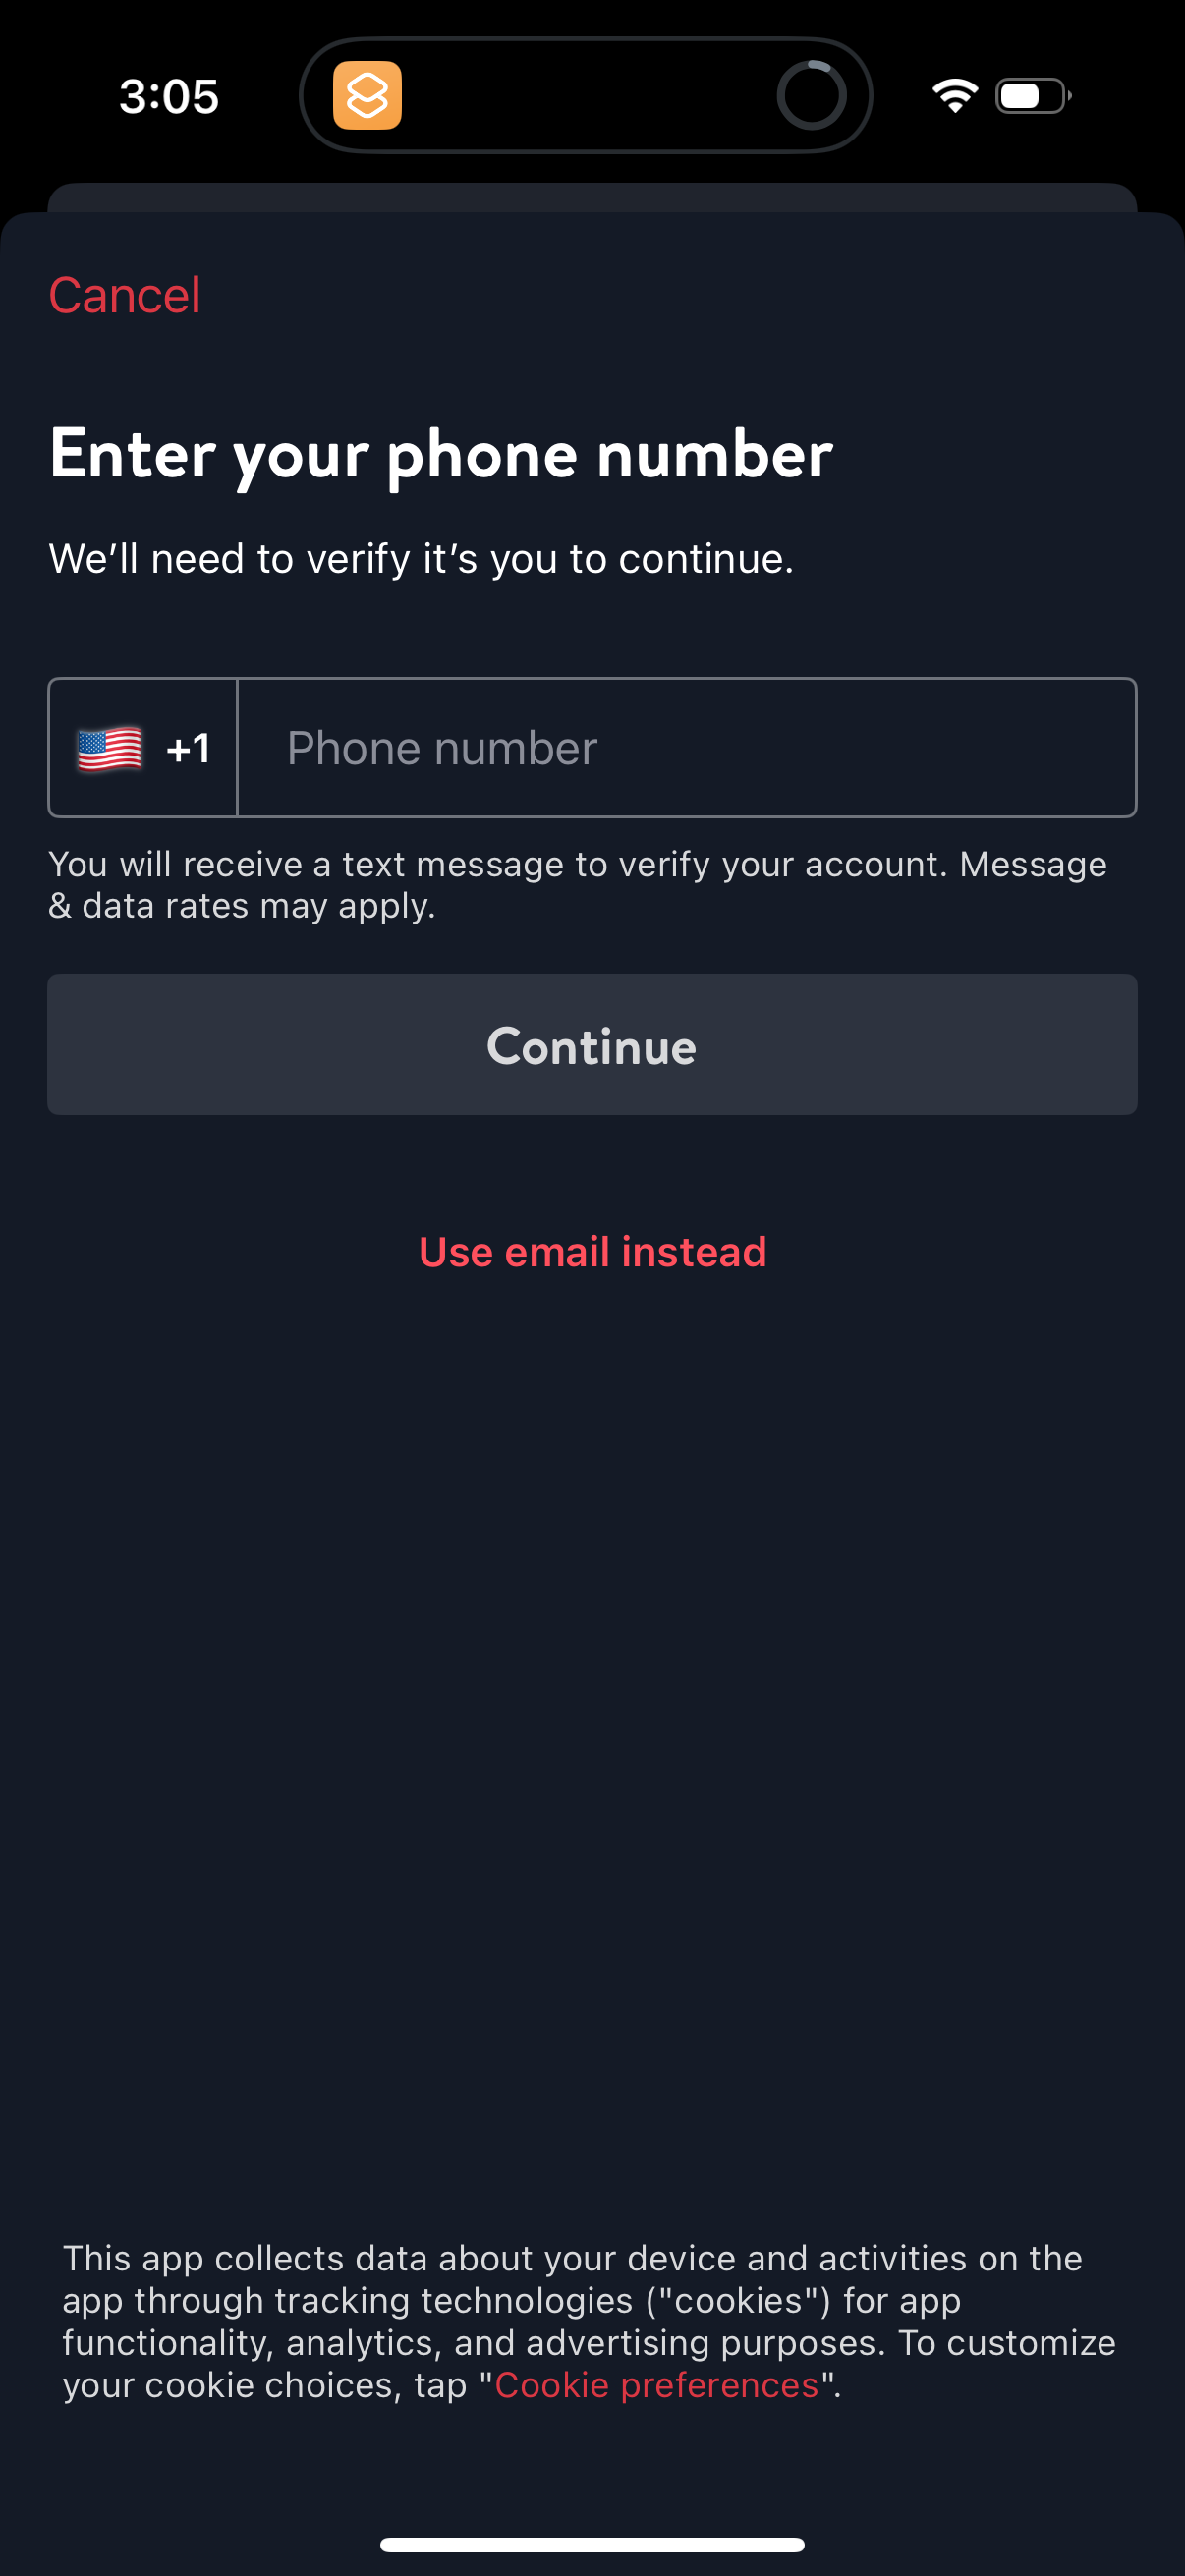
Opentable1206 × 2622opens the full image 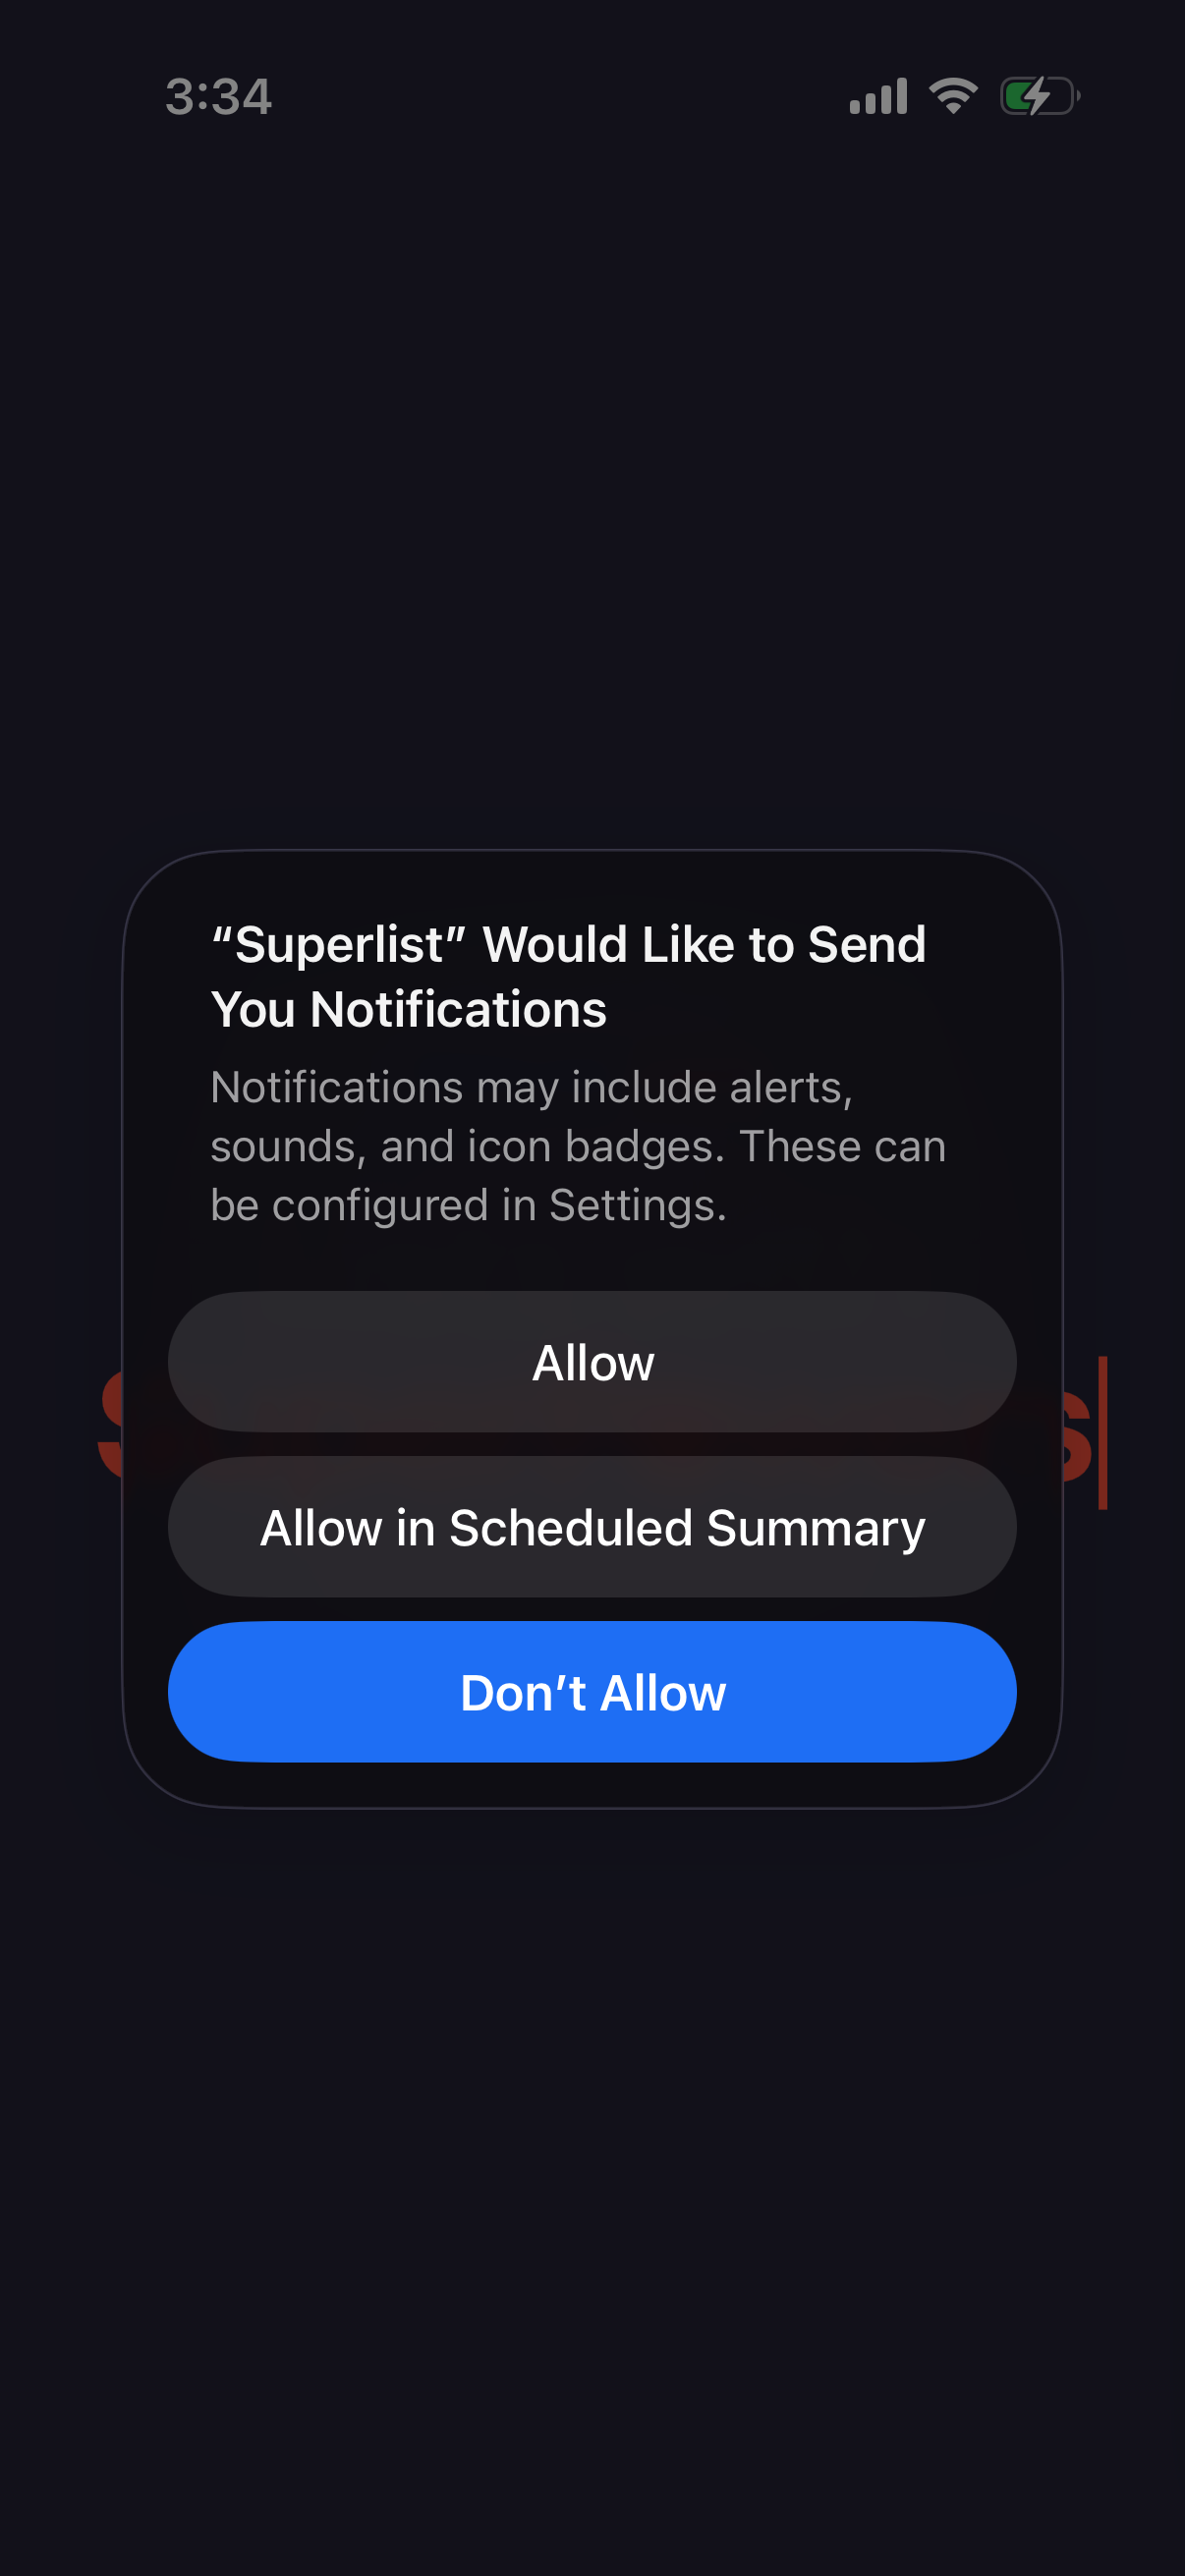
Superlist1206 × 2622opens the full image 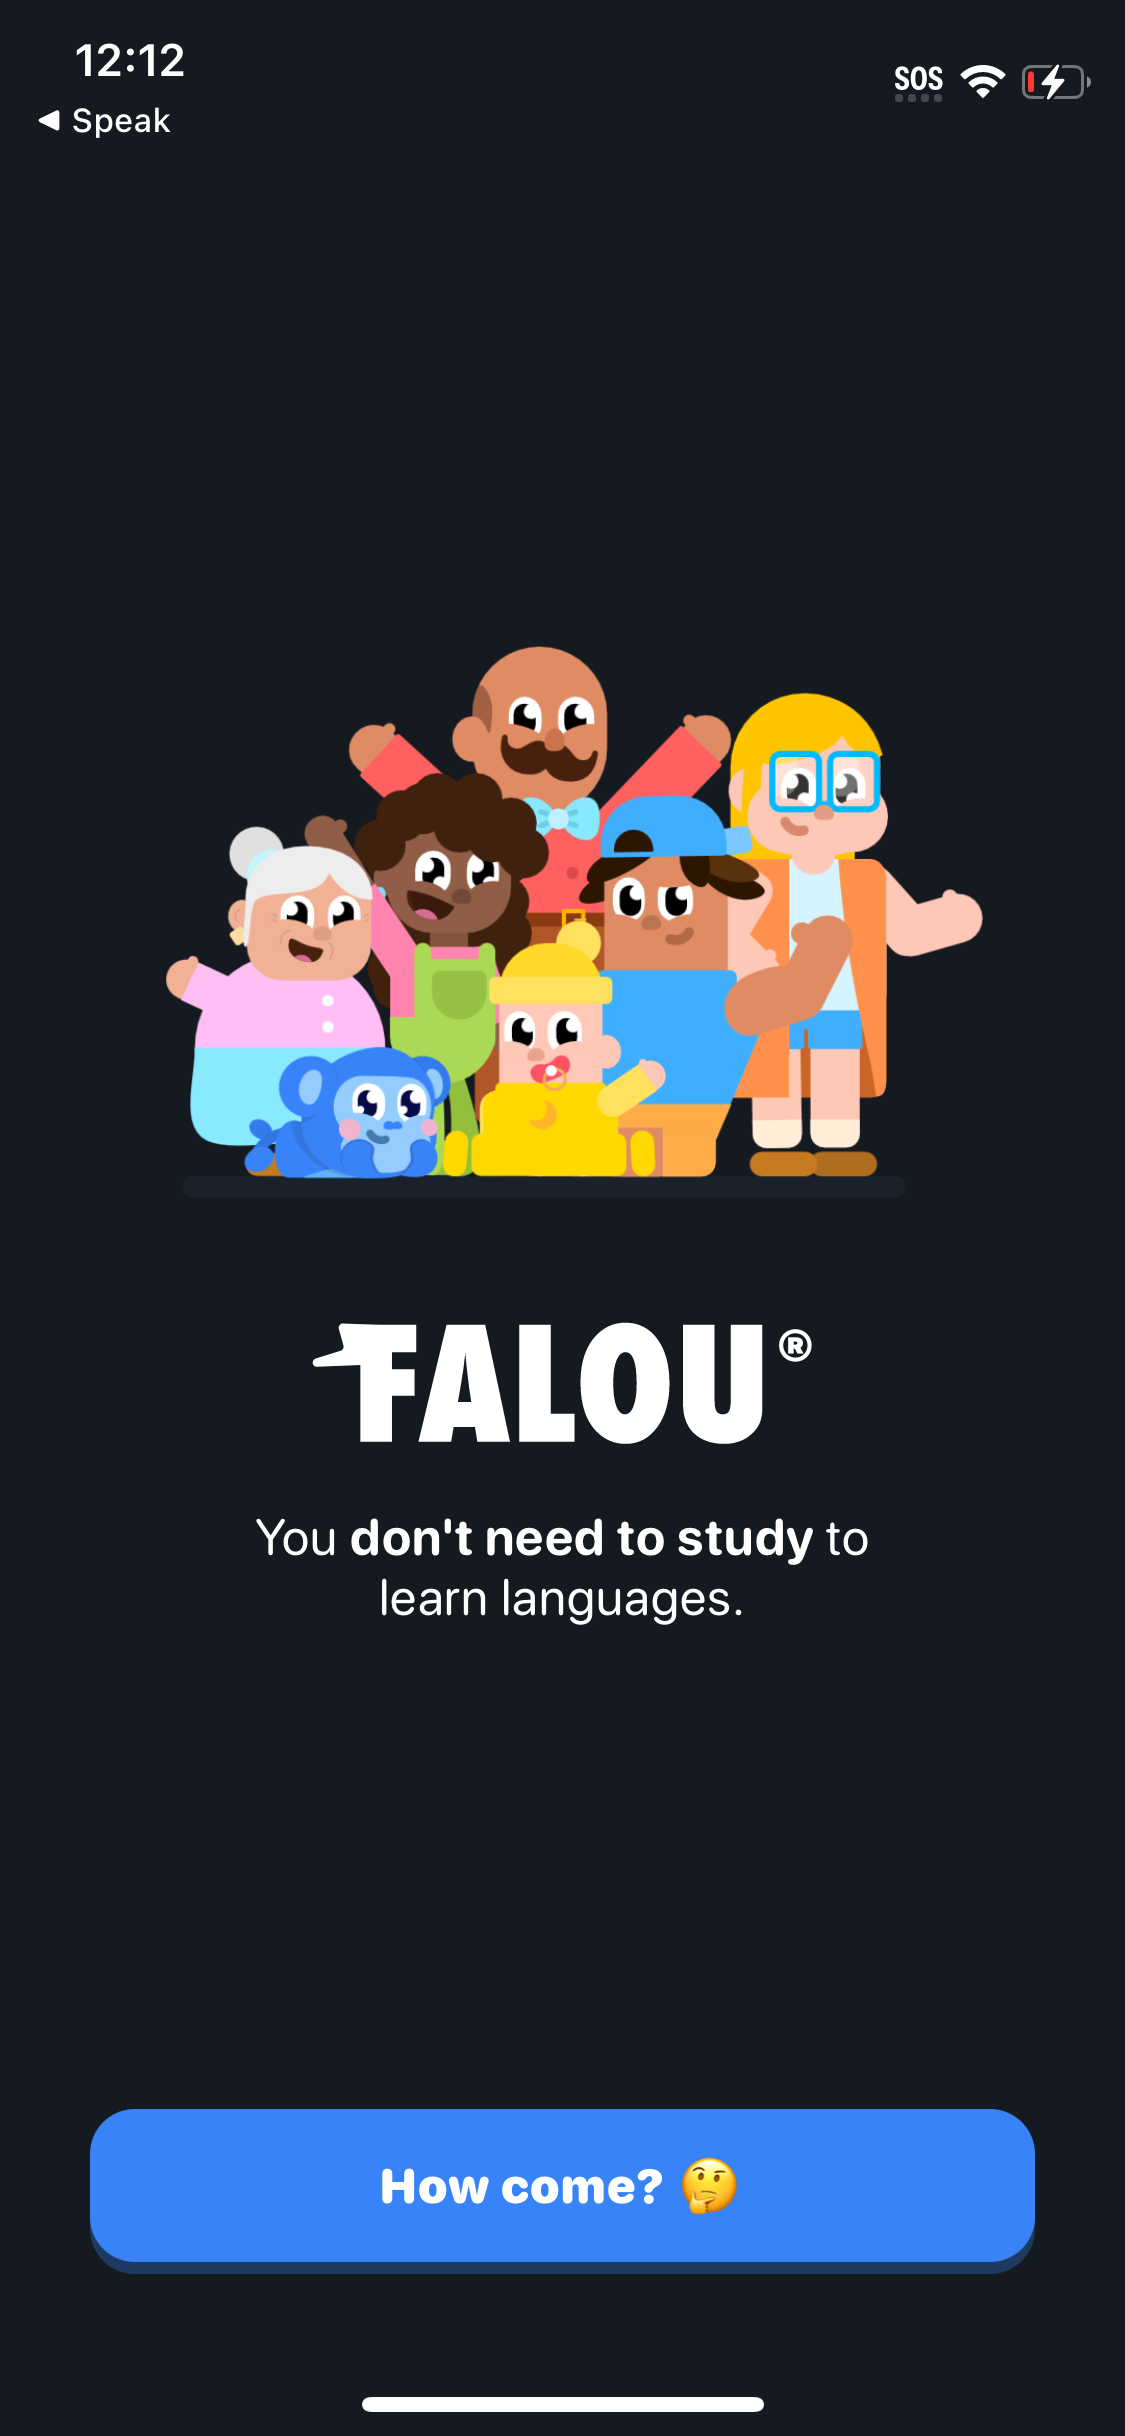
Falou1125 × 2436opens the full image
The numbers
| # | Stat | Computed from |
|---|---|---|
| [1] | median 11; p90 27.2; avg 13.9 | onboarding_headline_distribution |
| [2] | p25 = 6; p75 = 17 | onboarding_headline_distribution percentiles |
| [3] | buckets: 2-5:27, 6-10:36, 11-15:29, 16-20:13, 21-30:13, 31+:11 (n=129); 12 flows >=30 | onboarding_length_histogram + is_N_too_many_thresholds >=30 |
| [4] | Health & Fitness median 20.5 (n=26) | category_health_fitness |
Methodology
Universe: 129 canonical onboarding flows (125 companies) within 2,468 tracked flows. Percentiles and buckets computed over screens-per-canonical-flow. Caveat: right-skewed distribution, so median is the better central estimate than average.
Sources
- [1]
Lazyweb Research analysis of 129 canonical onboarding flows (subset of 2,468 tracked flows), July 2026
Median and p90 via PERCENTILE_CONT over screens-per-flow.
- [2]
Lazyweb Research analysis of 129 canonical onboarding flows (subset of 2,468 tracked flows), July 2026
p25/p75 from the same distribution.
- [3]
Lazyweb Research analysis of 129 canonical onboarding flows (subset of 2,468 tracked flows), July 2026
Length buckets and >=30 threshold count.
- [4]
Lazyweb Research analysis of 26 Health & Fitness onboarding flows, July 2026
Per-category median; n=26 across 24 companies.
Source: Lazyweb Research — proprietary analysis of real, in-market app screens. Cite as Lazyweb Research, 2026-07-07.
Explore the evidence
- Full 45-frame August 2026 capture
- Three captured screens · August 2026